


Managing a volunteer program is not just about tracking headcount—it is about measuring engagement, performance, impact, and consistency over time. However, many organizations still rely on scattered spreadsheets and manual reports, which makes it difficult to understand what is working and where improvements are needed. That is exactly why the Volunteer Program KPI Dashboard in Power BI becomes a game-changing solution.
This ready-to-use Power BI dashboard converts raw volunteer data into clear visuals, KPI cards, performance tables, and trend charts. Instead of spending hours preparing reports, program managers can instantly track Month-to-Date (MTD), Year-to-Date (YTD), target vs actual performance, and year-over-year comparisons. Because the dashboard uses Excel as the data source, it remains flexible, easy to maintain, and suitable for organizations of all sizes.
Whether you manage a small community initiative or a large NGO volunteer network, this dashboard helps you measure impact, improve accountability, and make data-driven decisions with confidence.
📊 Key Features of the Volunteer Program KPI Dashboard in Power BI
This dashboard is thoughtfully designed to support both high-level reviews and detailed KPI analysis.
✨ Centralized KPI Monitoring
Track all volunteer KPIs in one professional Power BI dashboard.
🎯 MTD & YTD Performance Tracking
Monitor Month-to-Date and Year-to-Date performance with automated calculations.
📈 Target vs Actual Comparison
Instantly identify gaps using percentage comparisons and visual indicators.
🔁 Previous Year Comparison
Measure improvement using Current Year vs Previous Year analysis.
🎛 Interactive Slicers
Filter data dynamically by Month, KPI Group, and KPI Name.
🟢 Visual Performance Indicators
Green and red arrow icons clearly highlight success or risk areas.
📦 What’s Inside the Volunteer Program KPI Dashboard in Power BI
This dashboard includes three powerful analytical pages, each serving a specific purpose.
📍 Summary Page – Complete KPI Performance View
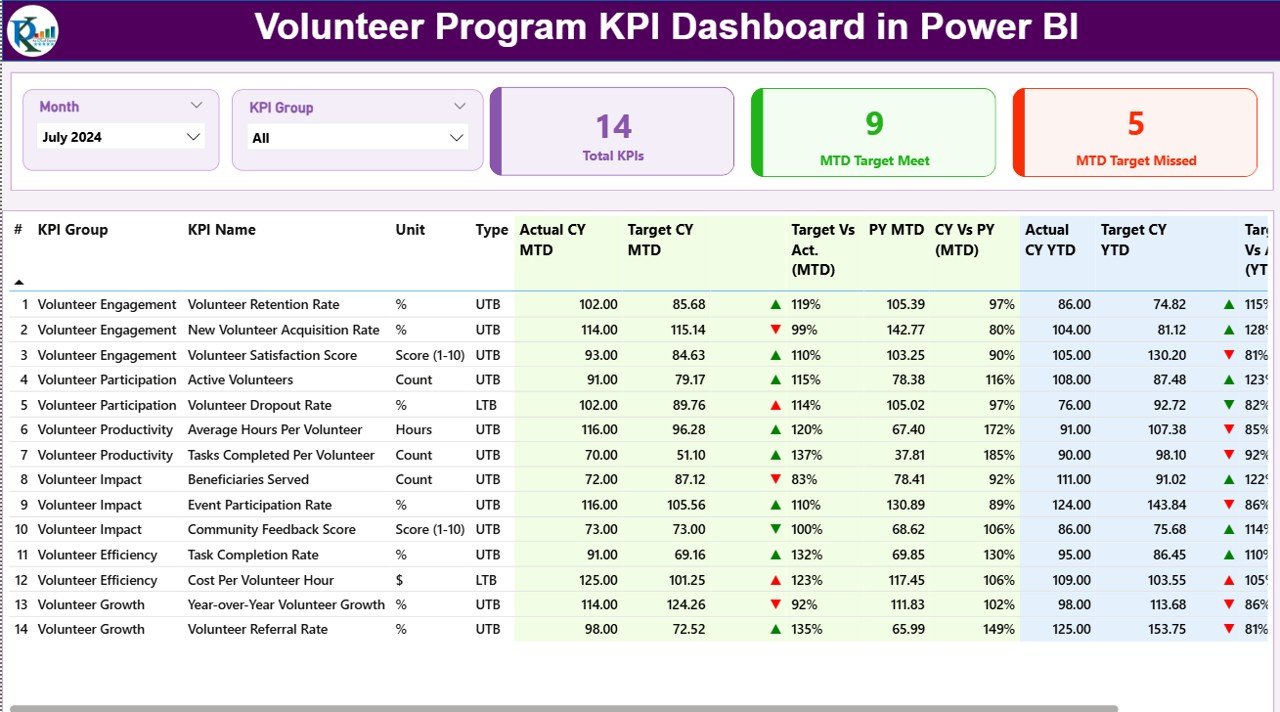
The Summary Page is the main landing page of the dashboard.
Top Slicers
-
Month selector
-
KPI Group selector
KPI Cards
-
Total KPIs Count
-
MTD Target Met Count
-
MTD Target Missed Count
Detailed KPI Performance Table
The table displays:
-
KPI Number, KPI Group, KPI Name
-
Unit and KPI Type (UTB / LTB)
-
Actual vs Target (MTD & YTD)
-
Green ▲ / Red ▼ performance icons
-
Current Year vs Previous Year comparisons
This page allows leaders to understand overall volunteer program health in seconds.
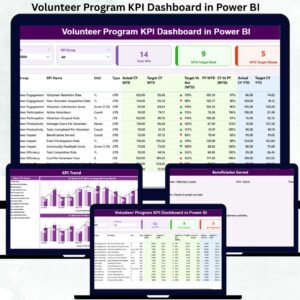
📉 KPI Trend Page – Performance Movement Over Time
The KPI Trend Page focuses on historical performance trends.
Charts Included
-
📊 MTD Actual vs Target vs Previous Year
-
📊 YTD Actual vs Target vs Previous Year
A KPI Name slicer on the left lets users select any KPI and instantly view its trend. As a result, seasonality, growth patterns, and performance gaps become very easy to identify.
📘 KPI Definition Page – Full KPI Transparency
The KPI Definition Page acts as a drill-through page.
It displays:
-
KPI Formula
-
KPI Definition
-
Unit of Measurement
-
KPI Type (LTB / UTB)
Users can drill through from the Summary Page to understand exactly how each KPI is calculated. A back button allows quick navigation to the main dashboard.
⚙️ How to Use the Volunteer Program KPI Dashboard
1️⃣ Enter Actual KPI values in the Input_Actual Excel sheet
2️⃣ Enter Target KPI values in the Input_Target sheet
3️⃣ Maintain KPI logic in the KPI Definition sheet
4️⃣ Refresh the Power BI file
5️⃣ Use slicers to filter performance
6️⃣ Review KPI cards, tables, and trends
No coding. No complex setup. Just structured data and instant insights.
👥 Who Can Benefit from This Dashboard?
This dashboard is ideal for:
-
🤝 Volunteer Coordinators
-
🏢 Non-Profit Organizations
-
🌍 NGOs & Community Groups
-
📊 Impact & Monitoring Teams
-
💼 CSR Departments
-
💰 Donor Reporting Teams
Anyone managing volunteers and measuring impact will benefit immediately.
### Click here to read the Detailed blog post
Visit our YouTube channel to learn step-by-step video tutorials
👉 Youtube.com/@PKAnExcelExpert


Reviews
There are no reviews yet.