


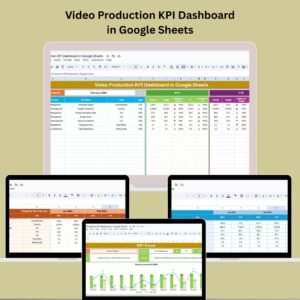
In today’s fast-paced digital landscape, video is king. Whether you’re managing client deliverables, producing internal training videos, or building YouTube content, performance tracking is crucial. That’s where the Video Production KPI Dashboard in Google Sheets becomes your ultimate asset.Video Production KPI Dashboard in Google Sheets

This ready-to-use Google Sheets template empowers creators, agencies, and businesses to track all key production metrics, compare against targets and previous years, and make informed decisions—all in one place. It combines simplicity, functionality, and visual power with no expensive software or complex setup.Video Production KPI Dashboard in Google Sheets
🎯 What Is the Video Production KPI Dashboard in Google Sheets?
This dashboard is a centralized system designed to monitor every stage of video production, from ideation to publishing. It helps you:
-
View Month-To-Date (MTD) and Year-To-Date (YTD) actuals
-
Compare actual values to targets and previous year’s data
-
Spot trends, track growth, and improve team performance
-
Foster accountability across production roles
Built in Google Sheets, the dashboard delivers real-time updates, seamless collaboration, and automated visuals—perfect for fast-moving creative teams.
📊 Key Features of the Video Production Dashboard
This dashboard template is built with six structured sheets, each optimized for clarity and control:
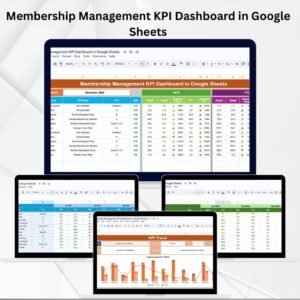
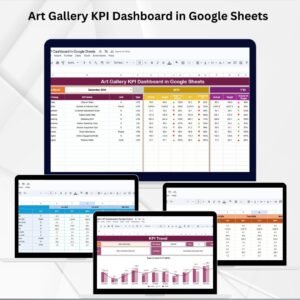
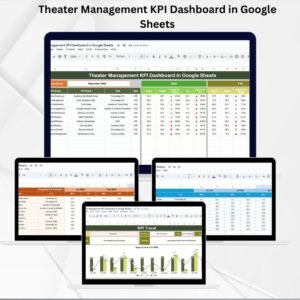
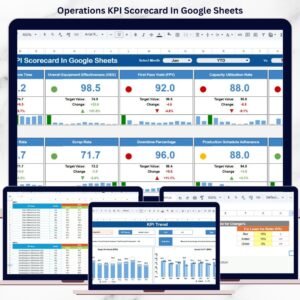
1. Dashboard Sheet Tab
Your main control panel. It displays:
-
MTD and YTD Actual, Target, and Previous Year values
-
Up/down arrows showing performance vs. goals and history
-
Dynamic KPI cards and progress visuals
-
Monthly dropdown filter (cell D3)
2. KPI Trend Sheet Tab
Select a KPI from the dropdown (cell C3) to view detailed monthly trends with:
-
KPI Group & Unit
-
Performance Type: UTB (Upper the Better) or LTB (Lower the Better)
-
Formula and Definition
3. Actual Number Sheet Tab
Input monthly actual numbers for each KPI (MTD & YTD). Start your fiscal year by selecting the first month in cell E1 for automated data flow.
4. Target Sheet Tab
Set benchmarks for your team by entering monthly KPI targets. Compare these with real-time results to measure progress.
5. Previous Year Number Sheet Tab
Store historical performance data here. The dashboard uses this to calculate year-over-year growth.
6. KPI Definition Sheet Tab
Maintain a clean reference sheet for all your KPIs with:
-
Name, Unit, Formula
-
Definition
-
Performance Type (UTB or LTB)
🚀 Why Use This Dashboard?
-
📍 All-in-One Tracker: Centralized access to production KPIs.
-
🔄 Real-Time Updates: Charts and metrics refresh as data is updated.
-
🎯 Goal Alignment: Easy comparison with monthly/yearly targets.
-
📈 Performance Visibility: Spot bottlenecks, inefficiencies, and successes.
-
🤝 Collaborative: Multiple users can view, update, or analyze from anywhere.
-
✅ No Coding Required: All formulas and logic are built-in—just enter your data!
✨ Opportunities for Improvement
You can enhance this dashboard even further with:
-
📅 Weekly Tracking Columns
-
📂 Video Category Filters (e.g., Ads, Tutorials, Explainers)
-
🌍 Region-Level Insights
-
🤖 Google Explore Tool for AI-powered analytics
-
📥 Form Integration for data collection from production teams
💡 Best Practices
-
Keep your KPI names clear and definitions short.
-
Regularly update actuals (weekly or monthly).
-
Use dropdowns and validation for consistent data input.
-
Monitor both “Upper the Better” and “Lower the Better” KPIs.
-
Grant editor access only to team leads to maintain accuracy.
-
Archive annual data to keep the workbook light and fast.
✅ Who Should Use This Template?
This template is perfect for:
-
📽️ Video Editors & Creators
-
🎥 Production Managers
-
📈 Marketing Agencies
-
🧑💼 In-House Video Teams
-
📊 Content Strategists
If you manage video assets and care about deadlines, quality, efficiency, or budget—you need this.
Click here to read the Detailed blog post
Watch the step-by-step video Demo:


Reviews
There are no reviews yet.