
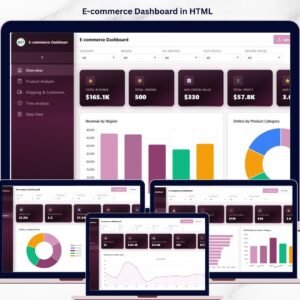
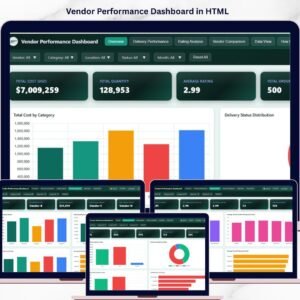
Vendor Performance Dashboard in HTML is the ultimate interactive solution for procurement and supply chain professionals who need to monitor vendor performance, delivery metrics, quality ratings, and procurement costs — all from a single centralized dashboard. This modern HTML-based dashboard transforms complex vendor data into clear, visual, and actionable insights through interactive charts, KPI cards, and dynamic filters. Whether you manage 10 vendors or 100, this dashboard gives you the clarity you need to make smarter procurement decisions instantly.
Instead of juggling multiple spreadsheets, this dashboard consolidates everything into 5 powerful analytical pages — including an Overview, Delivery Performance, Rating Analysis, Vendor Comparison, and a Data View with full search, sort, and export capabilities. The Vendor Performance Dashboard in HTML includes 5 interactive pages and tracks 5 key performance indicators including Total Cost, Total Quantity, Average Rating, Total Orders, and Units Ordered.
 Vendor Performance Dashboard Overview
🔑 Key Features of Vendor Performance Dashboard in HTML
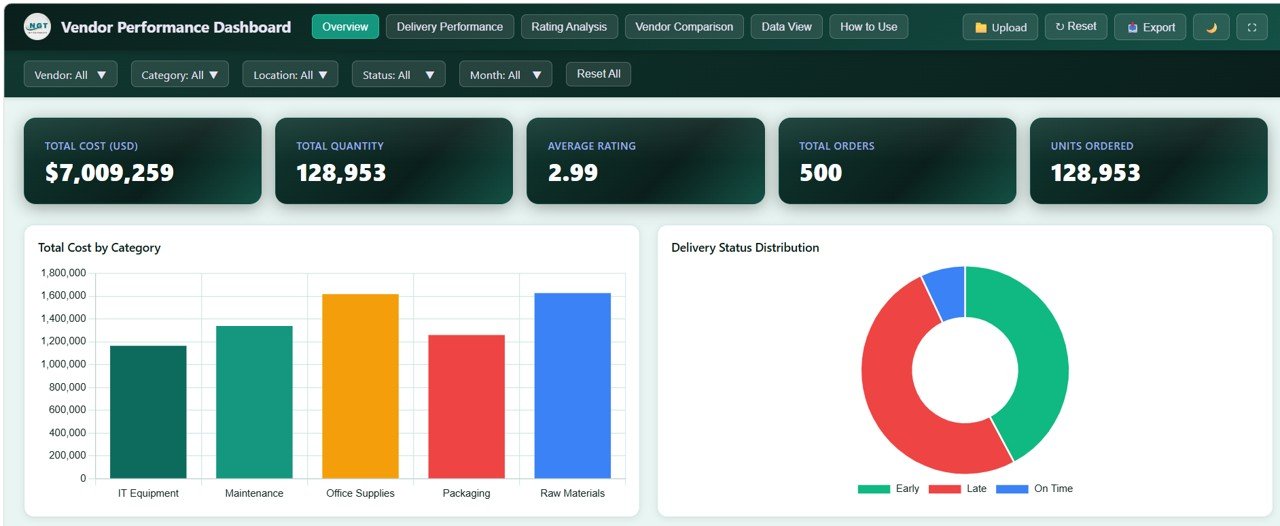
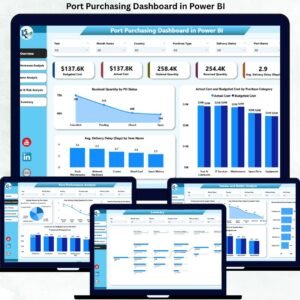
📊 Interactive KPI Cards – Monitor Total Cost (USD), Total Quantity, Average Rating, Total Orders, and Units Ordered at a glance from the Overview page.
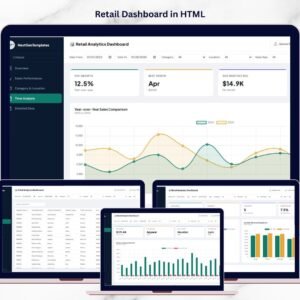
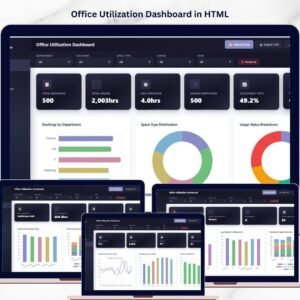
📈 Overview Page with Advanced Filters – The Overview page displays high-level KPI cards along with analytical charts such as Total Cost by Category, Procurement Cost by Month, Total Cost by Region, Total Cost by Vendor, and Order Count by Delivery Status. Multiple slicers let you filter data dynamically and see results instantly.
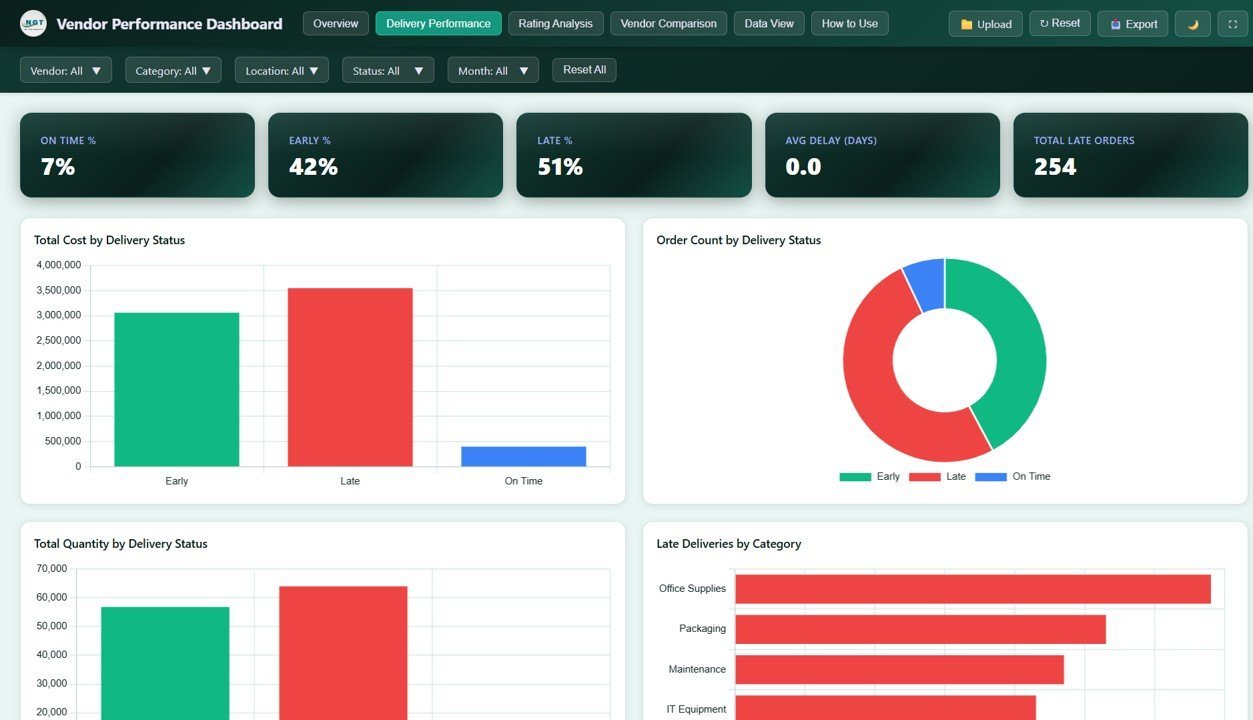
🚚 Delivery Performance Analysis – A dedicated page tracks Total Cost by Delivery Status, Total Quantity by Delivery Status, Order Count by Delivery Status, Delivery Status by Vendor, and Late Deliveries by Category — helping you identify vendors causing delays and shipment issues.
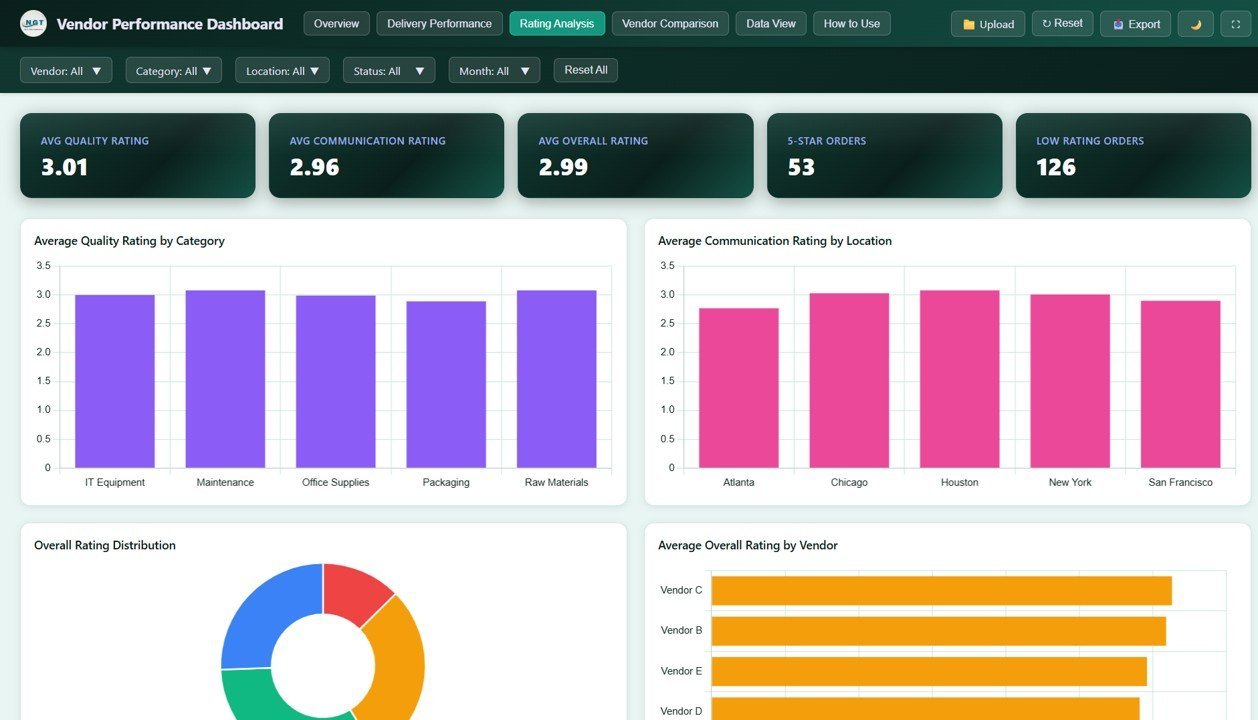
⭐ Rating Analysis Page – Evaluate vendor quality with charts covering Average Quality Rating by Category, Average Communication Rating by Location, Order Count by Overall Rating, Average Rating by Month, and Average Overall Rating by Vendor.
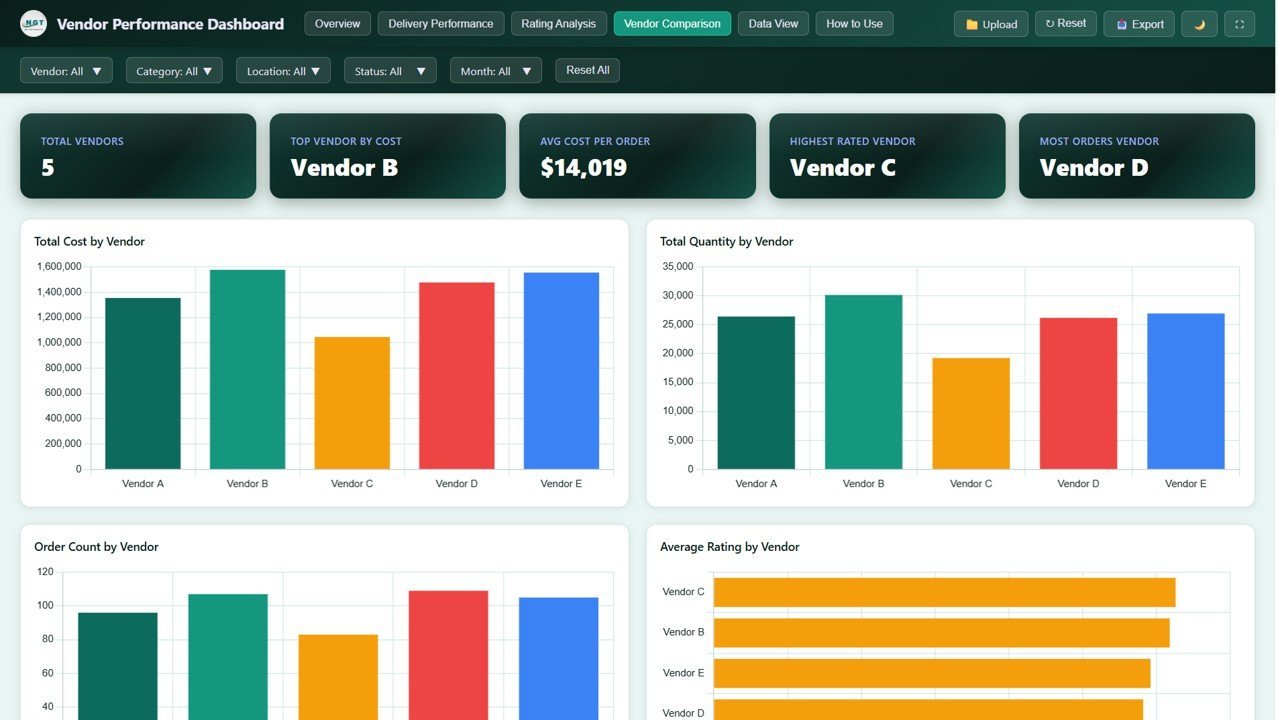
🏆 Vendor Comparison Page – Side-by-side vendor evaluation using Total Cost by Vendor, Total Quantity by Vendor, Order Count by Vendor, Cost and Quantity by Vendor, and Average Rating by Vendor — making it simple to identify your top-performing and underperforming suppliers.
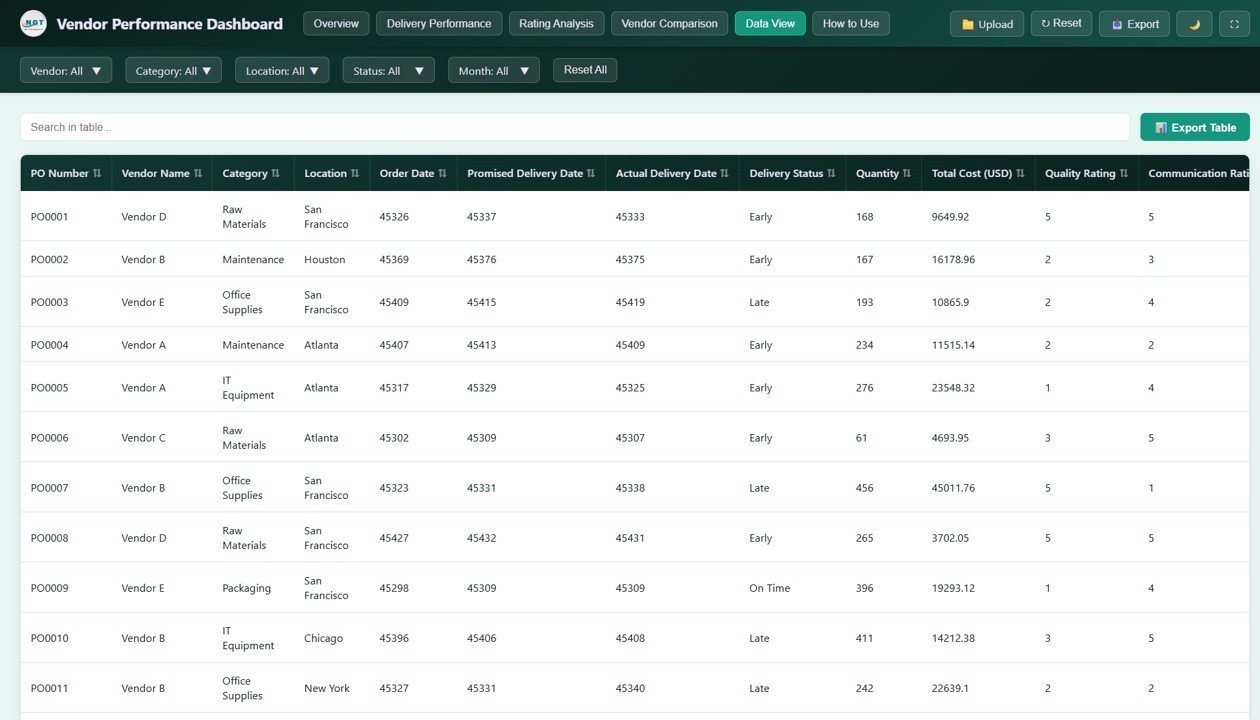
📋 Data View Page – Access every record in a detailed data table with built-in search, sorting, pagination, and CSV export functionality for deeper analysis and reporting.
🔍 Dynamic Filtering – Apply filters across all pages to drill down into specific vendors, categories, regions, and delivery statuses instantly.
⚡ No Coding Required – Simply unzip the file and open index.html in any modern browser. Replace sample data with your own and the dashboard updates automatically.
If you are looking for more HTML Dashboard Templates, explore our full collection. You may also find our Supply Chain Analytics Dashboard in HTML useful for broader supply chain monitoring, or check out the Inventory Management Dashboard in HTML for stock and warehouse tracking.
📦 What’s Inside the Vendor Performance Dashboard in HTML
📊 Overview Page – High-level summary with 5 KPI cards (Total Cost, Total Quantity, Average Rating, Total Orders, Units Ordered) and 5 analytical charts covering cost by category, procurement trends by month, regional cost distribution, vendor cost breakdown, and delivery status counts. Interactive slicers allow quick filtering across all metrics.
🚚 Delivery Performance Page – Focused analysis on delivery efficiency with 5 charts that break down cost, quantity, and order count by delivery status, plus vendor-wise delivery performance and late delivery patterns by category.
⭐ Rating Analysis Page – Deep dive into vendor quality with 5 charts covering quality ratings by category, communication ratings by location, order distribution by overall rating, monthly rating trends, and overall vendor ratings.
🏆 Vendor Comparison Page – Side-by-side analysis with 5 charts comparing vendors on cost, quantity, order count, combined cost-quantity metrics, and average ratings.
📋 Data View Page – Complete data table with search, sort, pagination, and CSV export for record-level analysis and custom reporting.
⚙️ How to Use the Vendor Performance Dashboard in HTML
1️⃣ Download and Extract – Download the ZIP file and extract it to any folder on your computer.
2️⃣ Open in Browser – Double-click index.html to open the dashboard in Chrome, Edge, Firefox, or any modern browser.
3️⃣ Replace Sample Data – Open the data file and replace the demo data with your actual vendor, procurement, and delivery records.
4️⃣ Analyze Performance – Navigate through the 5 dashboard pages to monitor KPIs, compare vendors, track delivery performance, and evaluate ratings.
5️⃣ Export Data – Use the Data View page to search, filter, and export records to CSV for presentations and reporting.
👥 Who Can Benefit from This Vendor Performance Dashboard in HTML
📦 Procurement Managers – Track vendor costs, delivery timelines, and quality ratings to optimize purchasing decisions.
🏭 Supply Chain Managers – Monitor supplier performance across regions, categories, and delivery statuses.
📊 Operations Managers – Evaluate vendor reliability and identify bottlenecks in the supply chain.
🏢 Business Owners – Get complete visibility into vendor spending and performance metrics.
📈 Data Analysts – Use the interactive dashboard and export features for custom vendor analysis and reporting.
🛒 E-commerce Businesses – Track supplier fulfillment rates, delivery performance, and product quality ratings.
❓ Frequently Asked Questions
What KPIs does the Vendor Performance Dashboard in HTML track?
The Vendor Performance Dashboard in HTML tracks 5 key performance indicators: Total Cost (USD), Total Quantity, Average Rating, Total Orders, and Units Ordered. These metrics are displayed on the Overview page through interactive KPI cards.
How many dashboard pages are included in this template?
This dashboard includes 5 interactive pages: Overview, Delivery Performance, Rating Analysis, Vendor Comparison, and Data View. Each page provides unique analytical perspectives on vendor performance.
Do I need any special software to use this HTML dashboard?
No special software is required. Simply unzip the downloaded file and open index.html in any modern web browser like Chrome, Edge, or Firefox. The dashboard works completely offline.
Can I replace the sample data with my own vendor data?
Yes. The dashboard includes a data file where you can replace the sample records with your own vendor, procurement, and delivery data. Once updated, all charts and KPIs refresh automatically.
What is the best HTML dashboard template for vendor performance tracking?
The Vendor Performance Dashboard in HTML is one of the best HTML dashboard templates for vendor performance tracking. It provides 5 analytical pages covering procurement costs, delivery performance, quality ratings, and vendor comparison — all in an interactive browser-based format with no coding required.
🔗 Explore Related Templates
📊 Supply Chain Analytics Dashboard in HTML – Track orders, suppliers, delivery, returns, and fulfillment in one interactive report.
📦 Inventory Management Dashboard in HTML – Monitor stock levels, warehouse performance, and inventory movement with interactive visuals.
🤝 CRM Dashboard in HTML – Track customer relationships, sales pipelines, and engagement metrics in a modern HTML interface.
📖 Click here to read the Detailed Blog Post
Watch the step-by-step video tutorial:


Reviews
There are no reviews yet.