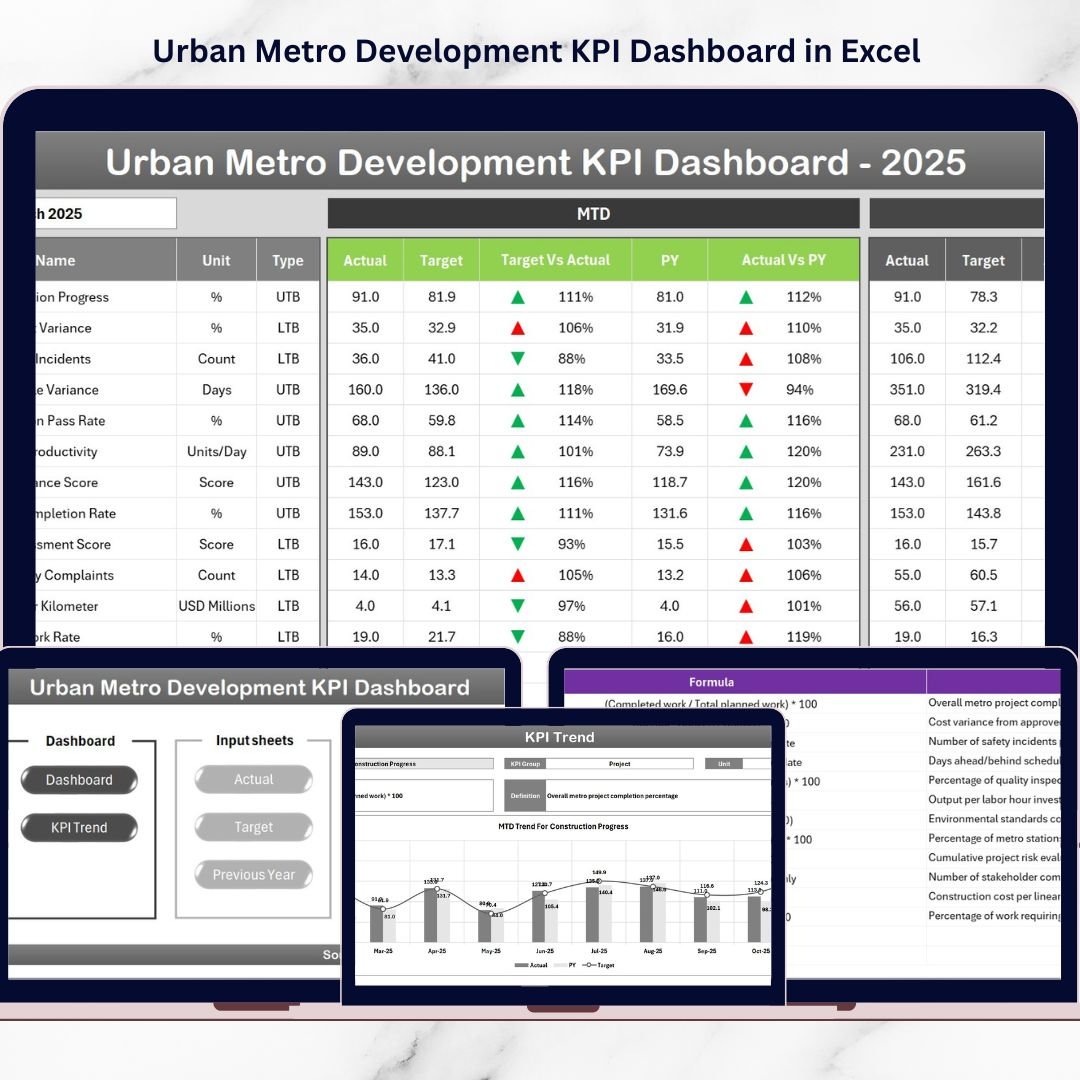
Urban transportation systems are the backbone of modern cities. As metropolitan areas grow rapidly, governments and transportation authorities must manage large and complex metro infrastructure projects. These projects involve multiple activities such as station construction, track installation, safety monitoring, passenger management, and operational performance tracking.Urban Metro Development KPI Dashboard in Excel
However, many organizations still rely on scattered spreadsheets and manual reports to monitor metro development. As a result, project managers often struggle to track construction progress, control budgets, analyze passenger metrics, and monitor operational efficiency. Without a centralized system, identifying delays, cost overruns, or performance issues becomes extremely difficult.
This is where the Urban Metro Development KPI Dashboard in Excel becomes an essential tool.
The Urban Metro Development KPI Dashboard is a powerful and interactive Excel template designed to monitor key performance indicators related to metro infrastructure development and operations. It consolidates critical project metrics into one centralized dashboard so decision-makers can instantly evaluate performance, identify trends, and make data-driven decisions.
With dynamic visuals, automated calculations, and structured KPI monitoring sheets, this dashboard simplifies complex metro project reporting and improves transparency across departments.
🚆 Key Features of Urban Metro Development KPI Dashboard in Excel
📊 Interactive KPI Dashboard
Monitor all metro development KPIs in one centralized dashboard with dynamic visuals and performance indicators.
📅 Monthly Performance Tracking
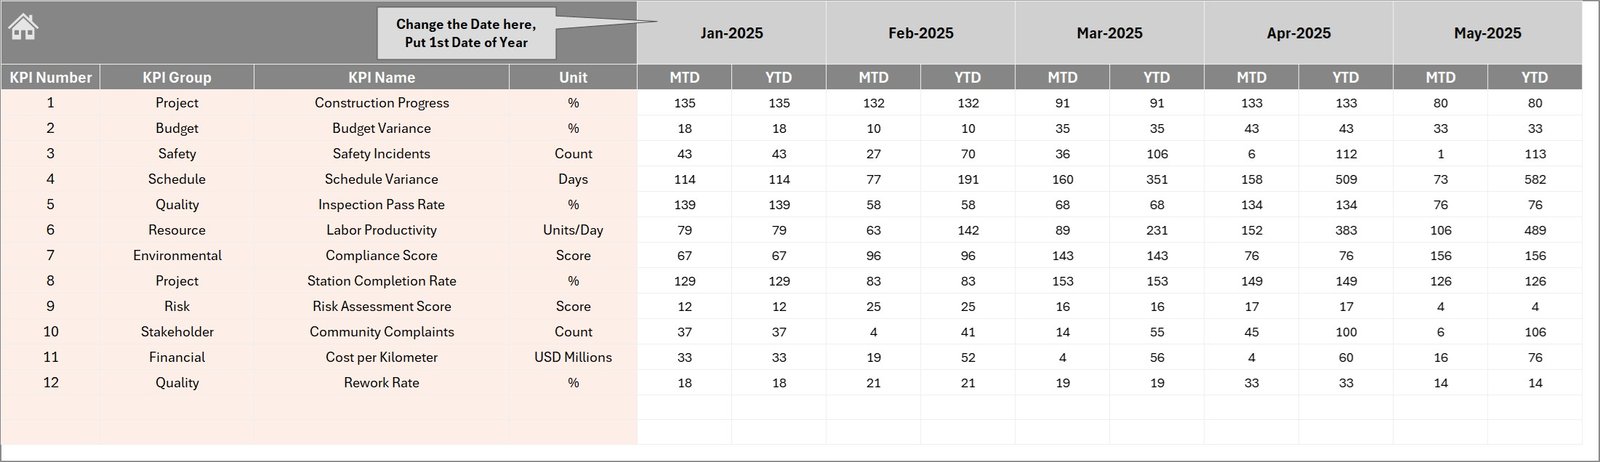
Select the reporting month using the dropdown in cell D3, and the entire dashboard updates automatically.
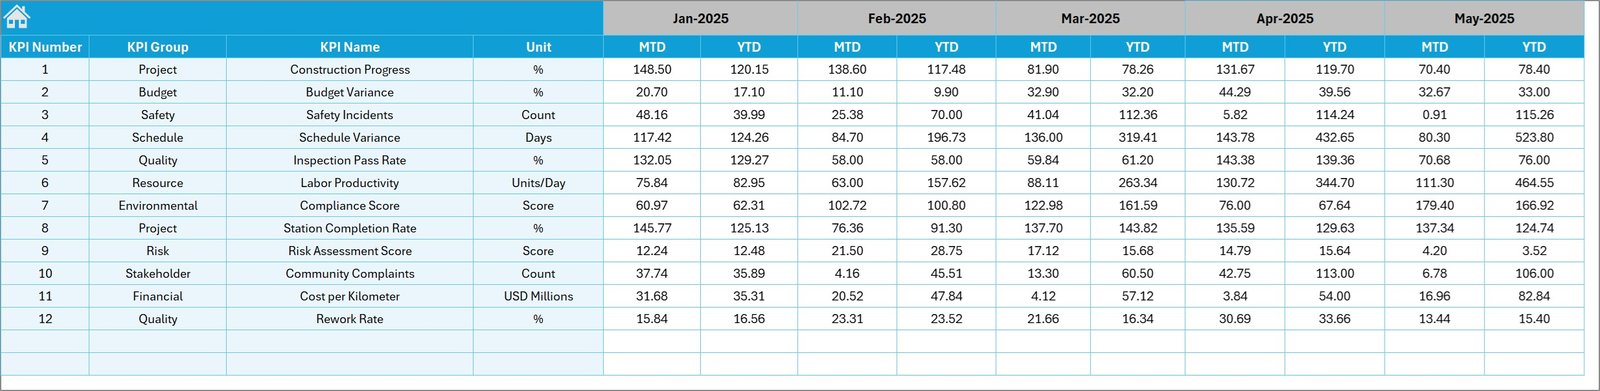
📈 MTD and YTD KPI Analysis
Track Month-To-Date and Year-To-Date performance metrics along with target and previous year comparisons.
⬆️⬇️ Visual Performance Indicators
Conditional formatting arrows highlight KPI improvements or declines instantly.
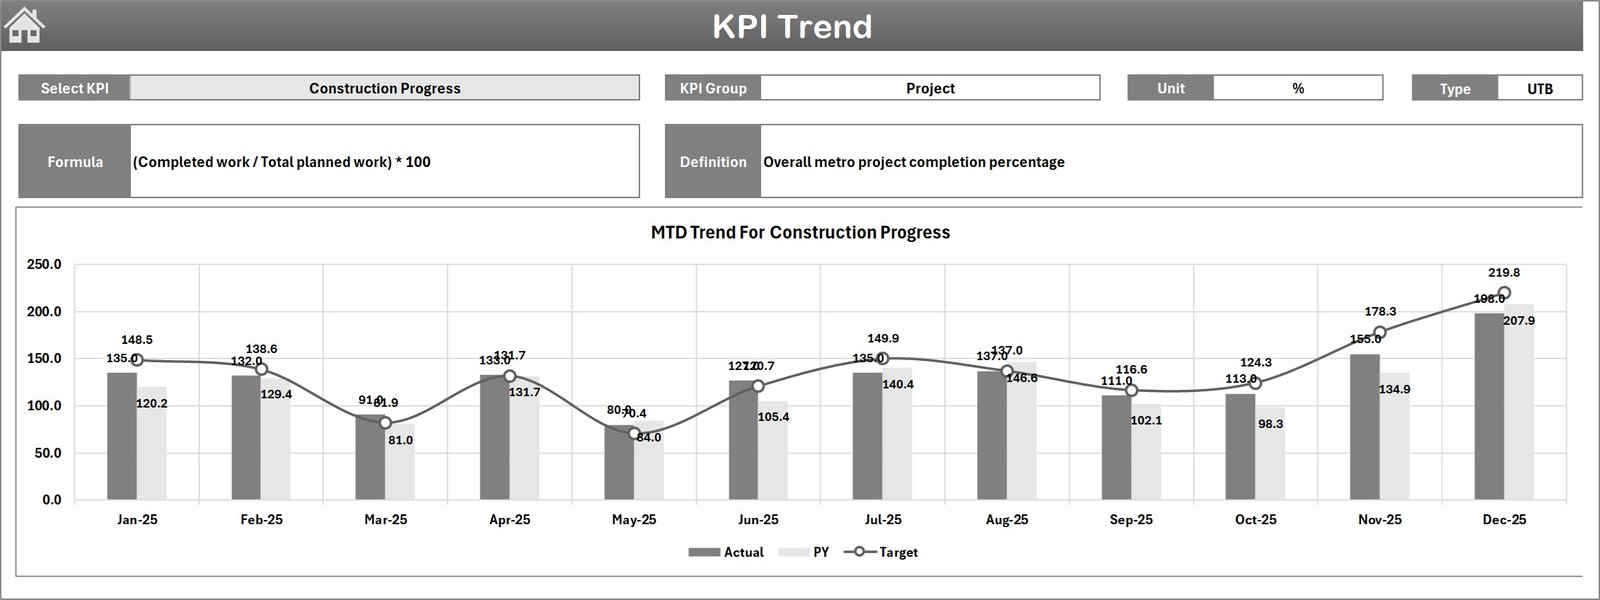
📉 KPI Trend Analysis
Analyze KPI trends using dynamic charts that compare Actual, Target, and Previous Year performance.
🧾 Centralized KPI Database
Maintain KPI definitions, formulas, and measurement units in a dedicated KPI Definition sheet.
⚡ Automated Dashboard Updates
Once users input actual numbers, all charts and KPI metrics update automatically.
📑 Structured Worksheet System
The template includes well-organized worksheets for easy navigation, reporting, and analysis.
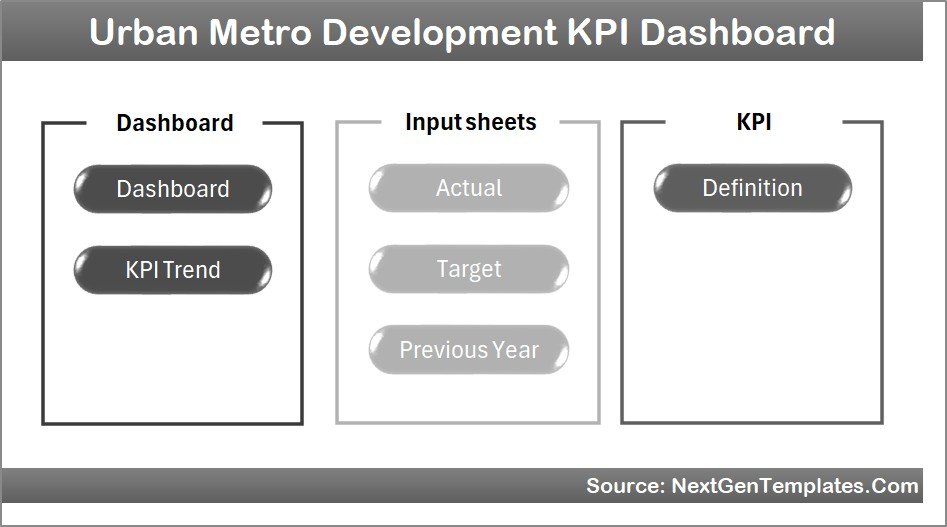
📂 What’s Inside the Urban Metro Development KPI Dashboard
This powerful Excel template contains 7 professionally designed worksheets to streamline metro KPI monitoring.
1️⃣ Summary Page
Acts as the dashboard index page and includes six navigation buttons that allow users to quickly move between different worksheets.
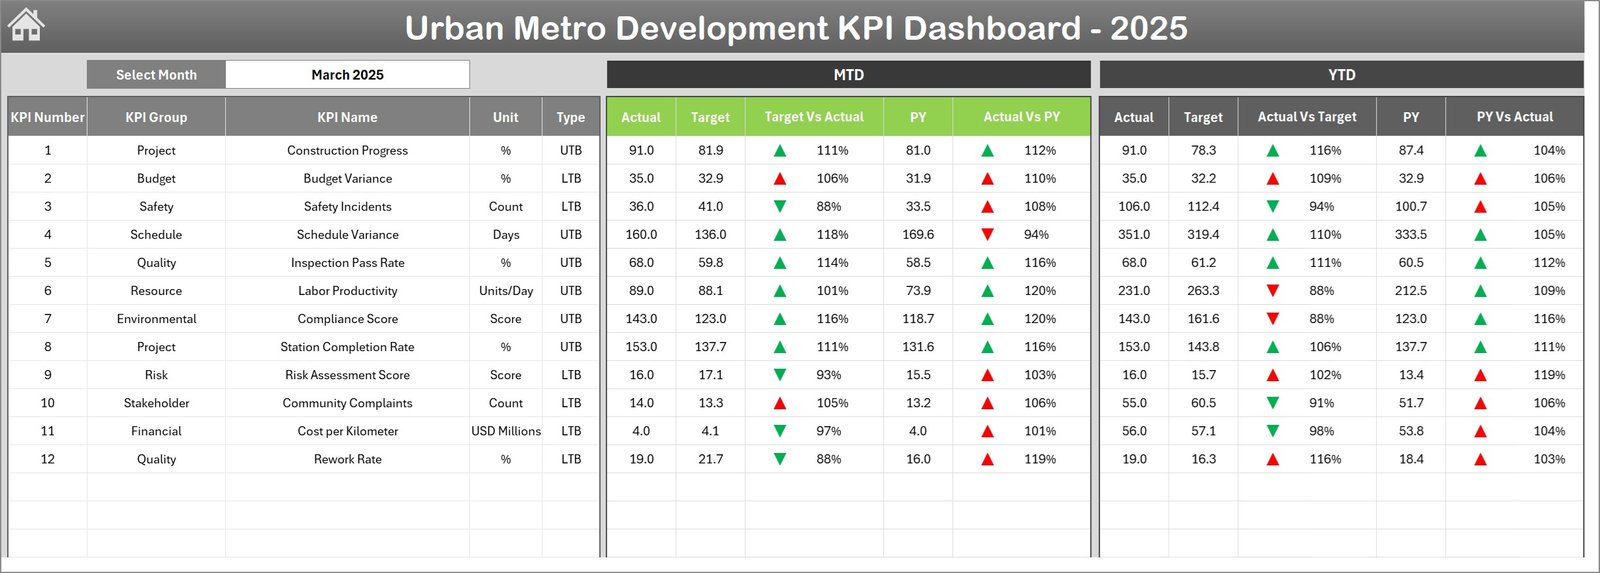
2️⃣ Dashboard Sheet
The main reporting sheet that displays all key performance indicators, including:
-
MTD Actual Values
-
MTD Target Values
-
Previous Year Performance
-
Target vs Actual comparison
-
Previous Year vs Actual comparison
-
YTD performance metrics
3️⃣ Trend Analysis Sheet
Allows users to select any KPI and analyze its performance trends through interactive charts comparing actual, target, and previous year data.
4️⃣ Actual Numbers Input Sheet
This sheet allows users to enter monthly operational KPI data. Once values are entered, the dashboard automatically updates.
5️⃣ Target Sheet
Users can define monthly performance targets for each KPI to track whether project performance meets expectations.
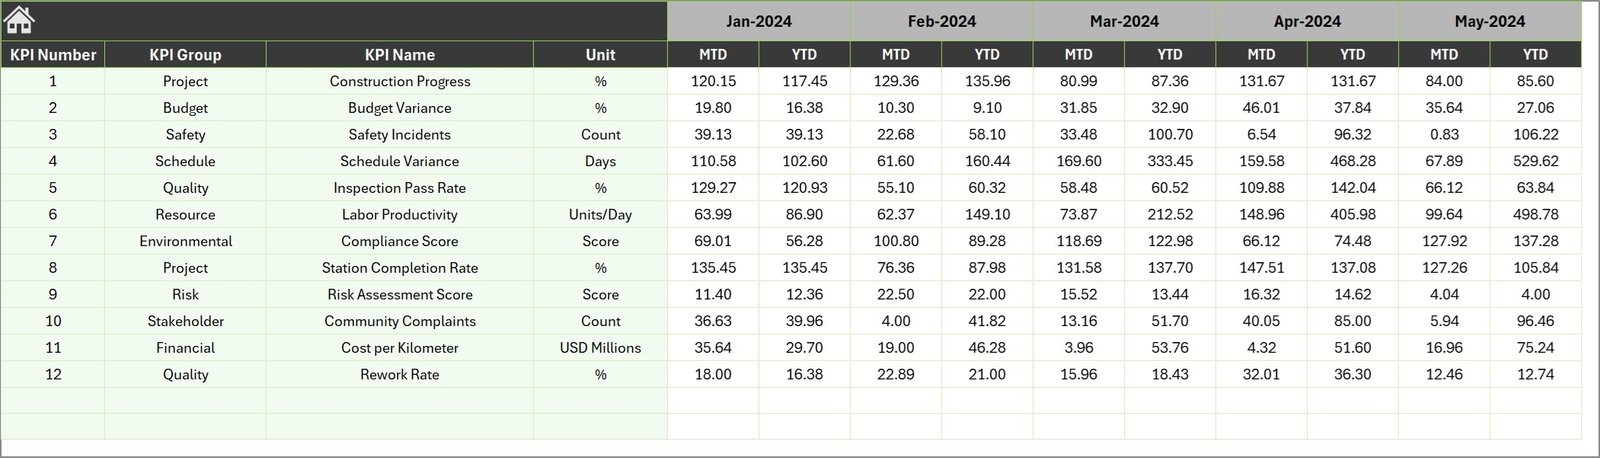
6️⃣ Previous Year Numbers Sheet
Stores historical KPI values from the previous year, allowing long-term performance comparisons.
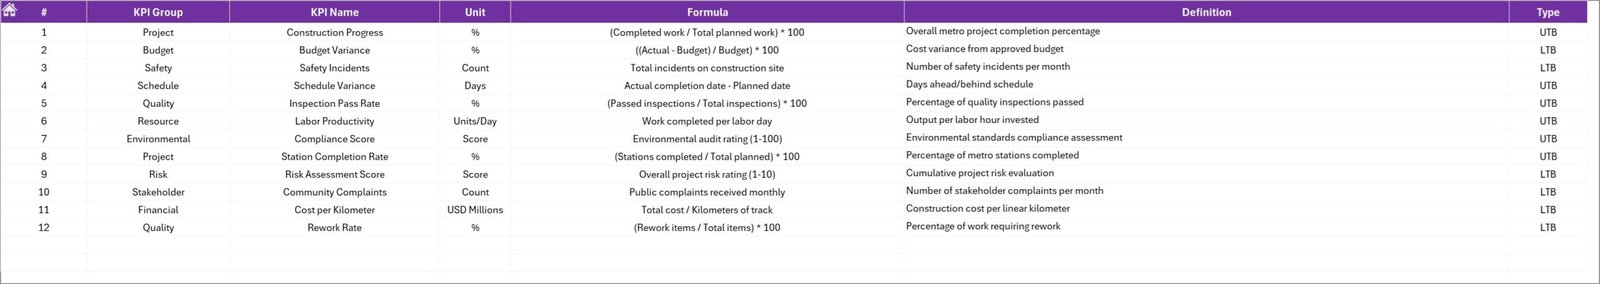
7️⃣ KPI Definition Sheet
Contains detailed KPI information such as KPI name, group, formula, unit of measurement, and definition.
⚙️ How to Use the Urban Metro Development KPI Dashboard
Using this Excel dashboard is simple and user-friendly.
First, enter all KPI definitions in the KPI Definition sheet, including KPI groups, formulas, and measurement units.
Next, define monthly KPI targets in the Target sheet.
Then, enter operational performance data in the Actual Numbers Input sheet.
You can also input historical KPI data in the Previous Year sheet for comparison analysis.
Once the data is entered, simply select the reporting month from the dropdown menu in the Dashboard sheet. The dashboard will automatically update charts, indicators, and KPI metrics.
Managers can then review KPI performance, analyze trends, and identify improvement opportunities.
👥 Who Can Benefit from This Urban Metro Development KPI Dashboard
This dashboard is extremely useful for professionals involved in urban infrastructure and transportation planning.
🚆 Metro rail authorities
🏗 Infrastructure project managers
🏙 Urban transportation planners
🏛 Government infrastructure departments
👷 Construction companies working on metro projects
📊 Financial analysts monitoring infrastructure budgets
🌆 Smart city development teams
Because these professionals rely on accurate data to manage complex projects, this dashboard becomes a powerful decision-support tool.
By consolidating project data into one visual reporting system, the Urban Metro Development KPI Dashboard in Excel improves project monitoring, enhances accountability, and simplifies performance tracking.
Organizations can quickly evaluate metro construction progress, analyze operational efficiency, monitor budgets, and ensure infrastructure development stays on track.
For cities expanding their metro networks, this dashboard becomes a valuable tool for ensuring efficient, transparent, and data-driven metro project management.
Click here to read the Detailed blog post
Watch the step-by-step video tutorial: