Managing corporate cash, loans, liquidity, and counterparty exposure requires precision. However, when treasury data sits across multiple spreadsheets, visibility disappears. Interest costs rise silently. Risk exposure increases unnoticed. Liquidity planning becomes reactive instead of strategic.
That is why we created the Treasury Management Dashboard in Excel — a structured, ready-to-use financial control system built entirely inside Microsoft Excel.
This powerful dashboard centralizes your cash inflows, outflows, balances, loan exposure, interest rates, and counterparty risk into one interactive file. As a result, treasury teams gain clarity, control, and confidence in every financial decision.
If you want smarter liquidity planning and stronger risk monitoring, this dashboard delivers exactly what you need.
🚀 Key Feature of Treasury Management Dashboard in Excel
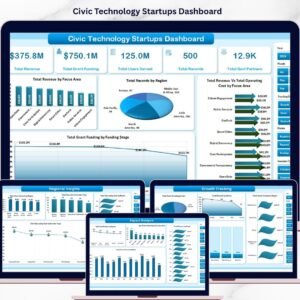
This dashboard contains 5 analytical pages, along with structured Data and Support sheets.
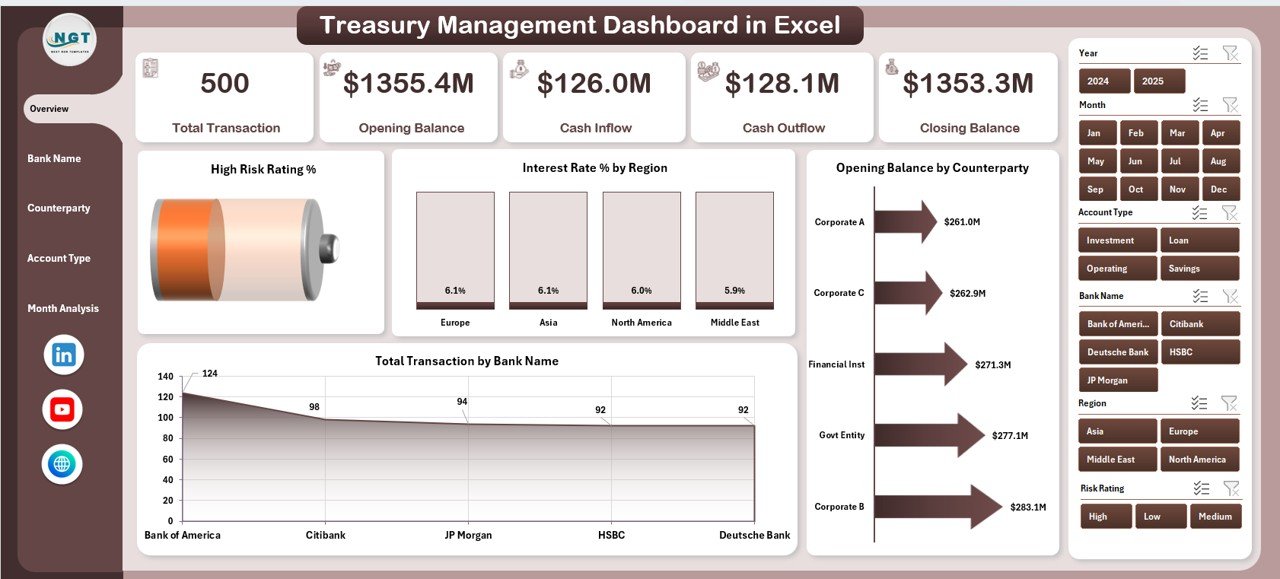
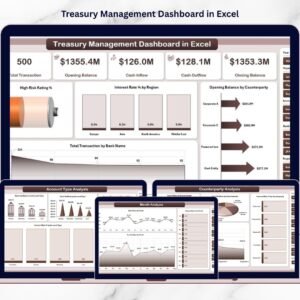
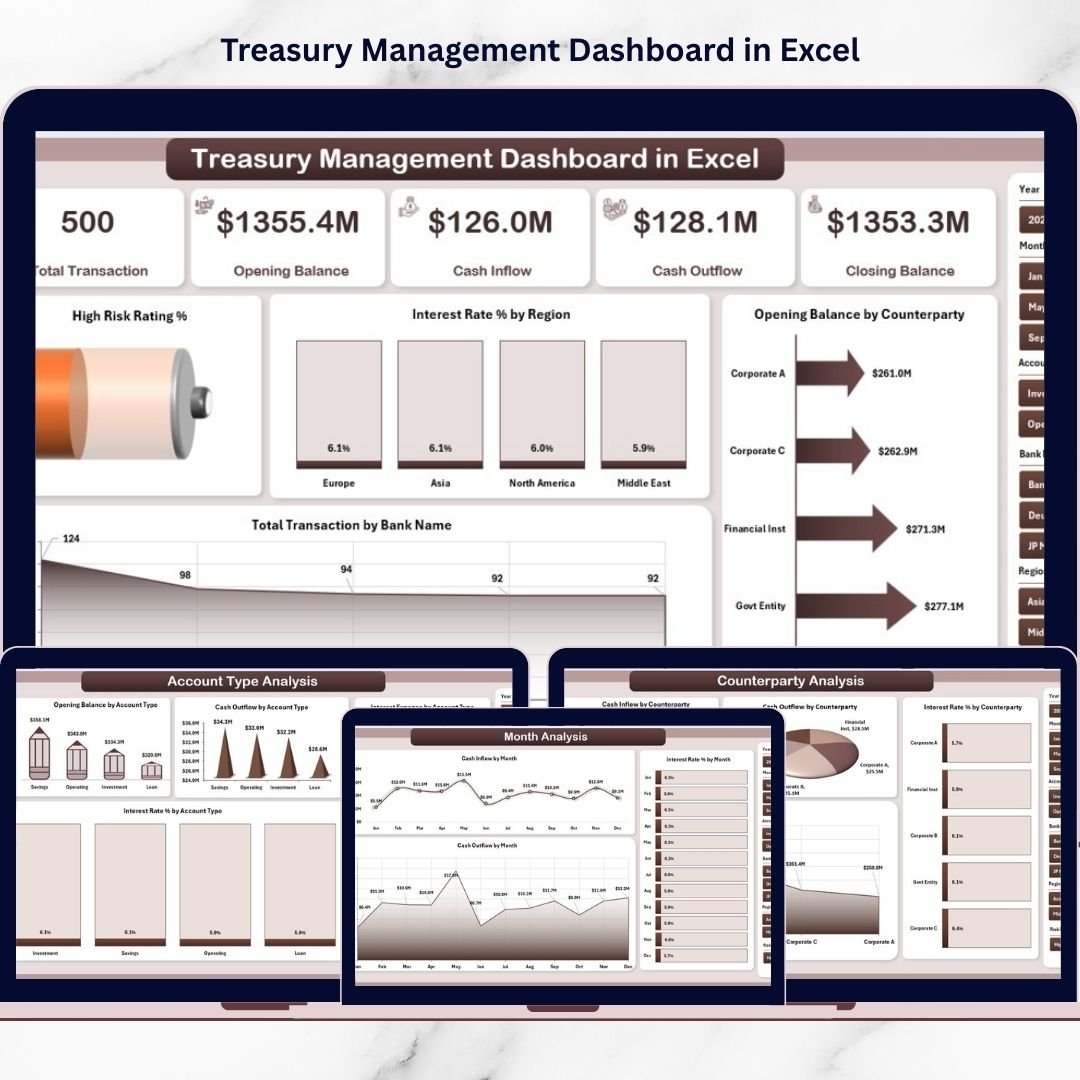
📊 Overview Page – Snapshot of liquidity, risk rating %, interest rate %, balances, and transactions.
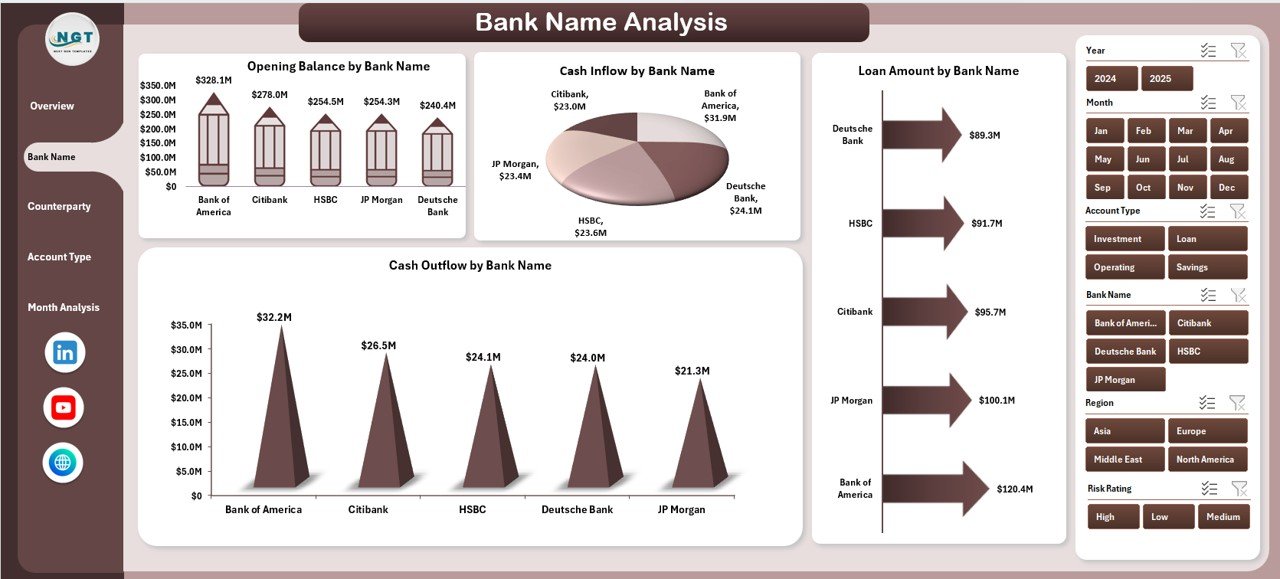
🏦 Bank Name Analysis – Monitor bank-wise balances, inflows, outflows, and loan exposure.
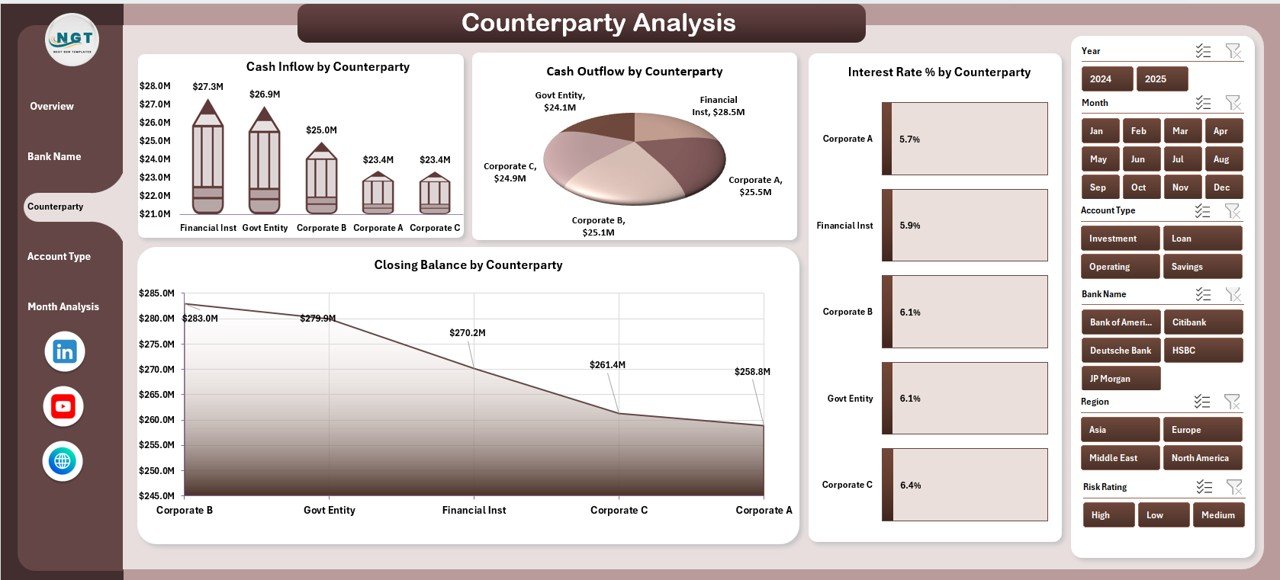
🤝 Counterparty Analysis – Track exposure concentration and interest rate comparison.
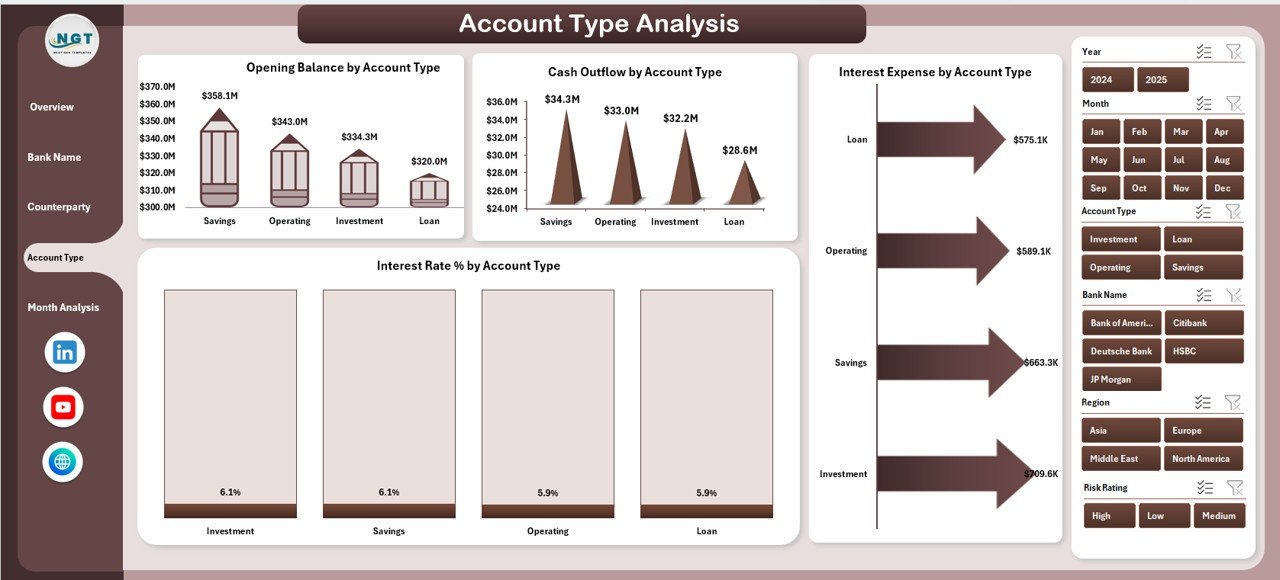
💼 Account Type Analysis – Evaluate savings, current, loan, and investment accounts.
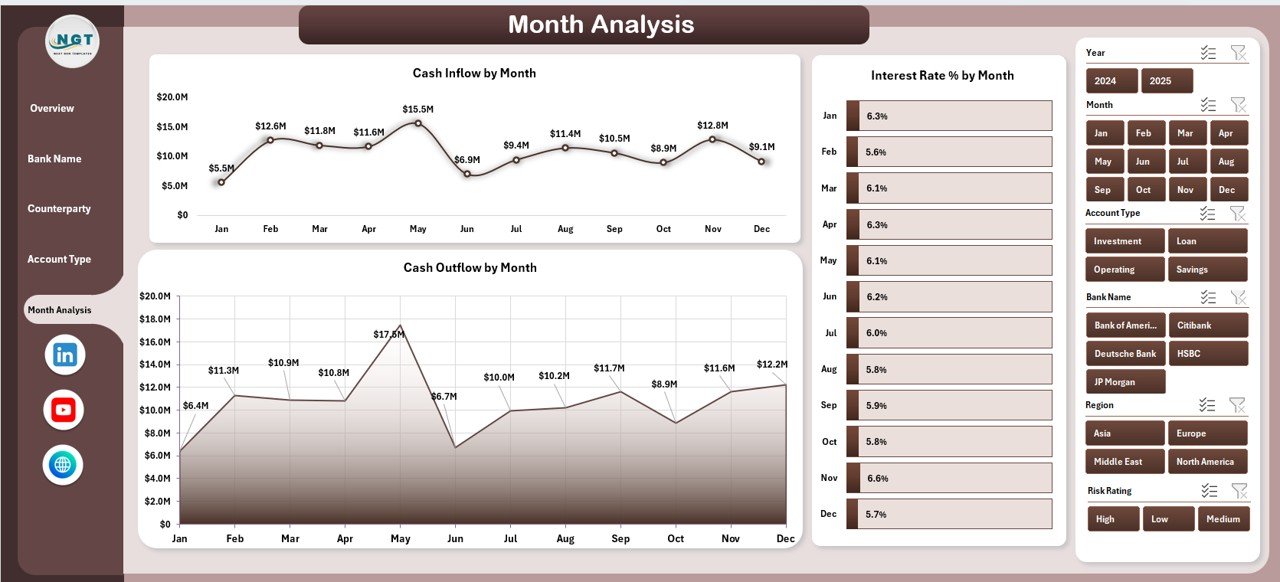
📅 Month Analysis – Analyze inflow, outflow, and interest trends over time.
✨ Additional highlights:
-
Left-side Page Navigator for smooth navigation
-
Right-side slicers for dynamic filtering
-
Pivot Tables & Pivot Charts for automated reporting
-
Structured Excel tables for clean data management
-
Fully customizable KPI framework
Because everything runs inside Excel, implementation is simple and cost-effective.
📦 What’s Inside the Treasury Management Dashboard in Excel
This ready-to-use workbook includes:
✔ 5 Interactive Analytical Pages
✔ 4 KPI Cards on Overview Page
✔ High Risk Rating % tracking
✔ Interest Rate % monitoring
✔ Opening & Closing Balance analysis
✔ Cash Inflow & Outflow tracking
✔ Loan Amount analysis
✔ Bank concentration monitoring
✔ Counterparty exposure visibility
✔ Account Type performance tracking
✔ Monthly liquidity trend analysis
✔ Structured Data Sheet for treasury transactions
✔ Support Sheet for backend calculations
You simply update treasury transactions in the Data Sheet. Then refresh PivotTables. The entire dashboard updates automatically.
🛠 How to Use the Treasury Management Dashboard in Excel
Using this dashboard is simple and structured:
1️⃣ Enter treasury transaction data into the Data Sheet (Date, Bank Name, Counterparty, Account Type, Opening Balance, Cash Inflow, Cash Outflow, Loan Amount, Interest Rate, Risk Rating).
2️⃣ Refresh PivotTables.
3️⃣ Use slicers to filter by bank, counterparty, region, or month.
4️⃣ Review the Overview page for financial snapshot.
5️⃣ Drill into Bank, Counterparty, Account Type, or Month pages for deeper analysis.
For example:
If High Risk Rating % increases, you can reduce exposure immediately.
If interest rates rise regionally, you can renegotiate borrowing.
If one bank dominates transactions, you can diversify risk.
Because insights are visual and centralized, treasury decisions become proactive instead of reactive.
👥 Who Can Benefit from This Treasury Management Dashboard in Excel
This dashboard is ideal for:
💼 CFOs
🏦 Corporate Treasury Teams
📊 Finance Managers
📈 Financial Controllers
💰 Banking Professionals
🏢 Mid-sized & Large Enterprises
Even growing companies can use it effectively because Excel remains accessible and flexible.
It improves:
✔ Liquidity visibility
✔ Counterparty risk monitoring
✔ Interest cost control
✔ Bank dependency management
✔ Working capital planning
When treasury becomes measurable, financial control becomes stronger.
💡 How This Dashboard Strengthens Financial Strategy
Treasury performance directly impacts profitability.
This dashboard helps you:
-
Detect liquidity gaps early
-
Monitor high-risk counterparties
-
Analyze interest rate exposure
-
Compare inflow vs outflow patterns
-
Plan borrowing strategically
-
Reduce financial surprises
Instead of managing spreadsheets manually, you lead with data-driven insight.
Click hare to read the Detailed blog post
Visit our YouTube channel to learn step-by-step video tutorials