
Managing transmission line construction projects requires precision, coordination, strict cost control, and continuous performance monitoring. These infrastructure projects span long distances, involve multiple contractors, and operate under tight regulatory and deadline pressures. Transmission Line Construction KPI Dashboard in Excel However, many project teams still rely on scattered spreadsheets, manual reporting, and disconnected tracking systems. As a result, managers struggle to monitor progress accurately, control budgets, and respond quickly to delays.
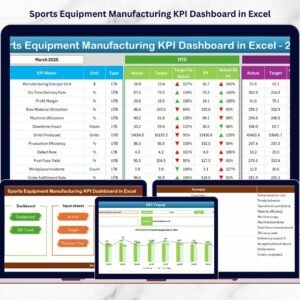
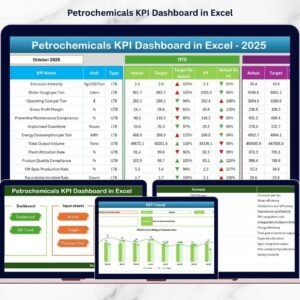
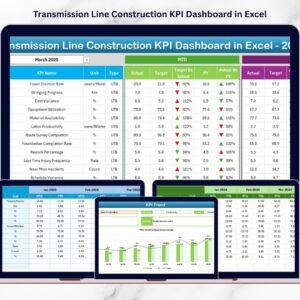
Transmission Line Construction KPI Dashboard in Excel The Transmission Line Construction KPI Dashboard in Excel provides a powerful, ready-to-use performance monitoring system designed specifically for transmission infrastructure projects. This structured Excel dashboard enables project managers, engineers, EPC contractors, and executives to track monthly progress, compare actual vs target performance, analyze year-to-date trends, and benchmark results against previous year data — all within one centralized solution.
Instead of spending hours preparing manual reports, teams simply update structured input sheets, and the dashboard automatically calculates and visualizes performance metrics. The result is improved transparency, faster decision-making, and stronger project control.
🚀 Key Features of Transmission Line Construction KPI Dashboard in Excel
📊 Interactive Monthly Dashboard – Select month (Cell D3) and update all KPIs instantly.
📈 MTD & YTD Performance Tracking – Monitor both short-term and cumulative performance.
🎯 Target vs Actual Comparison – Identify performance gaps clearly.
📅 Previous Year Benchmarking – Measure year-over-year improvement.
📉 Conditional Formatting Indicators – Up & down arrows highlight trends instantly.
📊 KPI Trend Analysis Sheet – Deep-dive performance visualization.
🧾 Structured Data Entry Sheets – Organized Actual, Target & PY inputs.
📘 KPI Definition Documentation – Clear formula and logic reference.
⚡ Fully Automated Calculations – No manual KPI computation required.
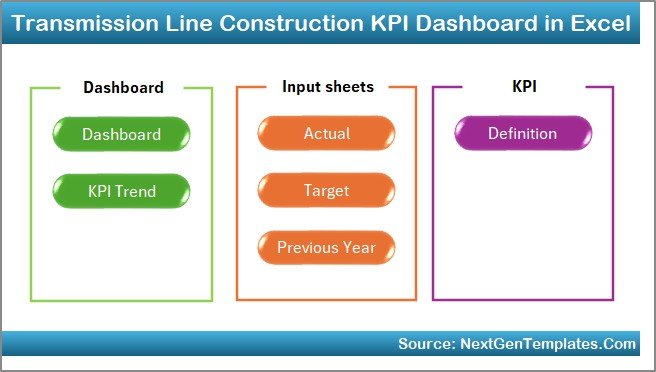
📦 Dashboard Structure – 7 Organized Worksheets
This dashboard includes seven structured worksheets designed for complete performance monitoring
1️⃣ Home Sheet – Navigation Control Center
-
6 navigation buttons
-
Clean layout
-
Quick access to major sheets
Improves usability and workflow efficiency.
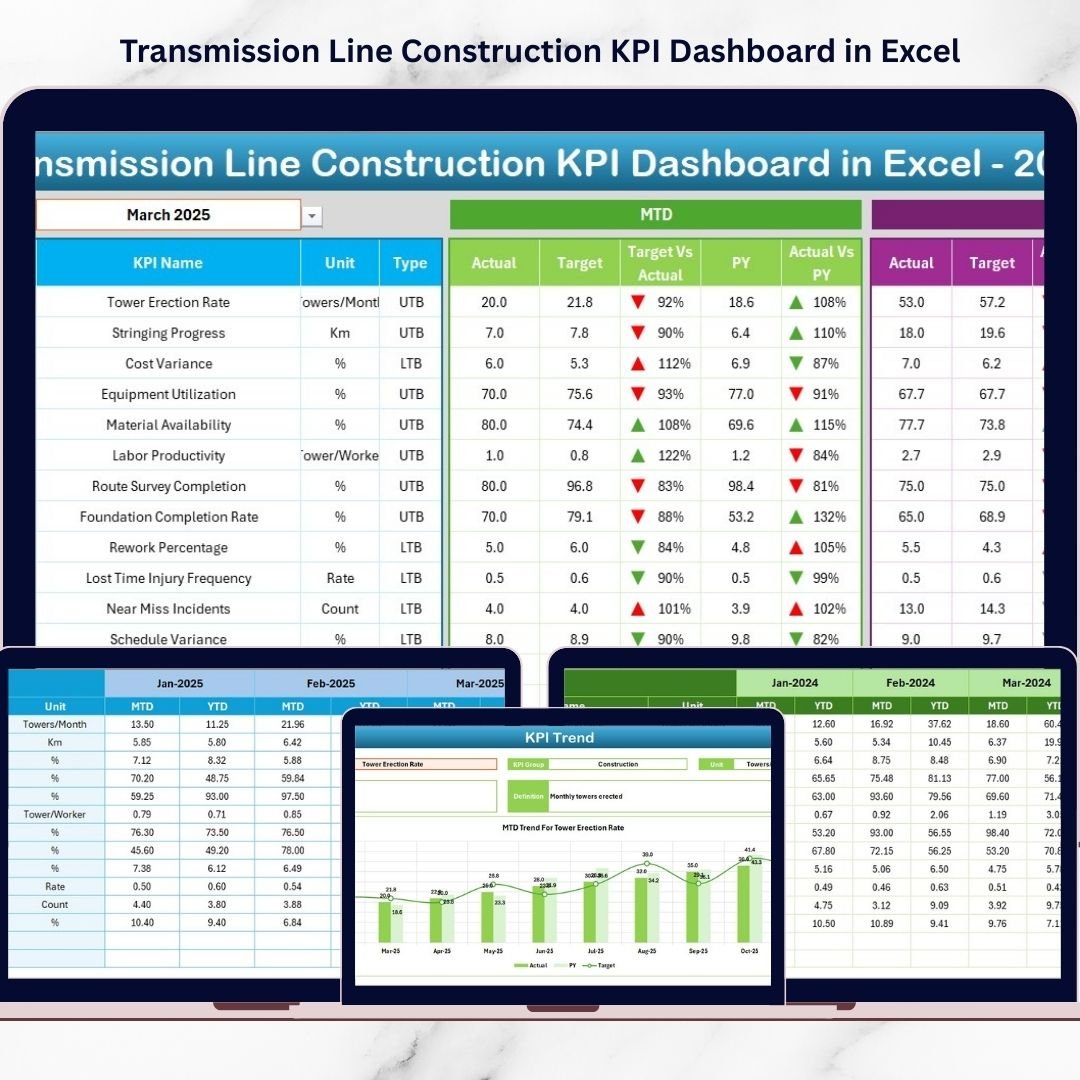
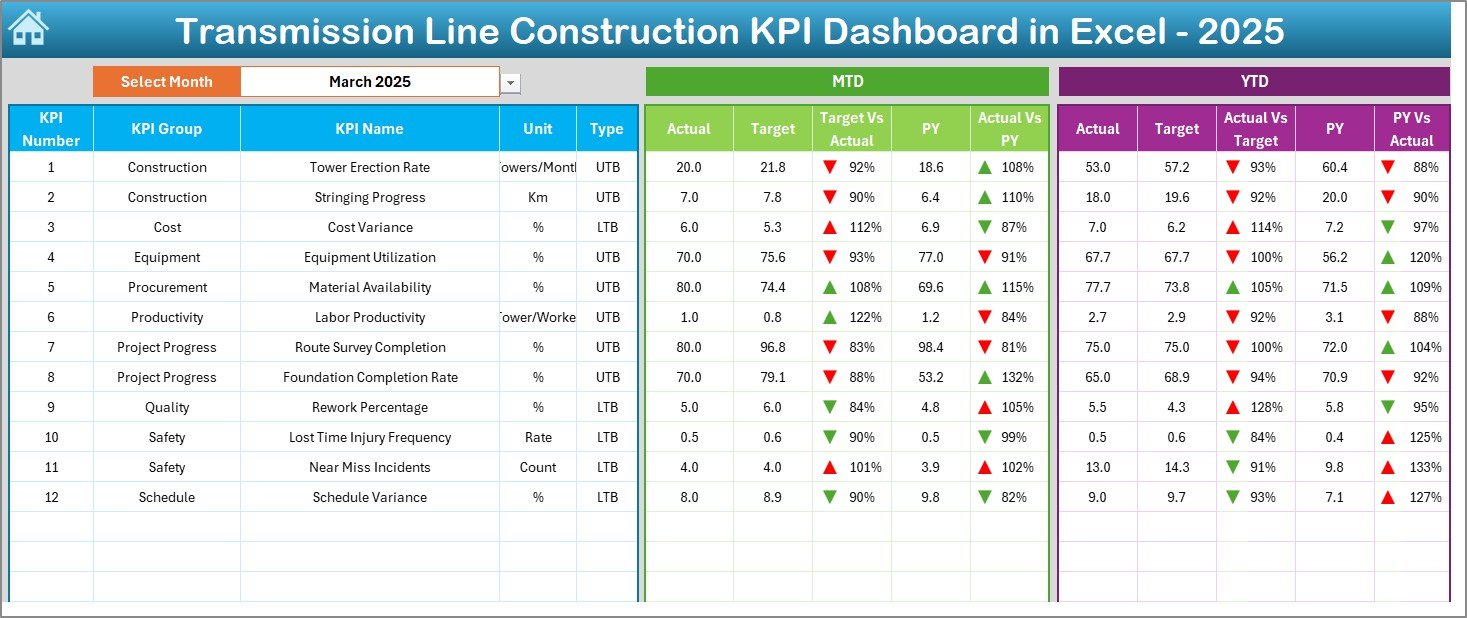
2️⃣ Dashboard Sheet – Main Performance View
Core reporting page.
Select month in Cell D3 → Entire dashboard updates automatically.
Displays:
📊 MTD Performance
-
Actual
-
Target
-
Previous Year
-
Target vs Actual
-
PY vs Actual
📈 YTD Performance
-
Actual
-
Target
-
Previous Year
-
Target vs Actual
-
PY vs Actual
Visual arrow indicators instantly show performance direction.
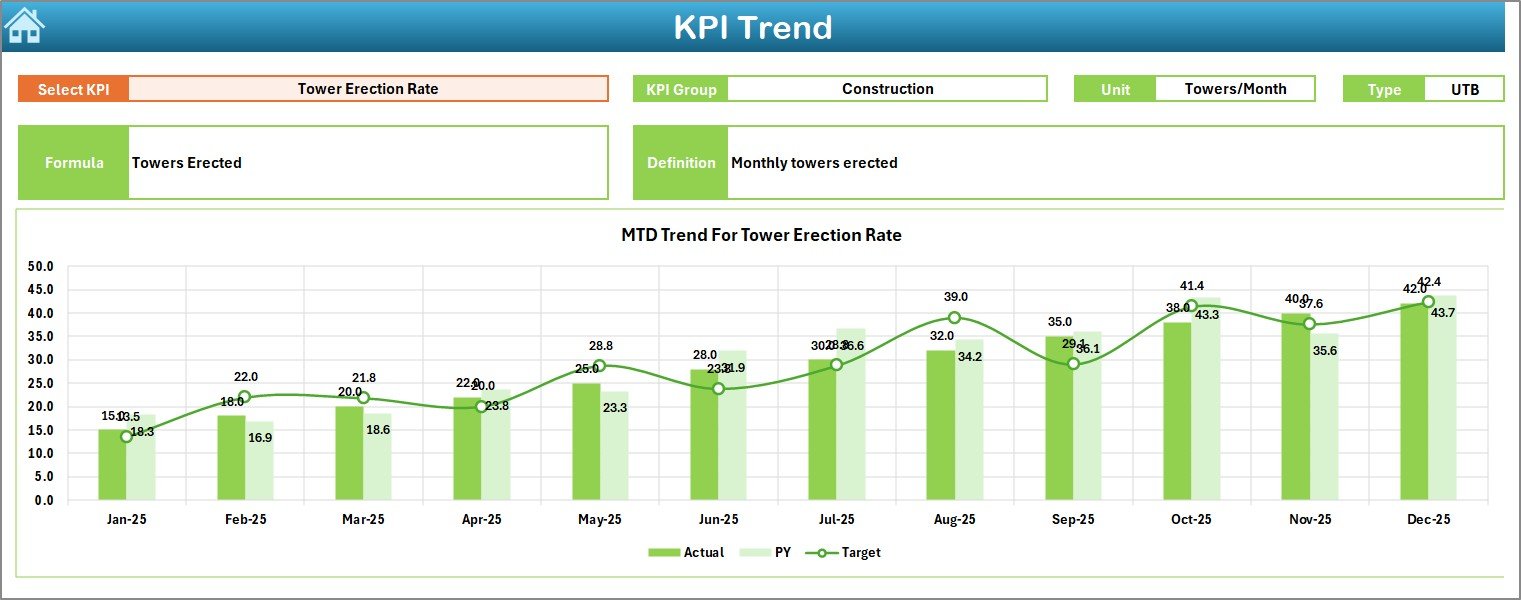
3️⃣ KPI Trend Sheet – Deep Performance Analysis
Select KPI in Cell C3 to view:
-
KPI Group
-
Unit
-
Type (LTB / UTB)
-
Formula
-
Definition
-
MTD Trend Chart
-
YTD Trend Chart
Perfect for analyzing:
-
Tower erection progress
-
Stringing completion
-
Safety frequency rate
-
Cost per km
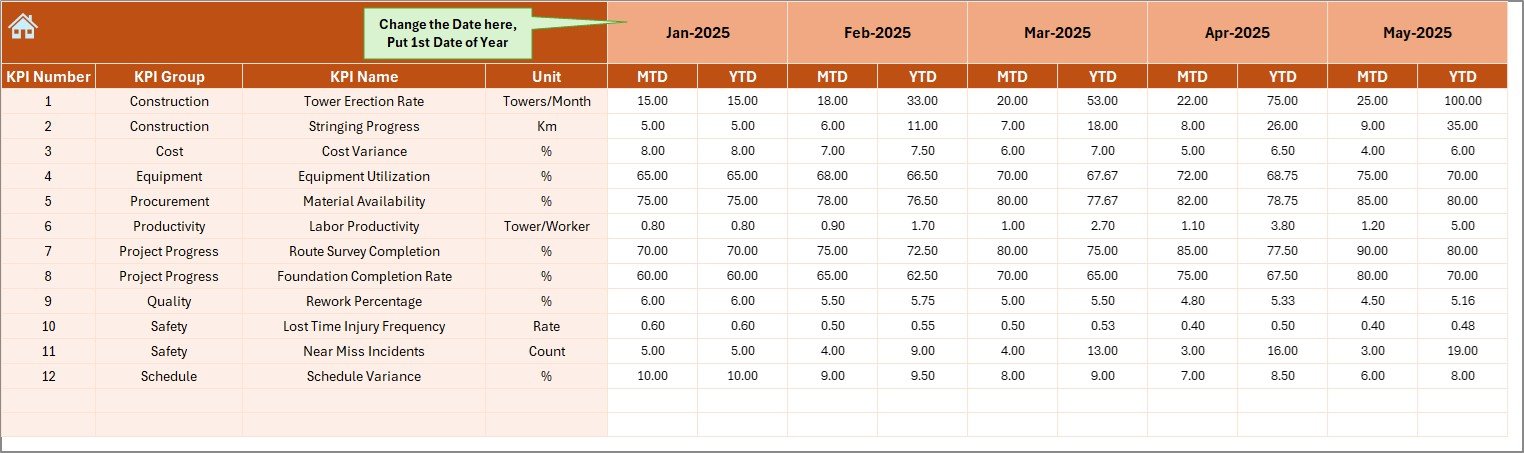
4️⃣ Actual Numbers Input Sheet
Structured data entry for current year performance.
-
Select starting month (Cell E1)
-
Enter MTD & YTD values
-
Dashboard updates automatically
Reduces reporting errors and improves consistency.
5️⃣ Target Sheet
Stores monthly planned targets:
-
MTD targets
-
YTD targets
Enables accurate performance benchmarking.
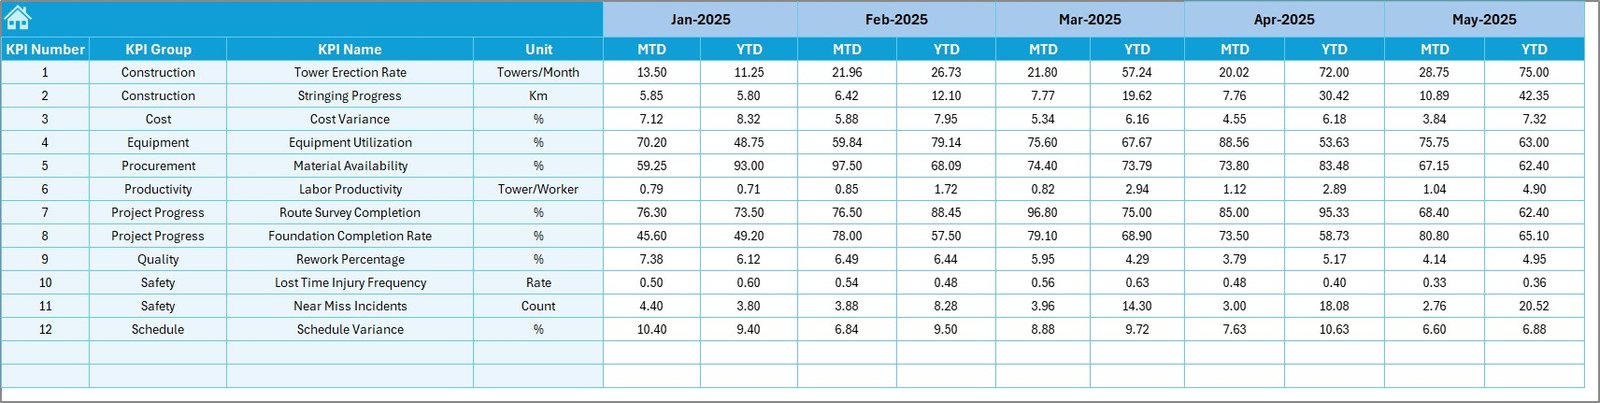
6️⃣ Previous Year Number Sheet
Used for historical comparison.
-
Enter last year data
-
Automatically compare year-over-year performance
Supports long-term improvement analysis.
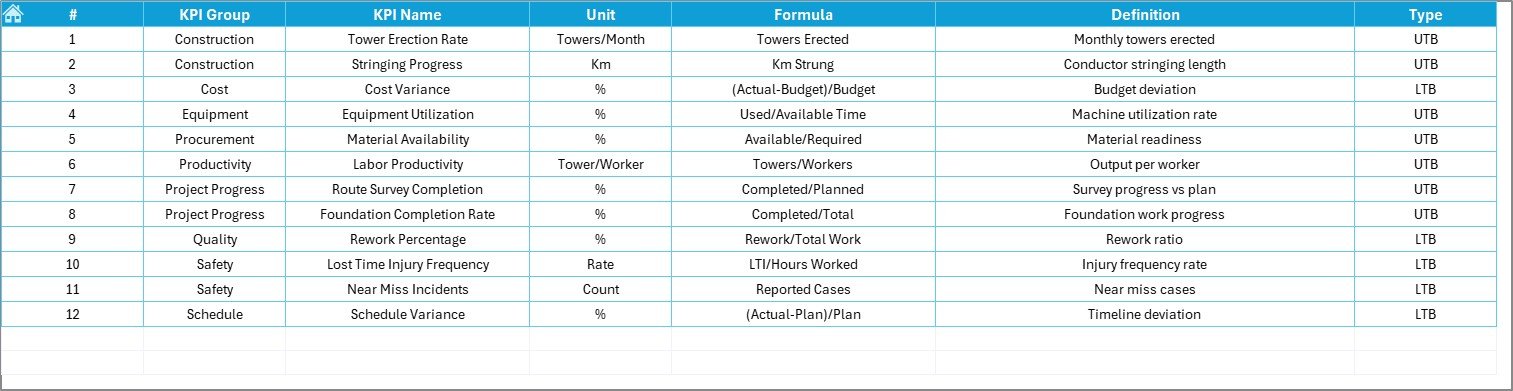
7️⃣ KPI Definition Sheet
Central KPI documentation sheet:
-
KPI Name
-
KPI Group
-
Unit
-
Formula
-
Definition
-
LTB or UTB classification
Ensures transparency and reporting clarity.
📊 Example KPIs You Can Track
🏗 Progress KPIs
-
Towers Installed
-
Foundation Completion %
-
Conductor Stringing Rate
-
ROW Clearance Rate
💰 Financial KPIs
-
Cost per Kilometer
-
Budget Variance %
-
Material Utilization Rate
⚡ Productivity KPIs
-
Crew Productivity
-
Equipment Utilization %
-
Average Installation Time
🦺 Safety KPIs
-
LTIFR
-
Near Miss Reports
-
Safety Compliance %
⭐ Advantages of Transmission Line Construction KPI Dashboard
✅ Centralized Project Monitoring
All KPIs available in one structured dashboard.
✅ Improved Decision-Making
Instant performance visibility enables quick corrective action.
✅ Better Budget Control
Track cost variance and material utilization efficiently.
✅ Enhanced Transparency
Standardized KPIs improve accountability.
✅ Reduced Reporting Time
Automatic calculations eliminate manual reports.
✅ Historical Benchmarking
Compare year-over-year performance easily.
✅ Scalable for Multiple Projects
Duplicate file for separate project tracking.
🔧 Best Practices for Maximum Results
✔ Update actual data monthly without delay
✔ Assign clear KPI ownership
✔ Keep KPI formulas simple and clear
✔ Review trends consistently (not just year-end)
✔ Focus only on actionable KPIs
✔ Use historical benchmarking for strategic planning
✔ Monitor safety KPIs closely
👥 Who Can Use This Dashboard?
-
Transmission Project Managers
-
EPC Contractors
-
Utility Companies
-
Infrastructure Developers
-
Construction Controllers
-
Site Engineers
-
Senior Management
💡 Why Choose Excel for Transmission KPI Tracking?
-
No expensive software required
-
Easy customization
-
Familiar interface
-
Strong calculation capability
-
Quick implementation
Excel provides flexibility and powerful automation for structured KPI monitoring.
### Click here to read the Detailed blog post
🎥 Visit our YouTube channel to learn step-by-step video tutorials
👉 https://youtube.com/@PKAnExcelExpert