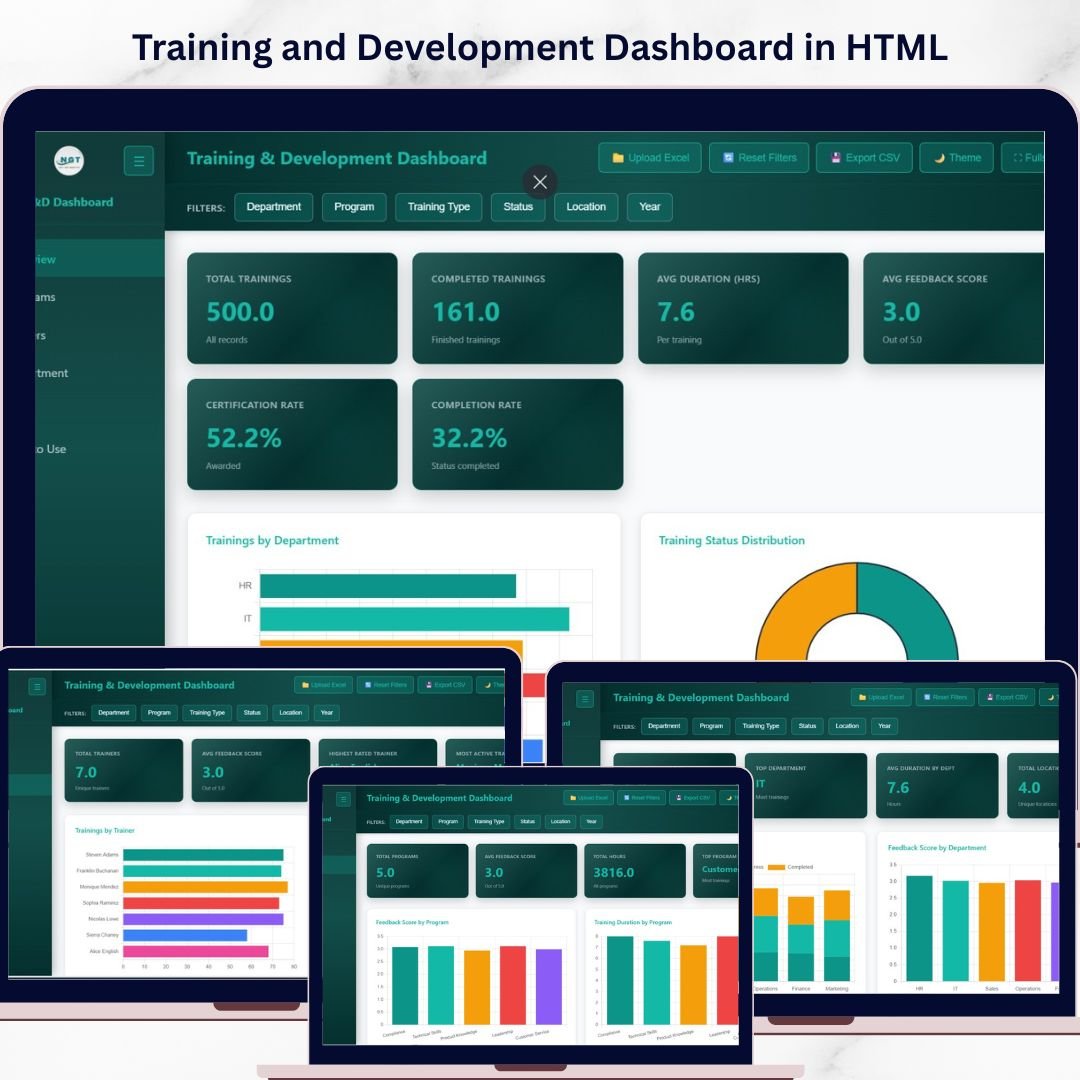


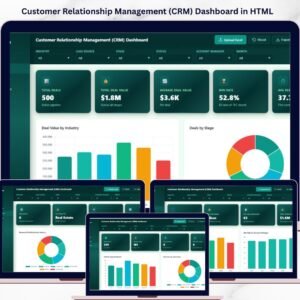
Training and Development Dashboard in HTML is a browser-based, interactive analytics template built for HR professionals, L&D managers, and training coordinators who need instant visibility into training programs, trainer performance, departmental effectiveness, and certification outcomes. This ready-to-use HTML Dashboard includes 5 dedicated pages covering an overview with KPI cards, program analysis, trainer performance, department and location analysis, and a detailed data view — giving you a complete 360-degree picture of your organization’s training landscape.Training and Development Dashboard in HTML
Whether you manage corporate training programs, onboarding sessions, compliance certifications, or professional development initiatives, this template lets you analyze completion rates, feedback scores, training duration, and program distribution — all from a single dashboard that opens in any modern web browser. Explore more HR & Payroll Templates from our growing collection.
🔑 Key Features of Training and Development Dashboard in HTML
📊 5 Interactive Dashboard Pages — Overview, Program Analysis, Trainer Performance, Department & Location Analysis, and Data View provide complete coverage of your training programs across all dimensions.
📈 6 High-Level KPI Cards — Total Trainings, Completed Trainings, Avg Duration (Hrs), Avg Feedback Score, Certification Rate, and Completion Rate displayed prominently on the overview page for instant status checks.
🔍 15+ Dynamic Charts & Visualizations — Including Trainings by Department, Training Status Distribution, Training Program Distribution, Trainings by Location, Monthly Training Trend, and more across all 5 pages.
🎛️ Multiple Slicer Filters — Apply quick filters across the dashboard to drill down into specific departments, training programs, trainers, locations, or time periods for targeted analysis.
📋 Full Data View with Search & Export — Browse all training records with search, sort, pagination, and CSV export functionality for audits and detailed reporting.
🌐 Works in Any Modern Browser — No software installation required — simply unzip and open index.html in Chrome, Edge, Firefox, or Safari.
🔄 Easy Data Replacement — Swap the sample dataset with your own training records and the entire dashboard updates automatically with your organization’s data.
📱 Responsive & Professional Design — Clean, modern interface with intuitive tab navigation between all 5 dashboard pages.
If you are looking for similar tools, check out the Employee Turnover Dashboard in HTML or the Workforce Engagement Dashboard in Google Sheets for cross-platform HR analytics.
📦 What’s Inside the Training and Development Dashboard
This template includes 5 fully interactive dashboard pages designed to give you complete control over your training analytics:
1️⃣ Overview Page: The main landing page displays 6 KPI cards — Total Trainings, Completed Trainings, Avg Duration (Hrs), Avg Feedback Score, Certification Rate, and Completion Rate. Below the cards, you’ll find powerful charts showing Trainings by Department comparing how training sessions are distributed across organizational units, Training Status Distribution displaying the proportion of completed, in-progress, and pending trainings, Training Program Distribution breaking down sessions across different training programs, Trainings by Location highlighting which work locations have the highest training activity, and Monthly Training Trend tracking how training volumes change over time. Multiple slicers let you filter the entire page instantly.
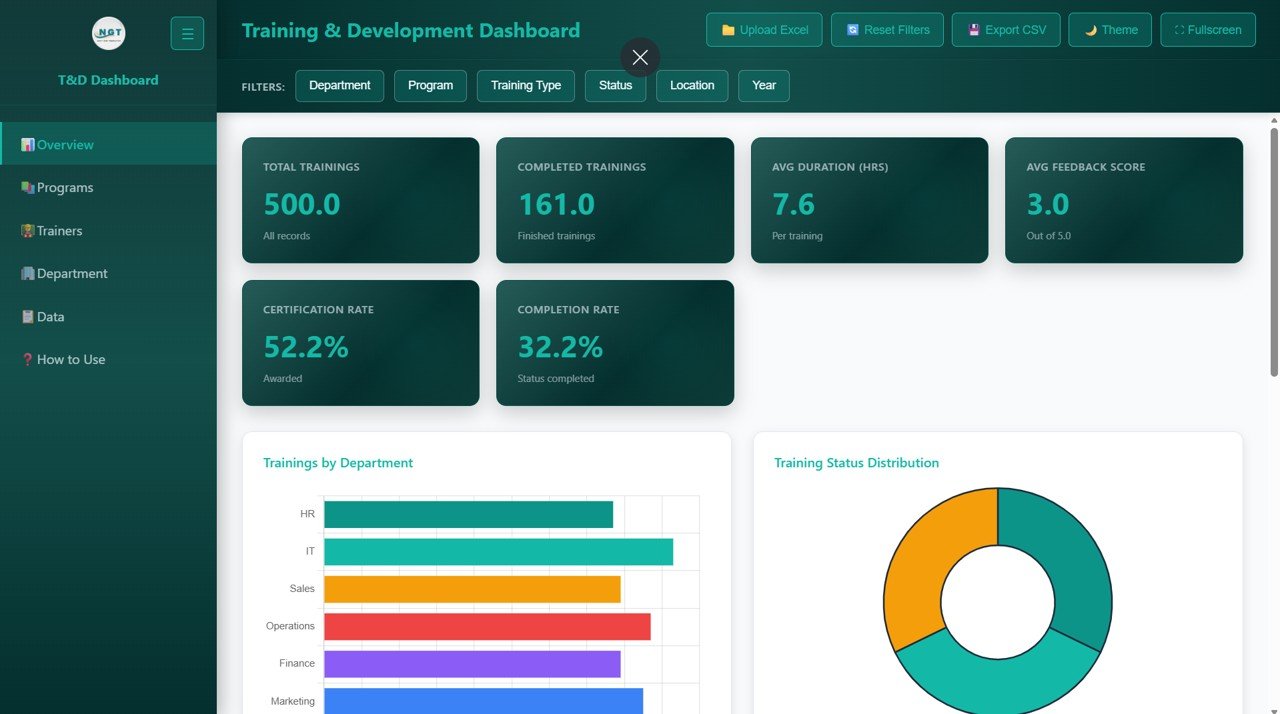
Training and Development Dashboard – Overview
2️⃣ Program Analysis: Deep-dive into program-level metrics with charts showing Feedback Score by Training Program revealing which programs earn the highest learner satisfaction, Training Duration by Program comparing time investment across different programs, Completion Rate by Program identifying which programs achieve the best completion outcomes, Training Type by Program analyzing the mix of training types within each program, and Certifications by Program tracking certification achievements across all programs.
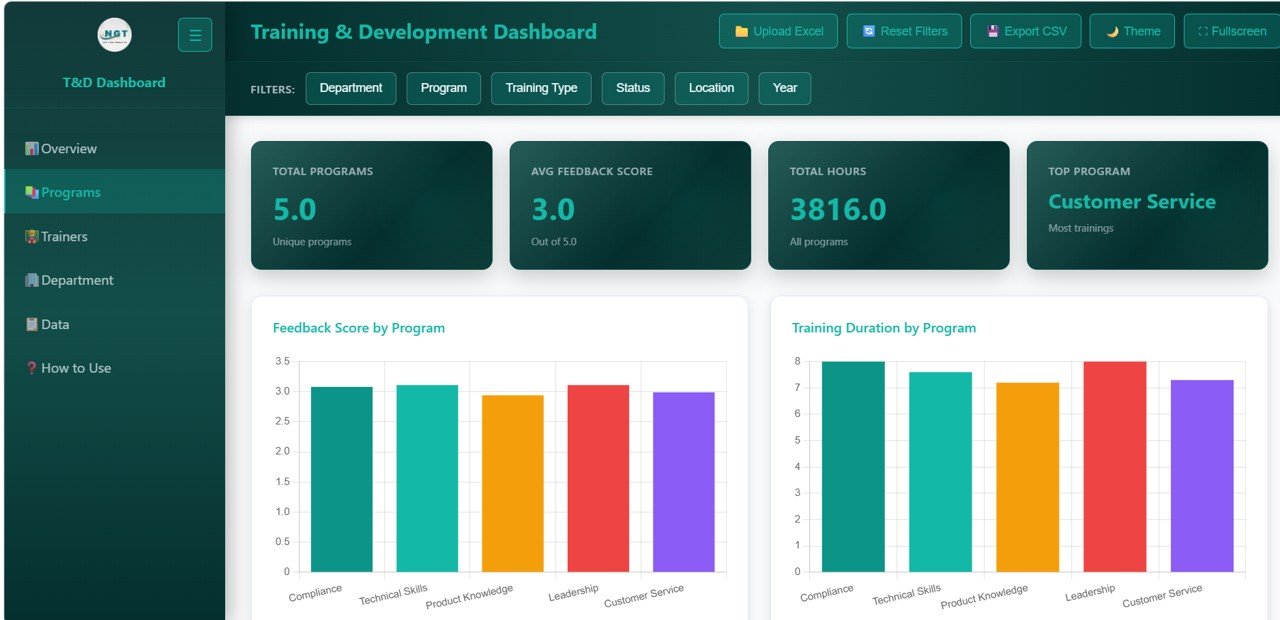
Program Analysis
3️⃣ Trainer Performance: Evaluate your trainers with detailed visualizations for Trainings by Trainer showing workload distribution, Avg Feedback Score by Trainer identifying your best-rated trainers, Completion Rate by Trainer measuring which trainers achieve the highest completion, Training Hours by Trainer comparing time commitment across the training team, and Certification Rate by Trainer tracking which trainers drive the most certifications.
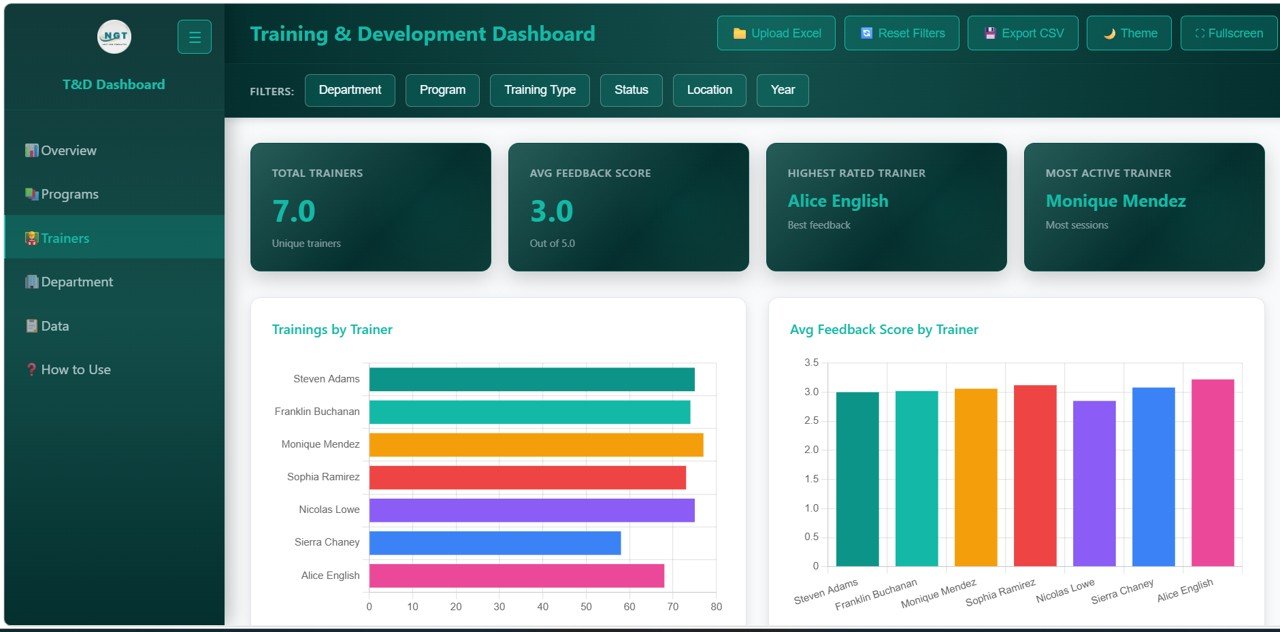
Trainer Performance
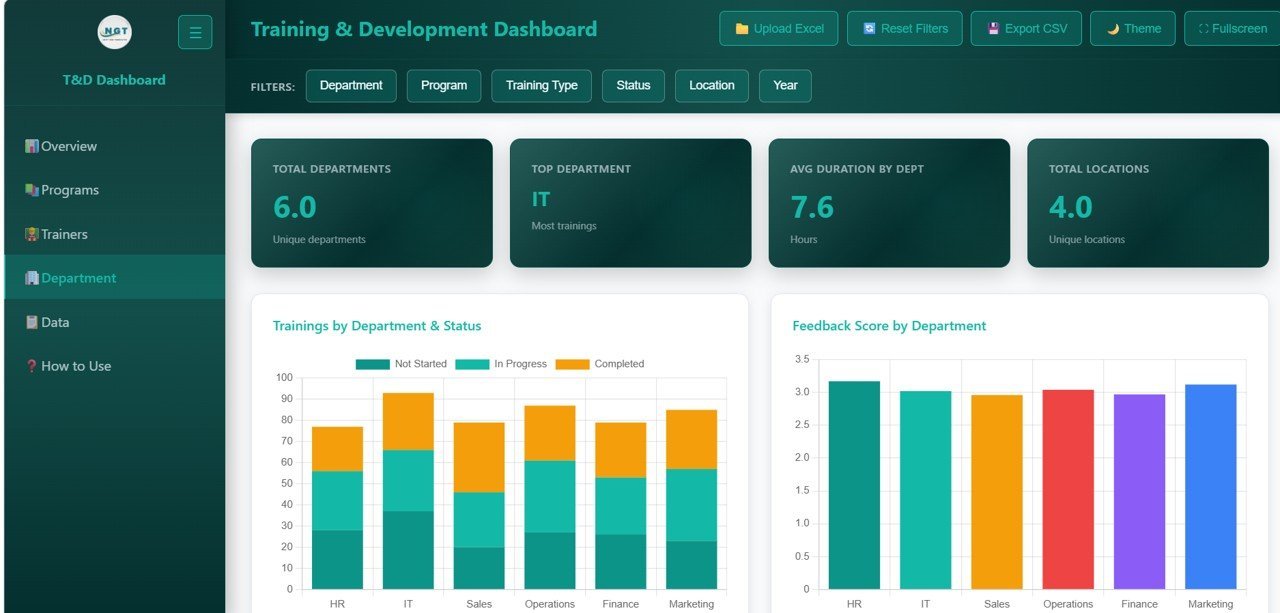
4️⃣ Department and Location Analysis: Compare organizational units with charts covering Trainings by Department and Status showing training status breakdown per department, Feedback Score by Department identifying which departments report the highest satisfaction, Training Type by Department analyzing what types of training each department receives, Trainings by Location and Status comparing location-level training completion, and Avg Duration by Job Title revealing how training duration varies across different roles.

Department and Location Analysis
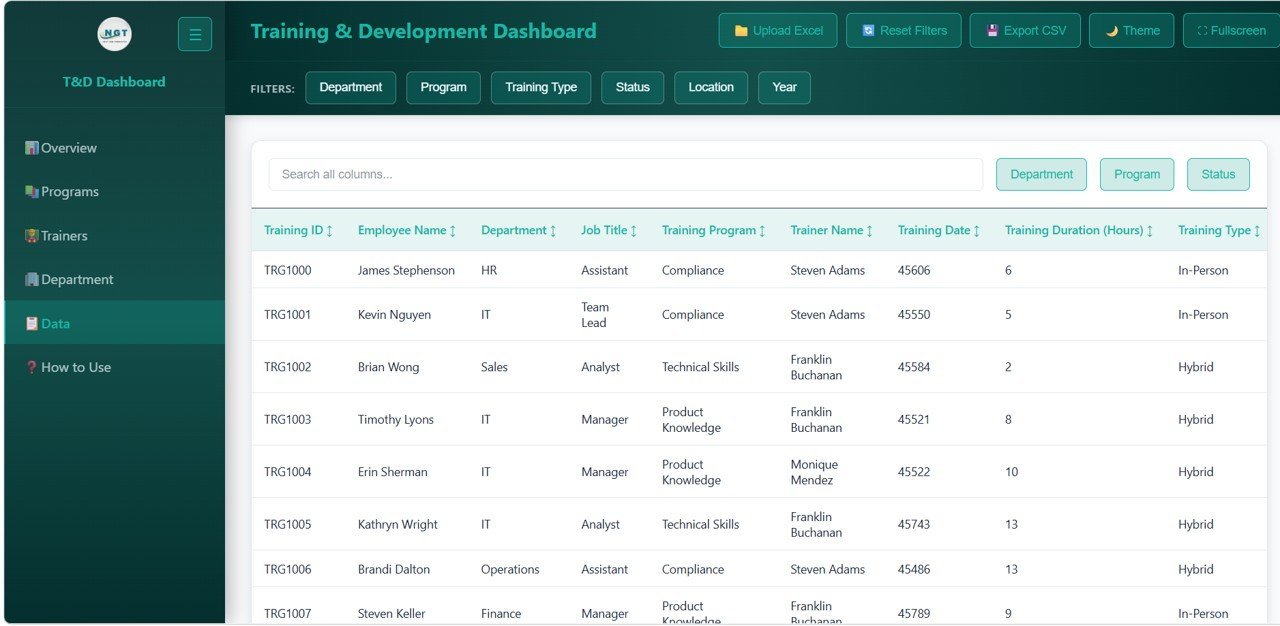
5️⃣ Data View: A detailed data table page where you can browse all training records with search, sort, and pagination features. Quickly find specific trainings or export filtered data to CSV for further analysis in Excel or other tools. This page is ideal for audits, compliance reporting, and detailed record review.

Data View
⚙️ How to Use the Training and Development Dashboard
1️⃣ Download and unzip the file to your computer
2️⃣ Open the index.html file in any modern browser (Chrome, Edge, Firefox, Safari)
3️⃣ Explore the 5 dashboard pages using the navigation tabs at the top
4️⃣ Use the slicer filters to drill down into specific training programs, departments, or trainers
5️⃣ Replace the sample data in the data file with your own training records
6️⃣ All charts, KPI cards, and tables update automatically based on your data
7️⃣ Use the Data View page to search, sort, and export records to CSV
👥 Who Can Benefit from This Training and Development Dashboard
👨💼 HR Managers & Directors — Monitor training completion, feedback scores, and certification outcomes across the organization
👩🏫 L&D Managers — Track program effectiveness, trainer performance, and identify areas for improvement
📊 Training Coordinators — Analyze program participation, duration, and status across departments and locations
🏢 Department Heads — Review training allocation, completion rates, and feedback specific to their teams
🎓 Compliance Officers — Ensure certification targets are met and all mandatory training is completed on time
❓ Frequently Asked Questions
What KPIs does the Training and Development Dashboard in HTML track?
The Training and Development Dashboard in HTML tracks 6 key performance indicators on the overview page: Total Trainings, Completed Trainings, Avg Duration (Hrs), Avg Feedback Score, Certification Rate, and Completion Rate. Additionally, it provides 15+ analytical charts across program analysis, trainer performance, department and location analysis, and a full data view.
Do I need any special software to use this HTML dashboard?
No. Simply unzip the downloaded file and open index.html in any modern web browser like Chrome, Firefox, Edge, or Safari. No Excel, Power BI, or additional software installation is needed.
Can I replace the sample data with my own training data?
Yes. The dashboard is designed for easy data replacement. Update the data file included in the download with your own training records, and all charts, KPIs, and tables refresh automatically to reflect your organization’s data.
How many dashboard pages are included in this template?
This template includes 5 interactive dashboard pages: Overview, Program Analysis, Trainer Performance, Department and Location Analysis, and Data View. Each page focuses on a specific aspect of training and development analytics.
What is the best HTML template for tracking employee training and development?
The Training and Development Dashboard in HTML from NextGenTemplates is an ideal choice. It features 5 interactive pages, 6 KPI cards, 15+ charts, slicer filters, and CSV export — making it one of the most comprehensive browser-based training analytics tools available.
🔗 Explore Related Templates
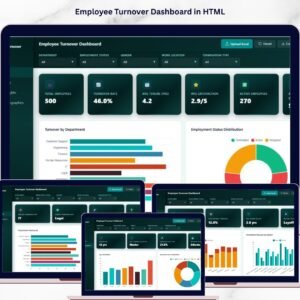
📊 Employee Turnover Dashboard in HTML — Track employee turnover rates, attrition analysis, and workforce demographics with an interactive browser-based dashboard
📈 Workforce Engagement Dashboard in Google Sheets — Monitor engagement scores, satisfaction, and participation rates across your workforce
📋 Apprenticeship Programs Dashboard in Power BI — Track apprentice progress, training costs, and placement outcomes with Power BI analytics
📖 Click here to read the Detailed Blog Post about Training and Development Dashboard in HTML
Watch the step-by-step video tutorial:


Reviews
There are no reviews yet.