Managing performance in the toy and games industry is far more complex than simply tracking monthly sales. You must deal with strong seasonality, rapidly changing consumer trends, inventory pressure, production efficiency challenges, and rising customer expectations. When performance data sits inside scattered Excel sheets or manual reports, decision-making becomes slow and reactive.
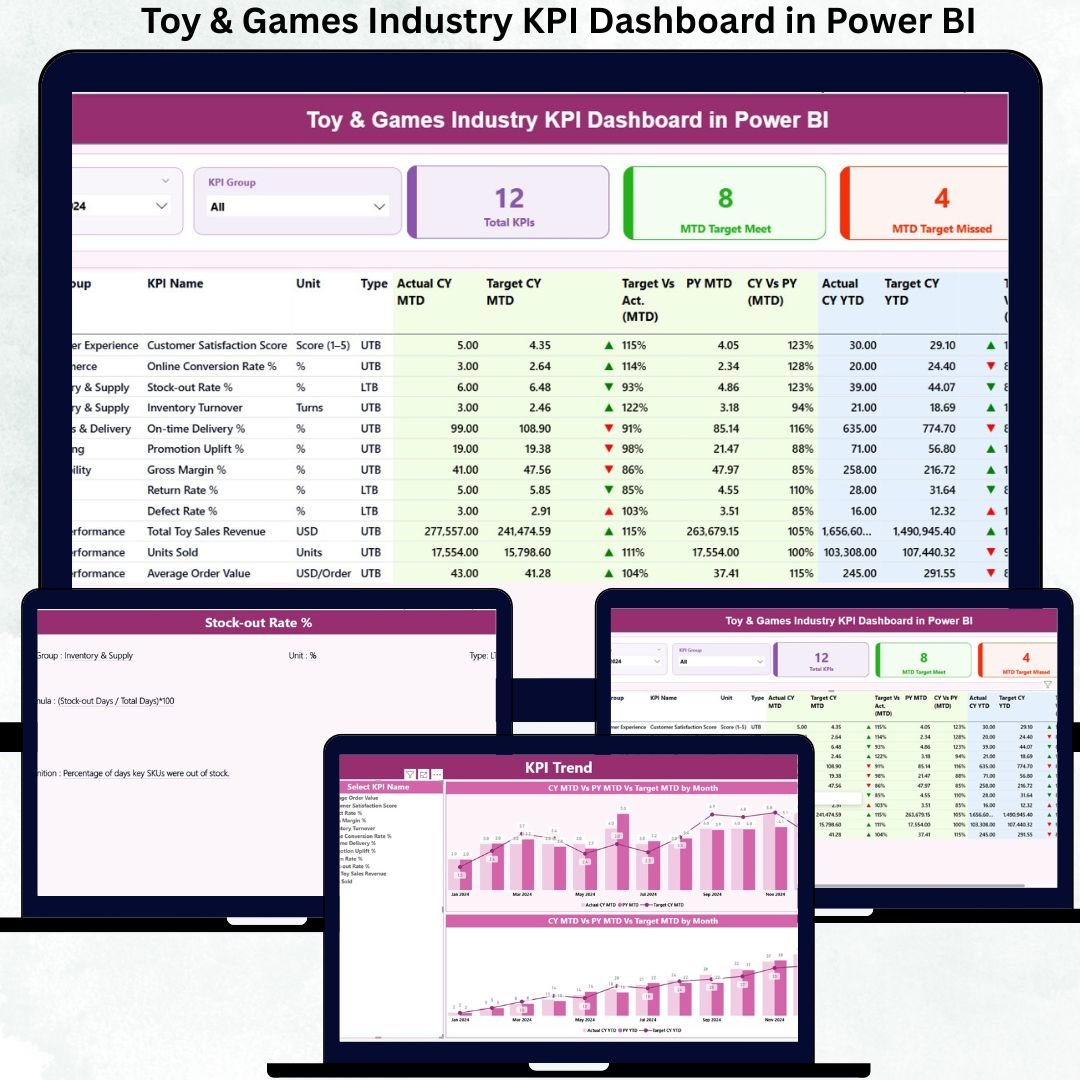
That is exactly why the Toy & Games Industry KPI Dashboard in Power BI is a powerful, ready-to-use analytics solution designed specifically for toy manufacturers, game producers, and operations teams.Toy & Games Industry KPI Dashboard in Power BI
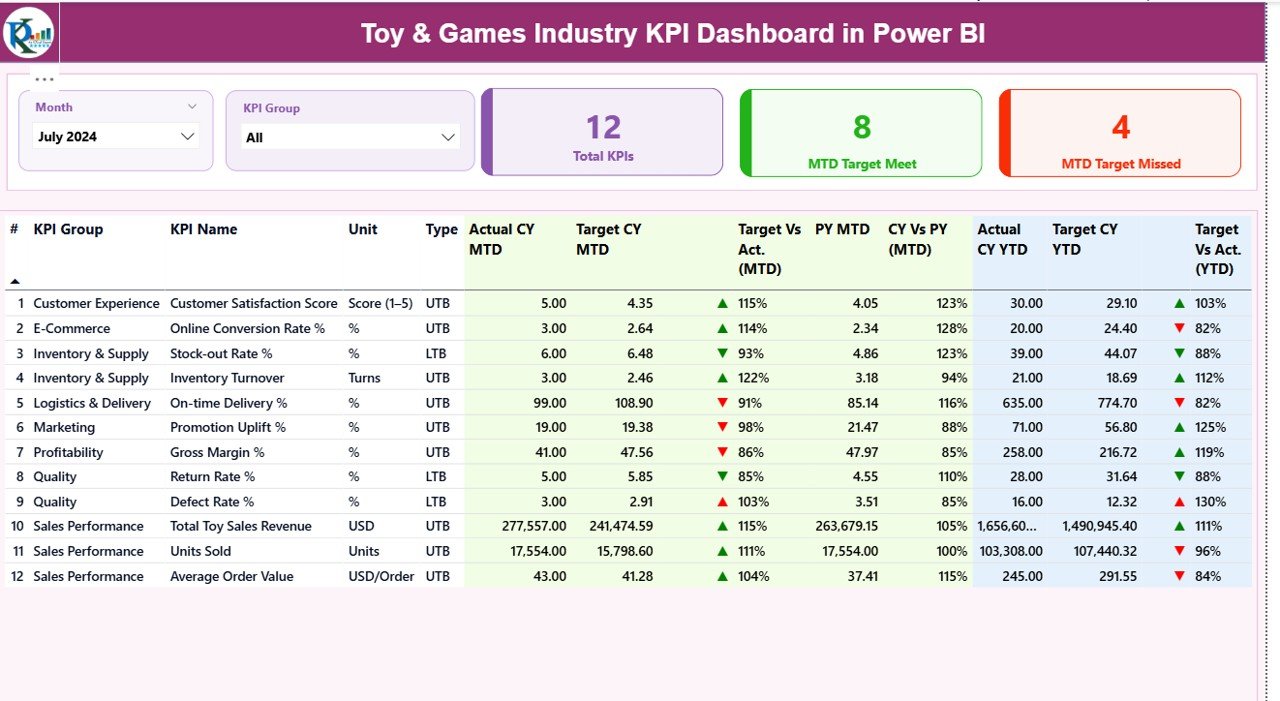
This interactive Power BI dashboard converts raw Excel data into clear KPIs, visual indicators, tables, and trend charts, helping you monitor Month-to-Date (MTD) and Year-to-Date (YTD) performance on a single screen. As a result, management teams can spot risks early, measure results accurately, and take faster, data-driven decisions.Toy & Games Industry KPI Dashboard in Power BI
## 🔑 Key Features of Toy & Games Industry KPI Dashboard in Power BI
📊 Centralized KPI Monitoring – Track all operational, sales, production, and inventory KPIs in one interactive dashboard
📅 Dynamic Month & KPI Group Slicers – Instantly filter KPIs by month and category without changing data
✅ MTD & YTD Performance Tracking – View short-term and long-term performance together
🚦 Target Met / Missed Indicators – Visual green ▲ and red ▼ arrows for quick judgmentToy & Games Industry KPI Dashboard in Power BI
📈 Trend Analysis with Combo Charts – Compare current year, previous year, and targets visually
📘 Built-in KPI Definitions – Clear KPI formulas, definitions, units, and measurement logic
🧩 Excel-Driven Data Source – Easy to maintain, scalable, and user-friendly
Toy & Games Industry KPI Dashboard in Power BI
## 📦 What’s Inside the Toy & Games Industry KPI Dashboard
This Power BI file includes three professionally designed pages, each serving a unique purpose:
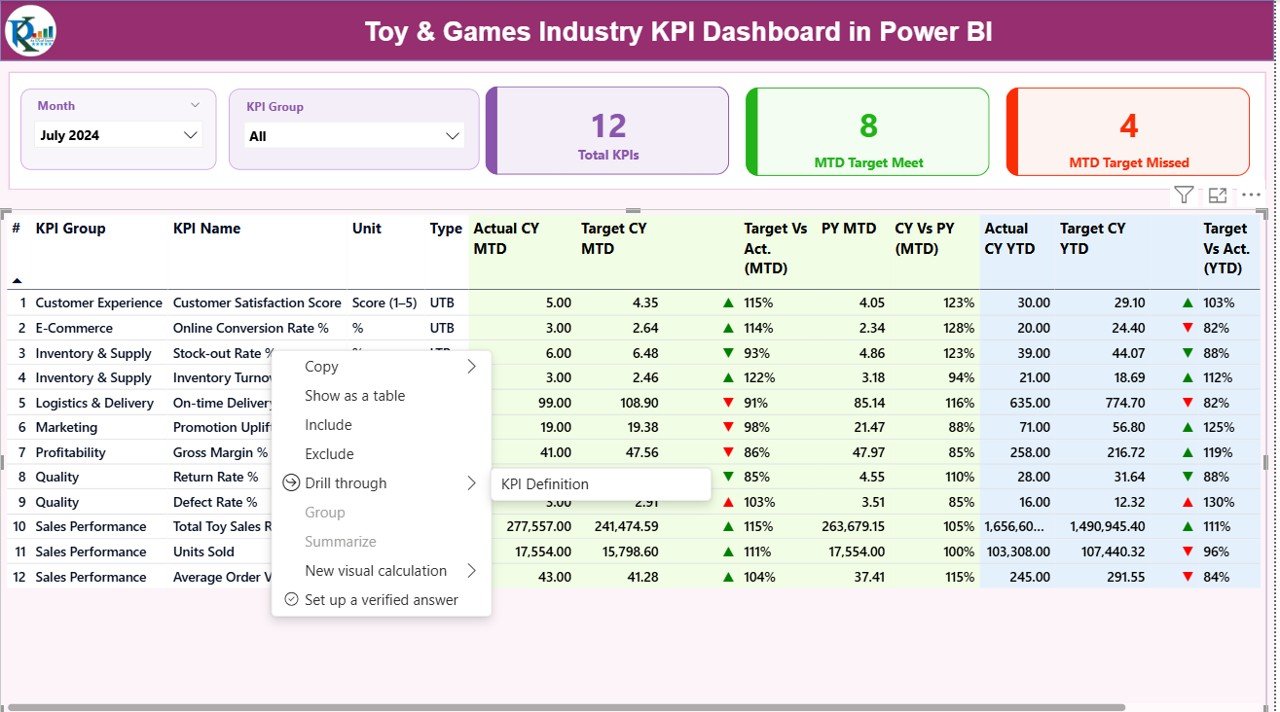
✅ Summary Page
The main control panel showing:Toy & Games Industry KPI Dashboard in Power BI
-
Month and KPI Group slicers
-
KPI cards for Total KPIs, MTD Target Met, and MTD Target Missed
-
A detailed KPI table with MTD and YTD Actuals, Targets, PY comparison, and icons
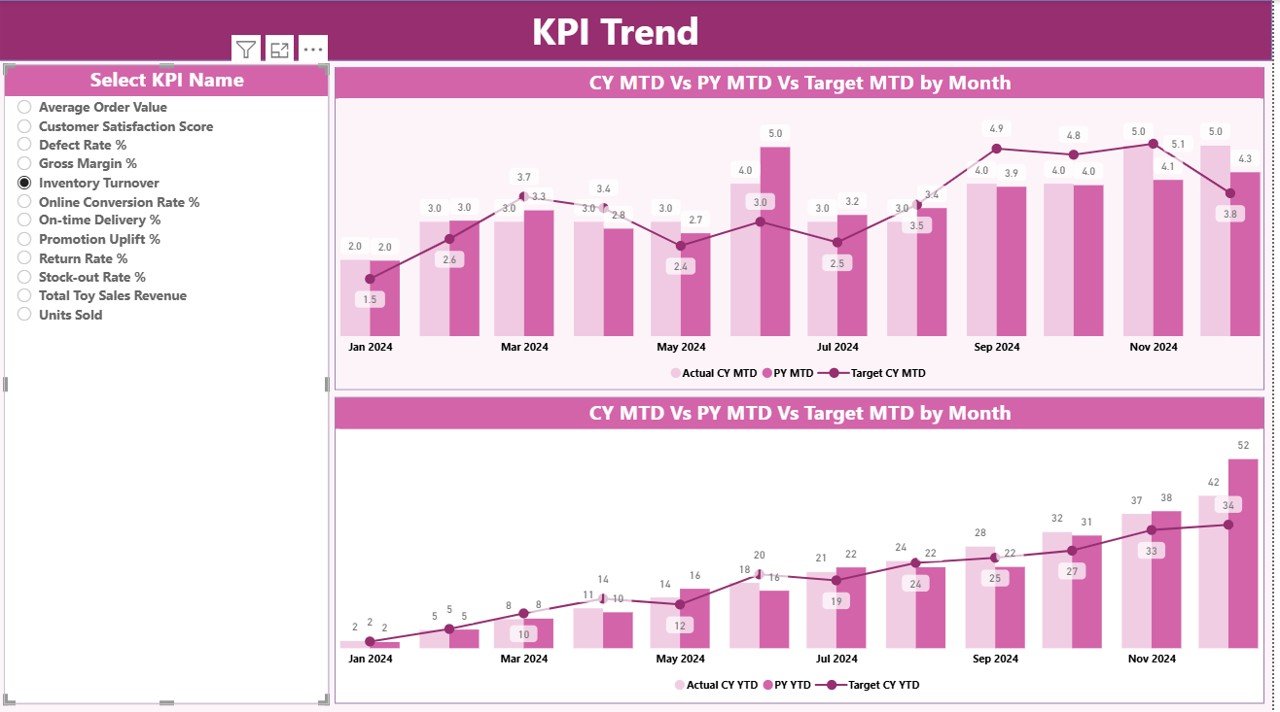
✅ KPI Trend Page
Designed for deeper analysis, this page allows:
-
KPI selection using slicers
-
Combo charts showing Current Year, Previous Year, and Target trends
-
Clear visibility of seasonal patterns and performance gaps
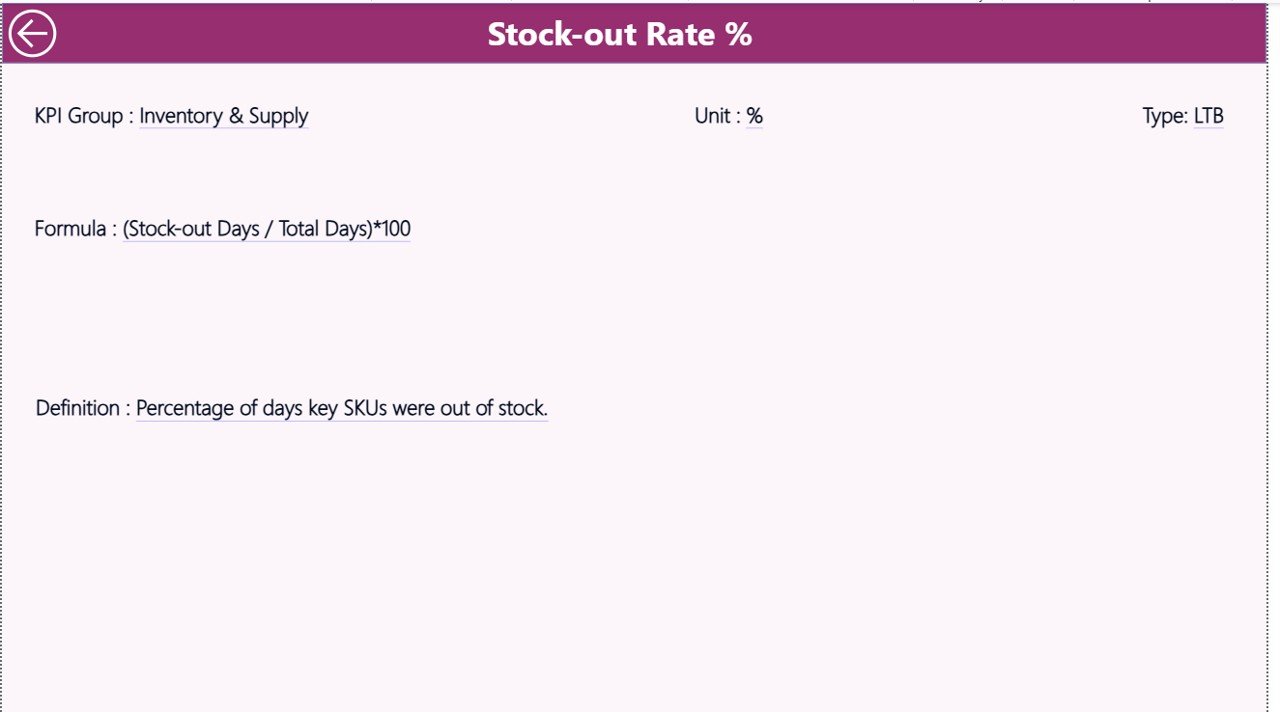
✅ KPI Definition Page
A governance and reference page containing:
-
KPI Number, Group, Name, Unit
-
Formula and Definition
-
KPI Type (LTB / UTB)
-
Drill-through functionality for easy access
## 🛠️ How to Use the Toy & Games Industry KPI Dashboard
⚙️ Step 1: Enter actual KPI values in the Input_Actual Excel sheet
🎯 Step 2: Enter target values in the Input_Target Excel sheet
🔄 Step 3: Refresh the Power BI dashboardToy & Games Industry KPI Dashboard in Power BI
📊 Step 4: Use slicers to analyze MTD & YTD performance instantly
No advanced Power BI knowledge is required—basic Excel skills are enough to operate and maintain this dashboard smoothly.
## 👥 Who Can Benefit from This Toy & Games Industry KPI Dashboard
🎲 Toy manufacturers and game producers
📦 Inventory and supply chain teams
📈 Sales and operations managers
🧠 Strategy and planning teams
🏭 Production and quality managers
👔 Business owners and leadership teams
Whether you are a small toy brand or a large manufacturing operation, this dashboard adapts easily to your scale.
### 📖 Click here to read the Detailed Blog Post
Watch the step-by-step video tutorial:


Reviews
There are no reviews yet.