
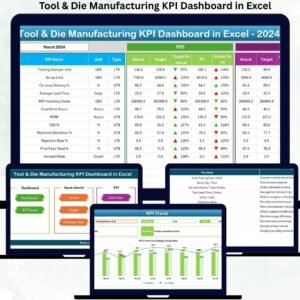
The Tool & Die Manufacturing KPI Dashboard in Excel is a powerful, ready-to-use performance management tool designed to help toolrooms, die shops, machining units, and engineering manufacturers track their critical KPIs with absolute clarity. Tool & die operations demand precision, tight tolerances, low defects, timely delivery, and strict cost control—and this Excel dashboard gives you everything you need to manage it confidently.
Whether you’re dealing with machining hours, tool wear, rejection %, delivery delays, scrap cost, or maintenance trends, this dashboard turns complex data into simple visuals and easy-to-understand insights. Just update your monthly numbers, select the month from the dropdown, and watch the entire dashboard refresh instantly. No coding. No expensive software. No complicated learning curve.
If you want faster decisions, reduced downtime, improved quality, and complete visibility across your tool & die operations, this Excel dashboard is the perfect solution for you.
✨ Key Features of the Tool & Die Manufacturing KPI Dashboard in Excel
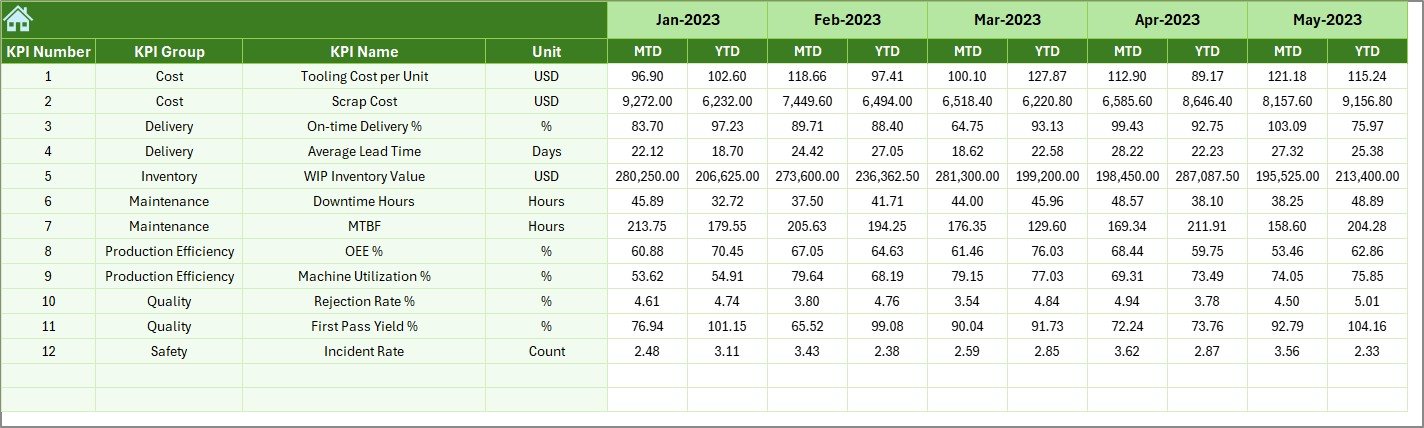
⚙️ Fully Automated Dashboard: Get MTD & YTD metrics, targets, and previous-year comparisons — all updated instantly with a single month selection.
📊 Smart Visual KPIs: Conditional formatting with up/down arrows makes it easy to identify improvements or performance declines.
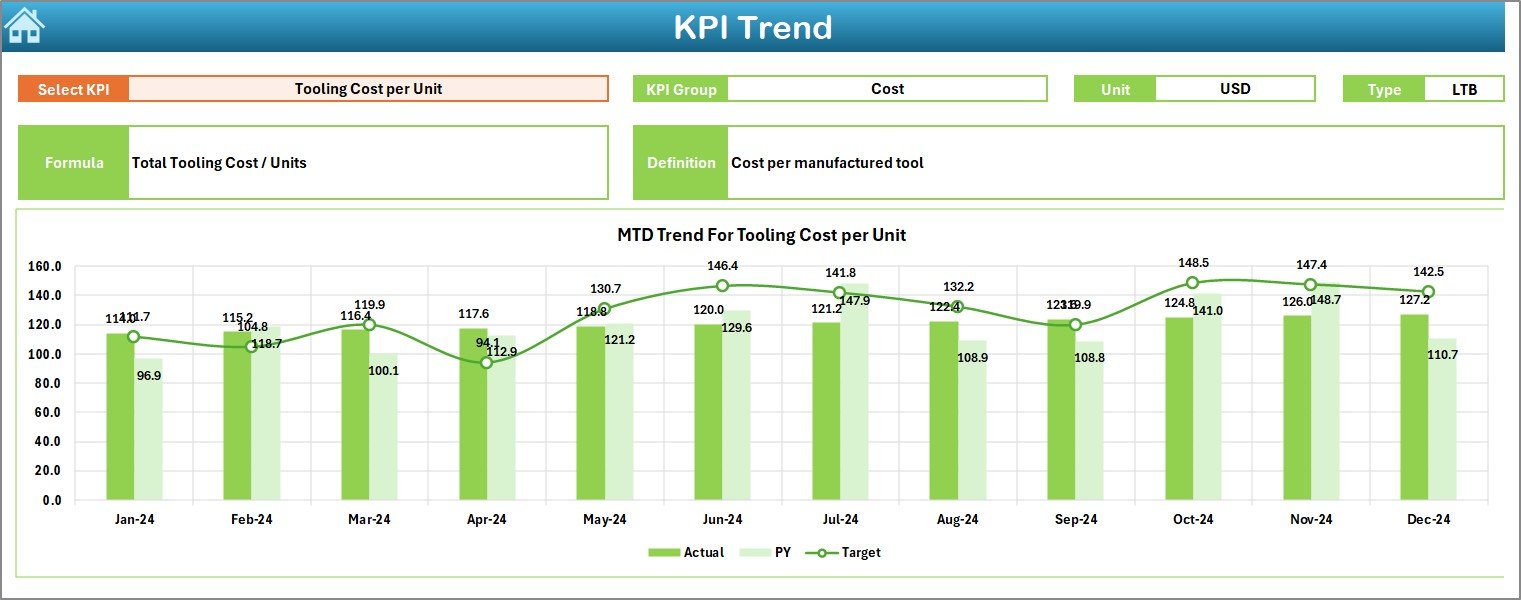
📉 Trend Analysis Sheet: View 12-month trends for any KPI with Actual vs. Target vs. Previous Year charts.
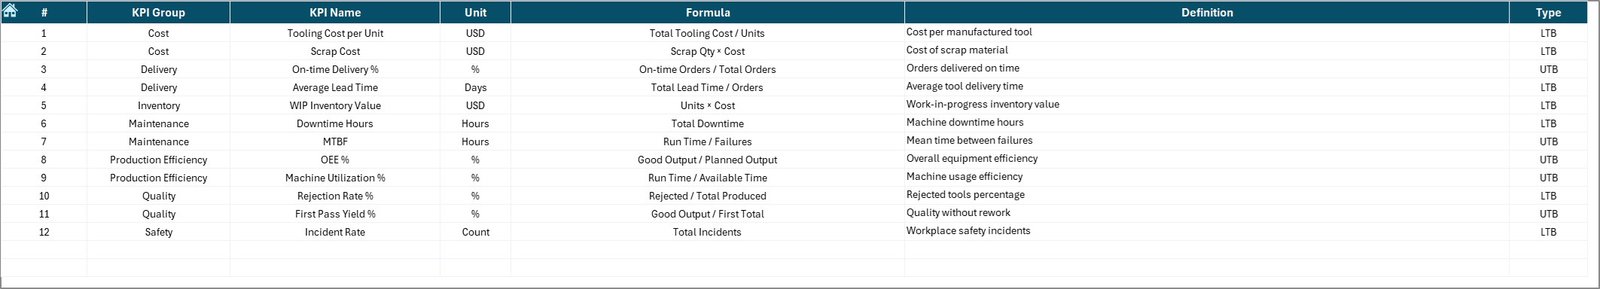
📝 Structured KPI Definitions: Every KPI includes its formula, definition, group, and type (UTB/LTB) for complete clarity.
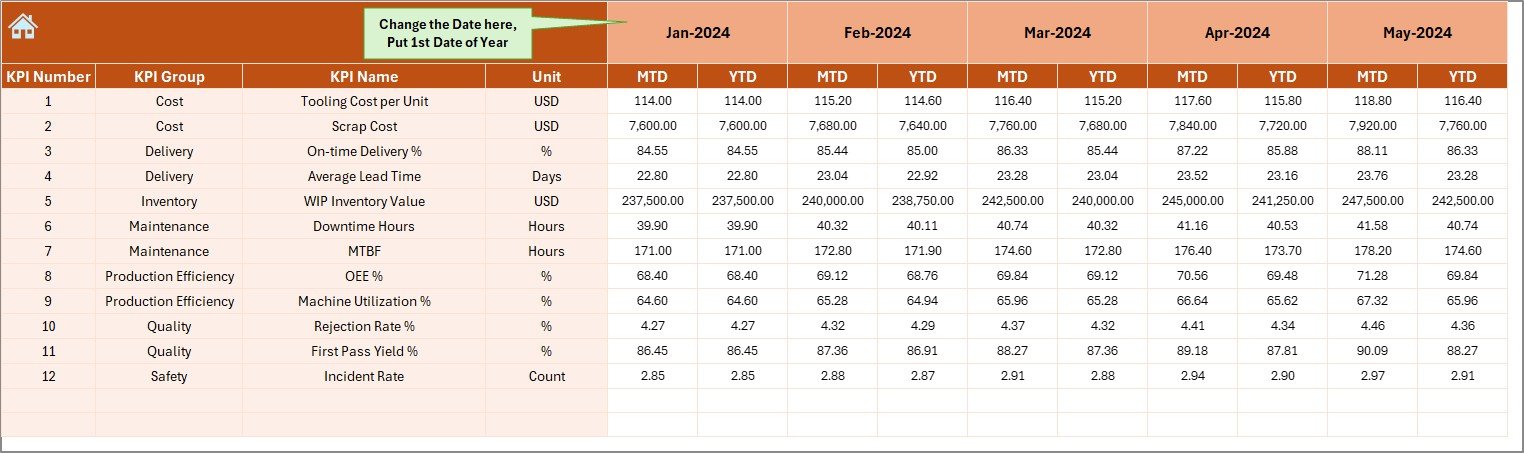
🎯 Target & Actual Input Sheets: Enter data once and the dashboard updates everywhere automatically.
⏳ Historical Comparison: Compare performance with previous years to analyze growth, gaps, and patterns.
🧭 Clean Navigation System: A summary page with clickable buttons makes navigation effortless for all team members.

📦 What’s Inside the Tool & Die Manufacturing KPI Dashboard in Excel
Inside this product, you will receive a professionally designed Excel file containing:
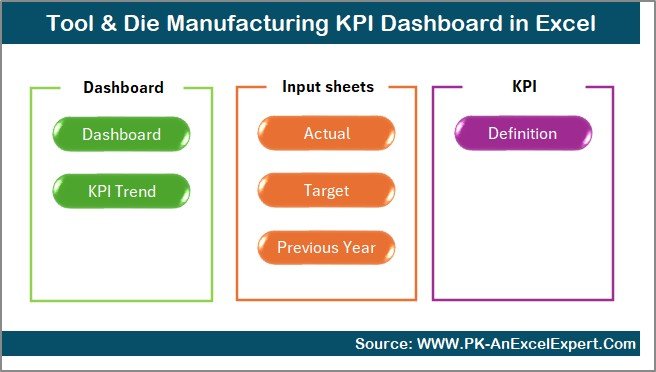
✨ 7 dedicated worksheets:
-
Summary Page
-
Main Dashboard
-
Trend Analysis
-
Actual Numbers Input
-
Target Input
-
Previous Year Data
-
KPI Definitions
✨ Interactive dropdown selections for month and KPI views
✨ Dynamic charts and tables for real-time updates
✨ Well-structured data tables for easy maintenance and customization
This is a complete analytical system—ready to use from day one.
🧭 How to Use the Tool & Die Manufacturing KPI Dashboard in Excel
Using this dashboard is extremely simple:
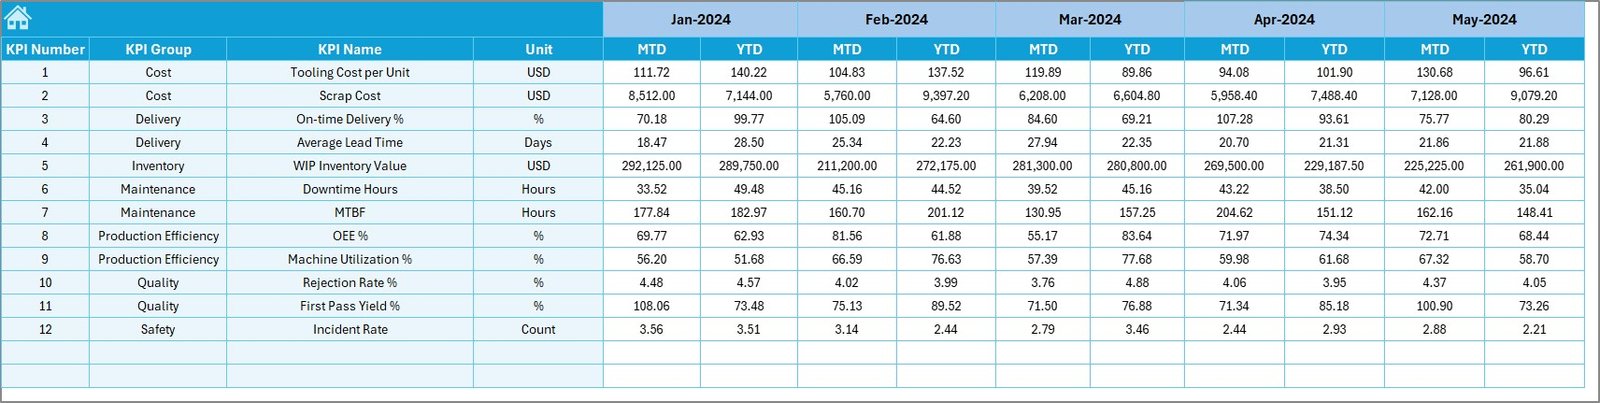
1️⃣ Enter your MTD & YTD values in the Actual Numbers sheet
2️⃣ Set your monthly targets in the Target sheet
3️⃣ Add previous year values for comparison
4️⃣ Go to the Dashboard tab and select a month from the dropdown
5️⃣ Analyze KPIs instantly — no formulas or chart setup needed
You can also customize KPIs, colors, layouts, and formulas as per your business needs. Everything is fully open and editable.
👥 Who Can Benefit from This Tool & Die KPI Dashboard?
This Excel dashboard is extremely helpful for:
🏭 Tool & Die Manufacturers – to track performance and reduce bottlenecks
🛠 Machine Shops – to monitor cycle time, output, tool wear, and machining efficiency
📐 Engineering & Production Teams – to analyze tool life, quality, and rework trends
📦 Automotive & Aerospace Suppliers – to maintain strict quality and delivery standards
📊 Plant Managers & Operations Heads – to get accurate reports instantly
💼 Business Owners – to make faster decisions without relying on scattered spreadsheets
If your business depends on precision manufacturing, this dashboard will transform the way you monitor and improve performance.
### Click here to read the Detailed blog post
Watch the step-by-step video tutorial:


Reviews
There are no reviews yet.