Subscription box businesses are growing rapidly across industries such as beauty, food, fitness, lifestyle, books, and digital services. While subscriber numbers increase, managing performance using scattered spreadsheets quickly becomes complex and time-consuming. Founders and managers often struggle to track growth, churn, revenue, targets, and trends in one place.
The Subscription Box Services KPI Dashboard in Excel is designed to solve this exact challenge.
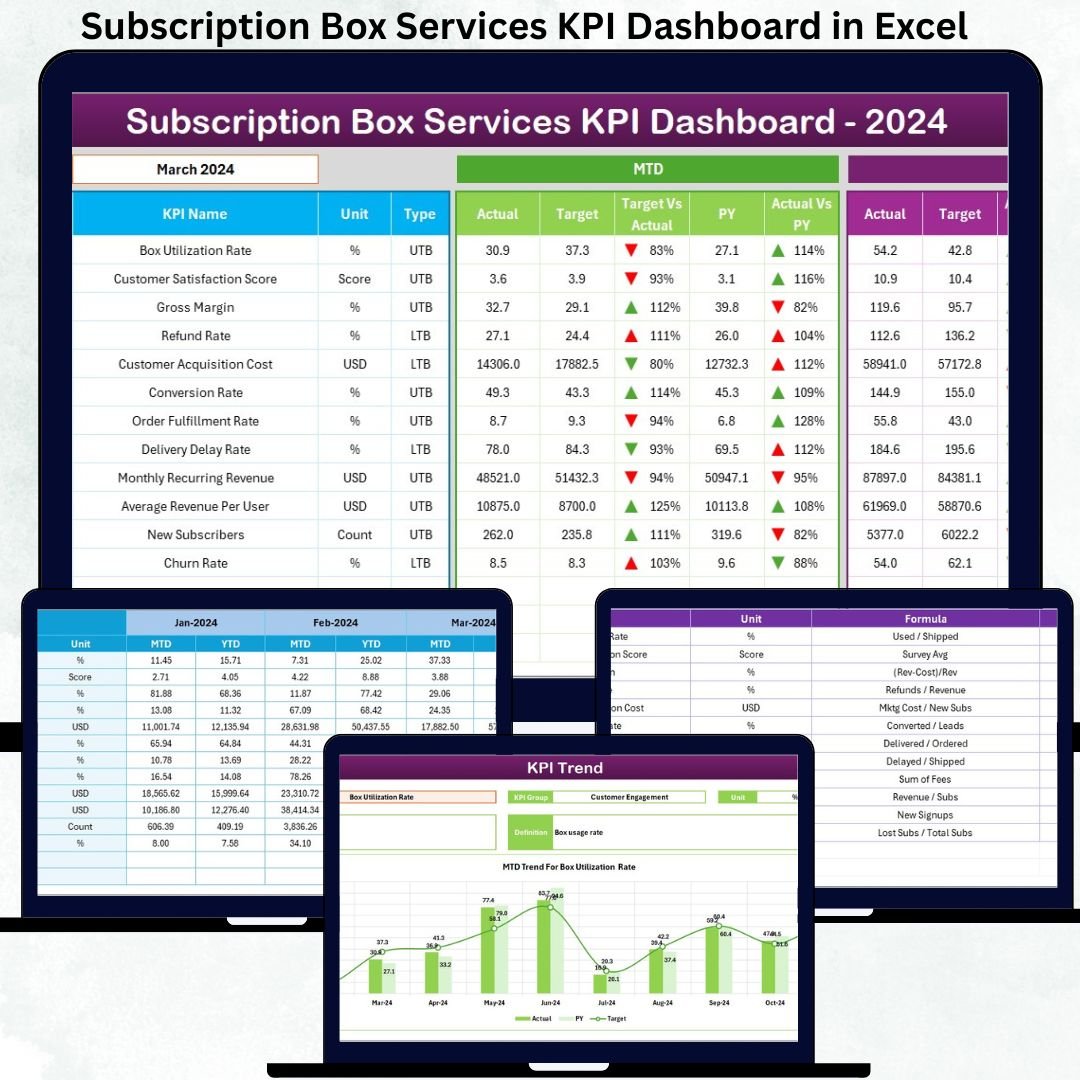
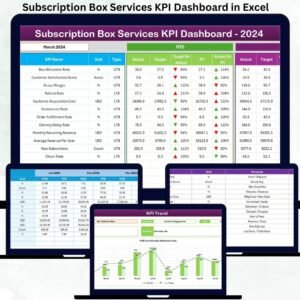
This ready-to-use Excel dashboard converts raw subscription data into clear KPIs, dynamic comparisons, trend charts, and visual indicators. It helps subscription businesses monitor Month-to-Date (MTD) and Year-to-Date (YTD) performance, compare actual vs target results, analyze previous year trends, and identify performance gaps instantly. With structured worksheets, dropdowns, and conditional formatting, this dashboard becomes your single source of truth for subscription performance ⚡.
Whether you run a small startup or a fast-growing subscription brand, this dashboard helps you make data-driven decisions without complexity.
Key Features of the Subscription Box Services KPI Dashboard in Excel ✨
This dashboard is built for clarity, simplicity, and control:
📊 Centralized KPI Tracking – All subscription KPIs in one file
🎯 MTD & YTD Performance Monitoring – Short-term and long-term insights
📉 Target vs Actual Analysis – Identify performance gaps instantly
📈 Previous Year Comparison – Measure real business growth
🚦 Visual Performance Indicators (▲ ▼) – Spot issues at a glance
📌 Interactive KPI Trend Analysis – Understand performance direction
🧭 Easy Navigation with Home Sheet – One-click access to all pages
⚡ 100% Excel-Based Solution – No additional software required
This dashboard is not just a tracker—it is a subscription performance management tool.
What’s Inside the Subscription Box Services KPI Dashboard in Excel 📂
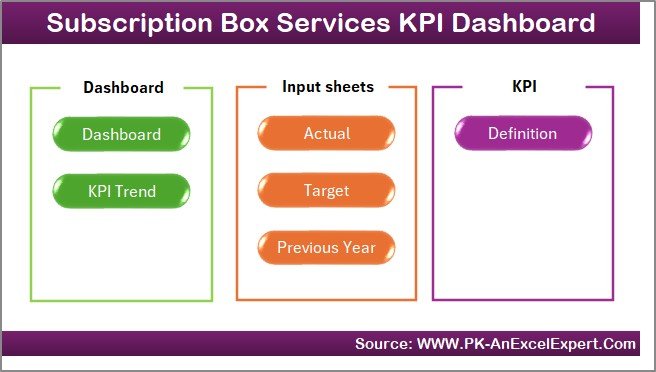
The Excel file includes 7 well-structured worksheets, each serving a clear purpose.
📌 1. Home Sheet – Smart Navigation Hub
The Home Sheet acts as an index page.
🔹 6 clickable buttons
🔹 One-click navigation to all major sheets
🔹 Ideal for presentations and non-technical users
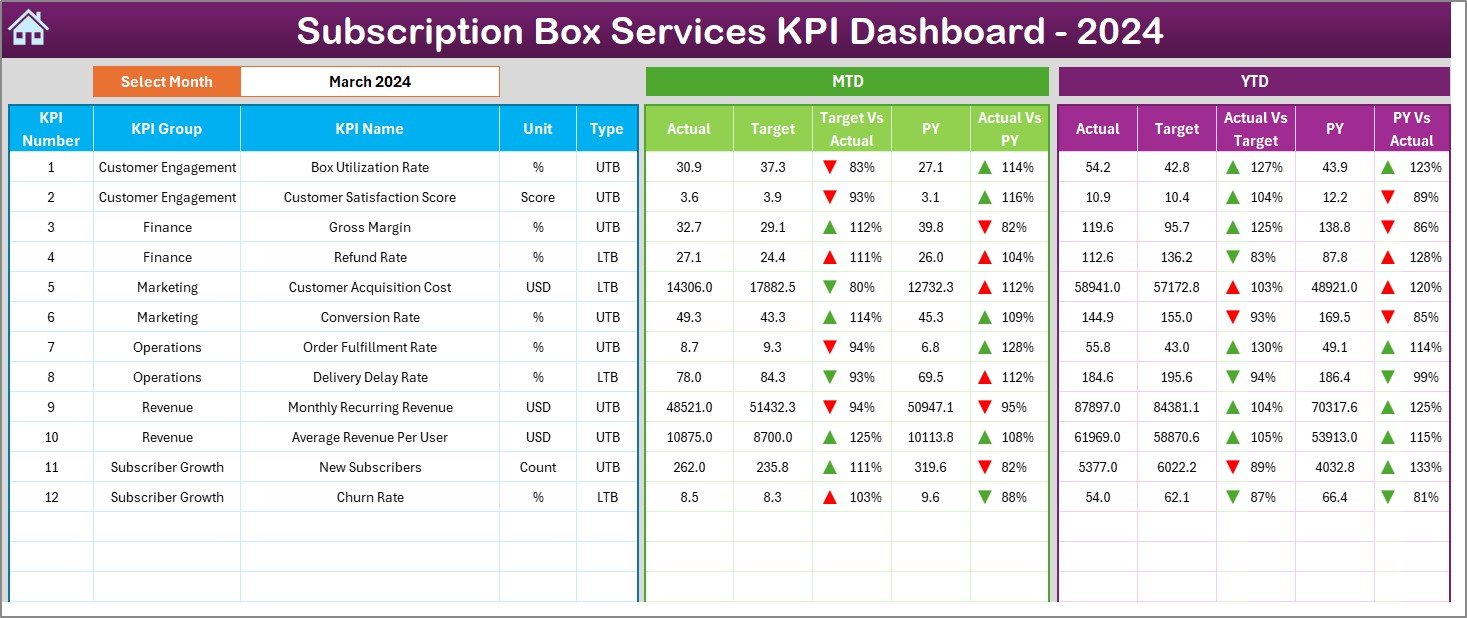
📌 2. Dashboard Sheet – Complete KPI Performance View
This is the core analysis page.
📅 Month Selector (Cell D3)
Changing the month instantly updates the entire dashboard.
📊 MTD Section Displays:
-
MTD Actual
-
MTD Target
-
MTD Previous Year
-
Target vs Actual %
-
PY vs Actual %
-
▲ ▼ performance arrows
📈 YTD Section Displays:
-
YTD Actual
-
YTD Target
-
YTD Previous Year
-
Target vs Actual %
-
PY vs Actual %
-
▲ ▼ performance arrows
This structure provides instant clarity on growth, retention, and revenue trends.
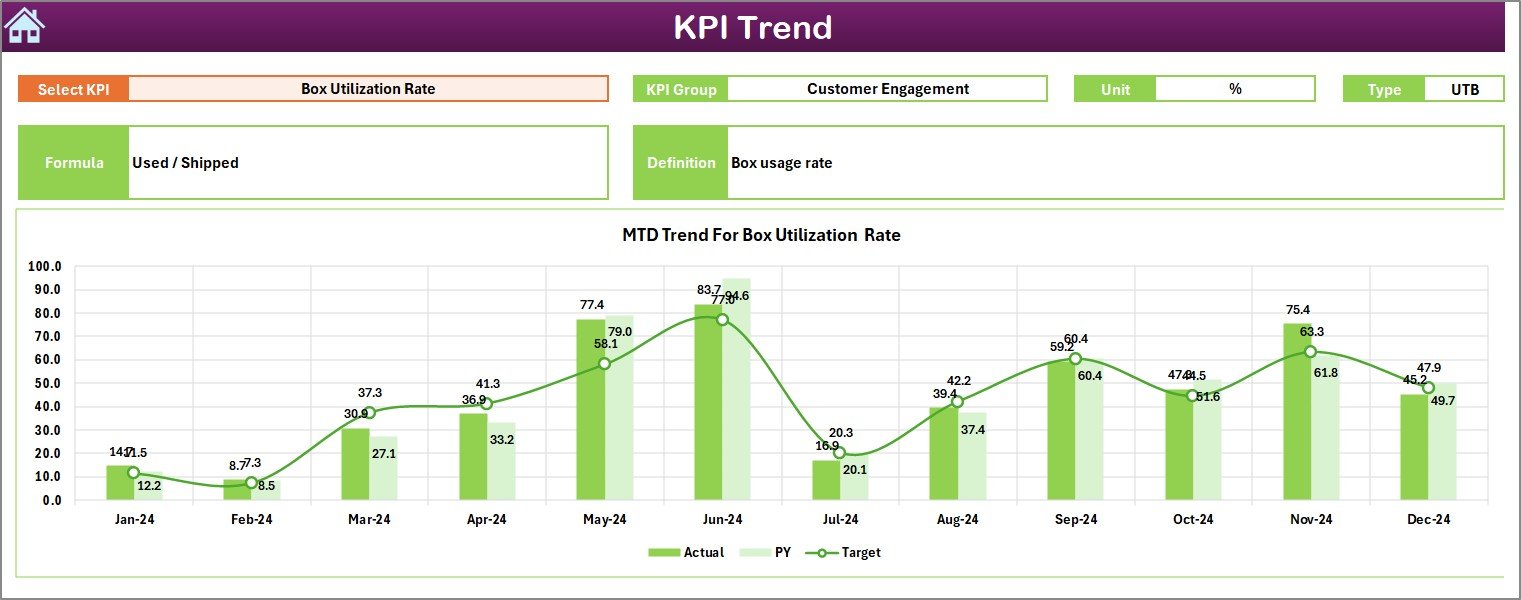
📌 3. KPI Trend Sheet – Performance Trends Over Time
This sheet focuses on deeper KPI insights.
🎯 KPI selection dropdown (Cell C3)
📌 Displays KPI Group, Unit, Type (LTB / UTB), Formula, and Definition
📉 MTD Trend Chart – Actual vs Target vs PY
📈 YTD Trend Chart – Actual vs Target vs PY
Trend charts help identify seasonality, growth patterns, and churn risks.
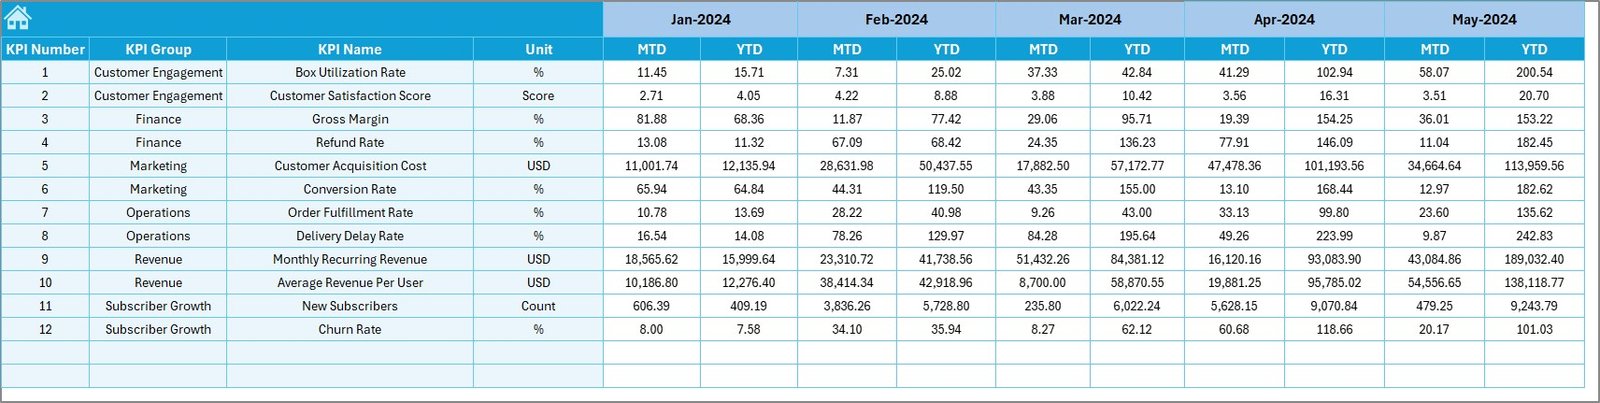
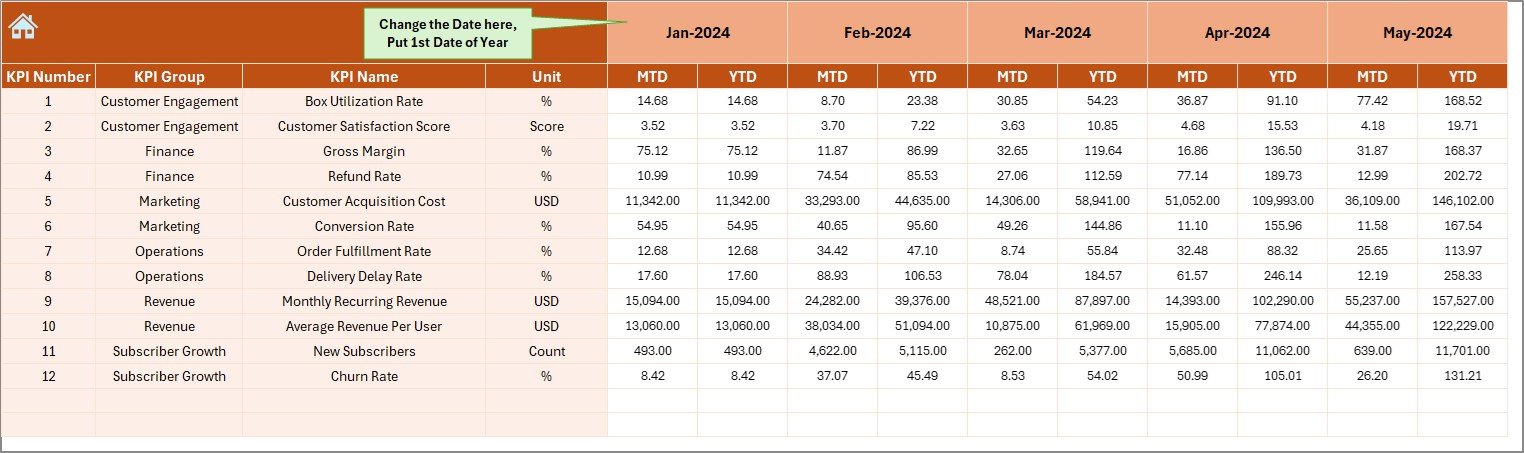
📌 4. Actual Numbers Input Sheet
This sheet captures real business performance.
🔹 Month selector (Cell E1 – first month of the year)
🔹 KPI-wise MTD Actual values
🔹 KPI-wise YTD Actual values
This sheet drives the entire dashboard logic.
📌 5. Target Sheet
This sheet stores planned goals.
🎯 KPI-wise MTD Targets
🎯 KPI-wise YTD Targets
Targets can be updated anytime without affecting historical data.
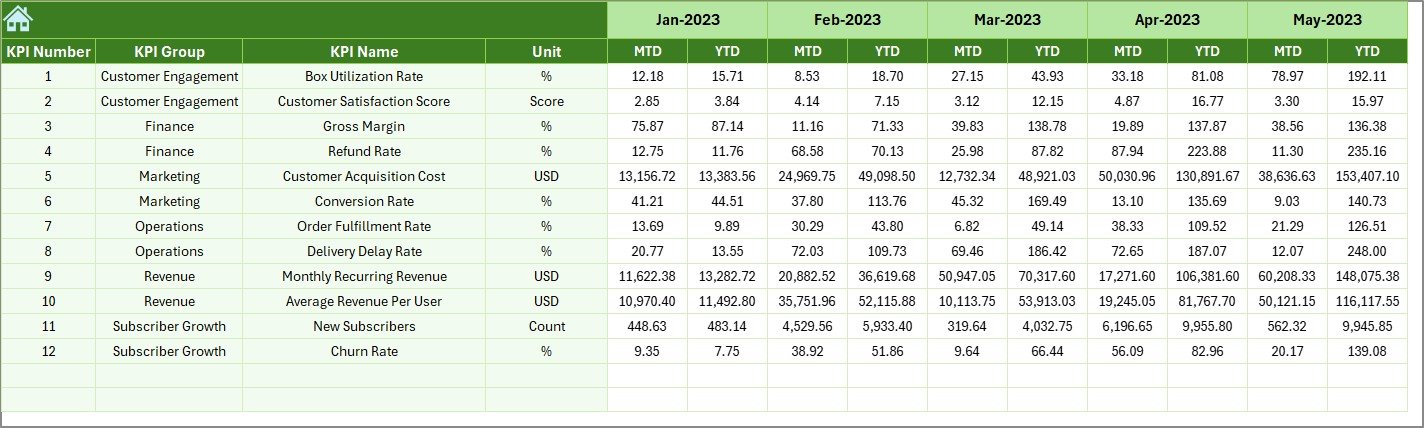
📌 6. Previous Year Number Sheet
This sheet enables year-over-year comparison.
📊 KPI-wise Previous Year MTD values
📊 KPI-wise Previous Year YTD values
This comparison helps measure true subscription growth.
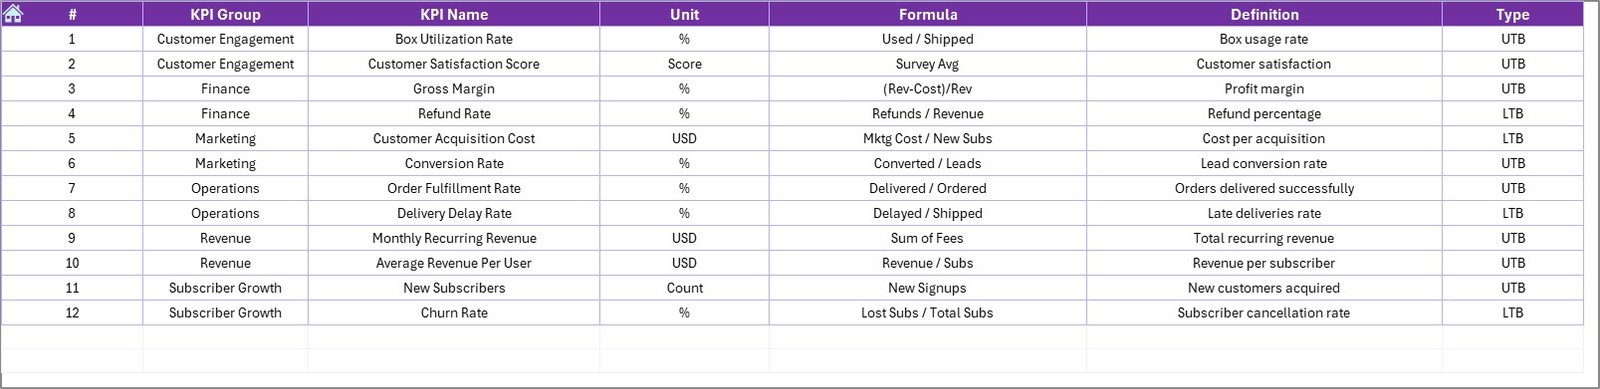
📌 7. KPI Definition Sheet
The backbone of the dashboard.
📘 KPI Name
📘 KPI Group
📘 Unit
📘 Formula
📘 KPI Definition
All KPIs are controlled from this sheet, making the dashboard flexible and scalable.
How to Use the Subscription Box Services KPI Dashboard in Excel 🛠️
Using the dashboard is simple:
1️⃣ Define KPIs in the KPI Definition sheet
2️⃣ Enter actual data in the Actual Numbers Input sheet
3️⃣ Enter targets in the Target sheet
4️⃣ Update previous year data
5️⃣ Select the month on the Dashboard sheet
6️⃣ Review MTD, YTD, trends, and indicators
No advanced Excel skills required 💡.
Who Can Benefit from This Dashboard? 👥
This dashboard is ideal for:
📦 Subscription Box Founders
📊 Operations Managers
💰 Finance Teams
📣 Marketing Managers
📈 Business Analysts
🚀 Startup Consultants
Any subscription-based business can use it effectively.


Reviews
There are no reviews yet.