Managing smart city contracts without clear performance visibility can quickly lead to delays, cost overruns, compliance risks, and governance failures. Because smart city initiatives involve public funds, long-term vendor contracts, strict SLAs, and high public accountability, even small performance gaps can escalate into major operational issues.
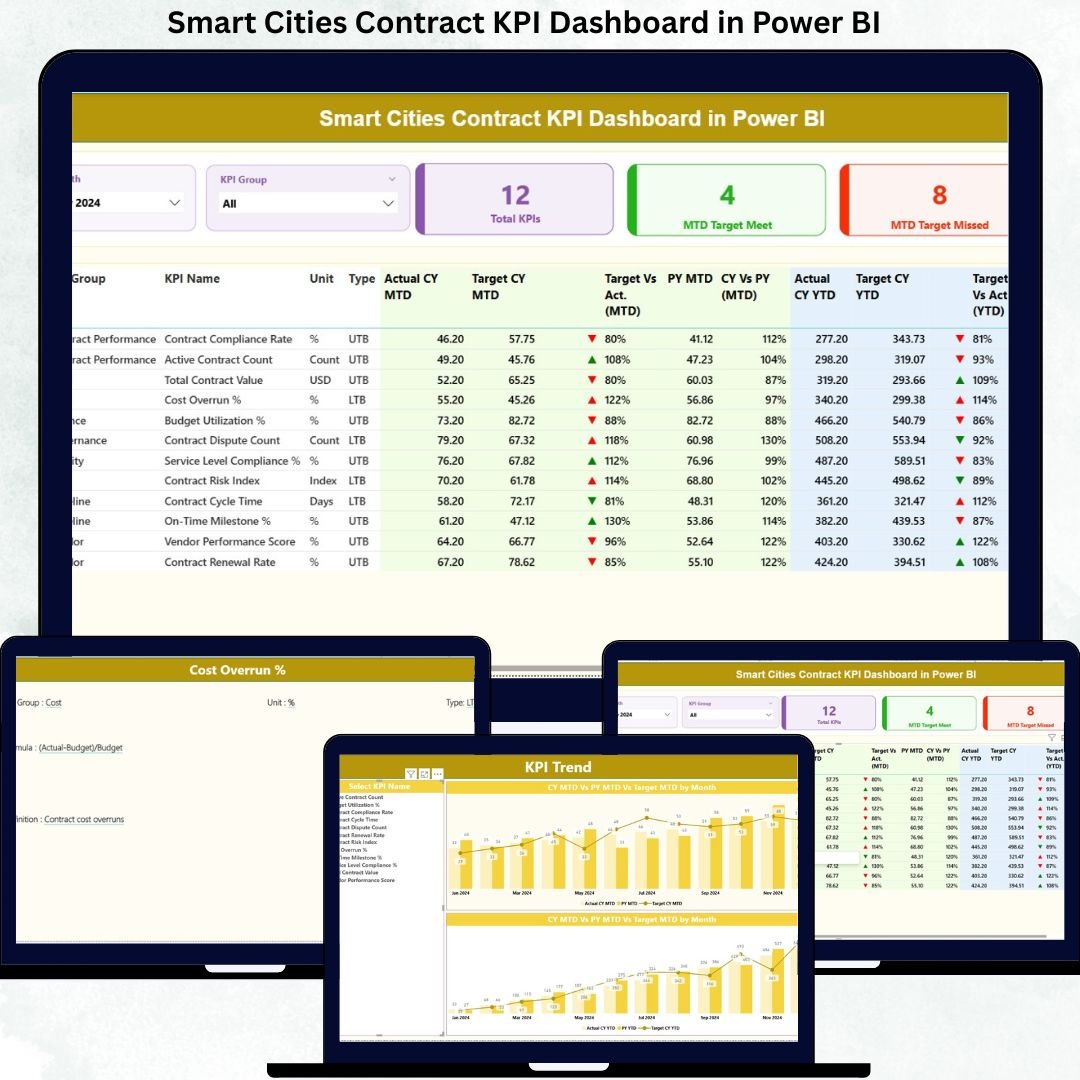
That is exactly why the Smart Cities Contract KPI Dashboard in Power BI is designed as a powerful, ready-to-use performance monitoring solution. This dashboard transforms complex contract data into clear KPIs, visual indicators, and actionable insights—all in one centralized Power BI report.
Instead of relying on scattered Excel files and manual reports, decision-makers gain instant visibility into contract health, performance trends, and compliance status. As a result, cities move from reactive issue handling to proactive contract governance.
🚀 Key Features of Smart Cities Contract KPI Dashboard in Power BI
✅ Centralized Contract KPI Monitoring
Track all smart city contract KPIs from a single interactive Power BI dashboard without juggling multiple reports.
📅 Dynamic Month & KPI Group Slicers
Filter performance instantly by reporting month or KPI category for focused analysis.
🎯 MTD & YTD Performance Tracking
Monitor short-term and long-term contract performance with automated Month-to-Date and Year-to-Date calculations.
📊 Target vs Actual Comparison
Identify over-performance or under-performance using percentage metrics and intuitive visual indicators.
📈 Year-over-Year Performance Analysis
Compare current year results with previous year values to spot trends and improvements.
🔁 Standardized KPI Logic
Use consistent KPI definitions, formulas, and measurement logic to eliminate reporting confusion.
📦 What’s Inside the Smart Cities Contract KPI Dashboard in Power BI
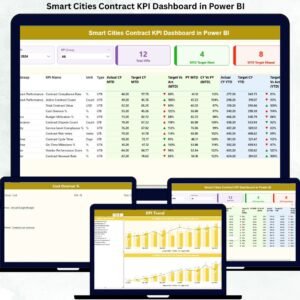
This digital product includes a professionally designed Power BI Desktop file powered by a clean and structured Excel data model.
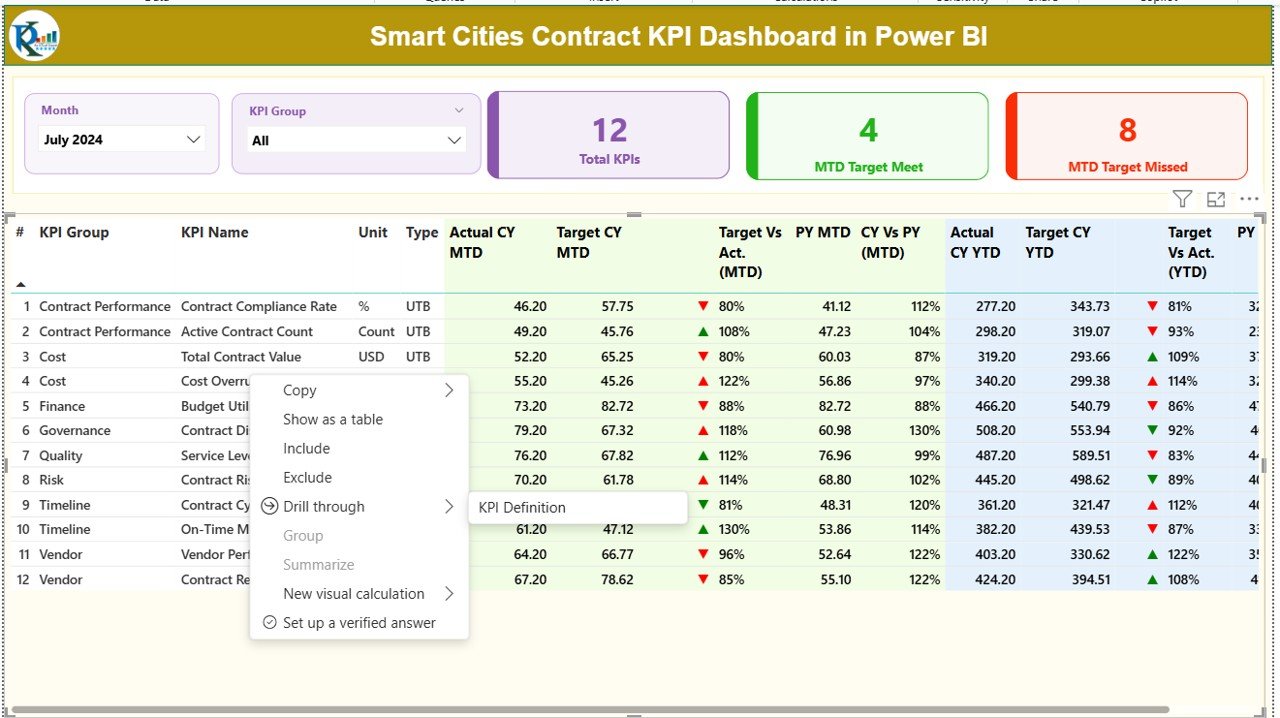
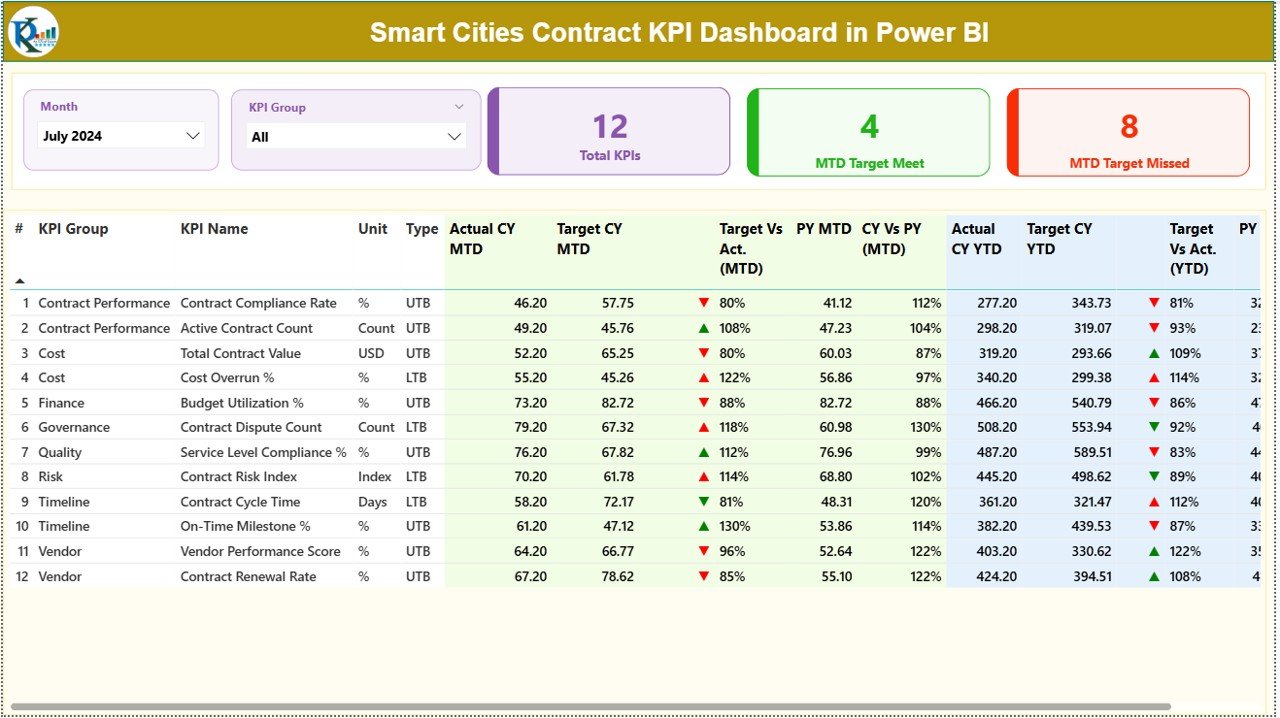
🔹 Summary Page
The main control panel displaying:
-
Total KPIs count
-
MTD target met count
-
MTD target missed count
-
Detailed KPI table with MTD & YTD metrics, icons, and comparisons
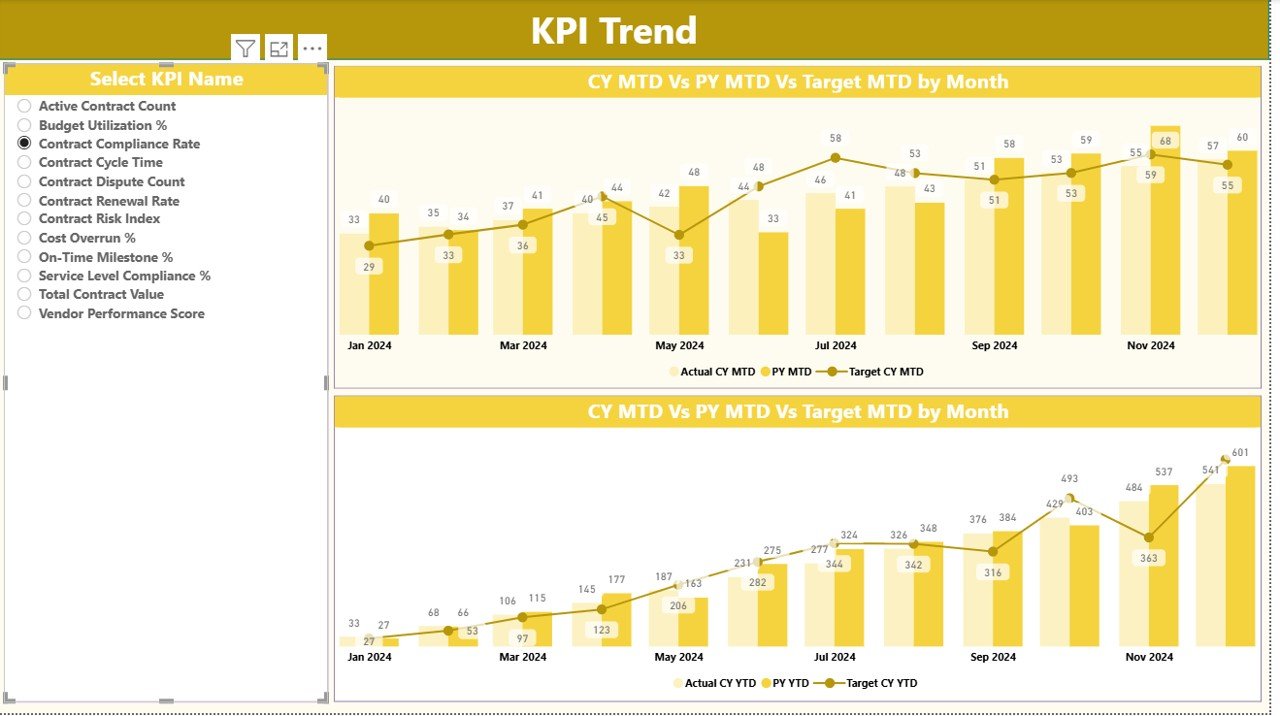
🔹 KPI Trend Page
Analyze performance over time using:
-
Combo charts for MTD and YTD
-
Actual vs Target vs Previous Year comparisons
-
KPI selection slicer for focused trend analysis
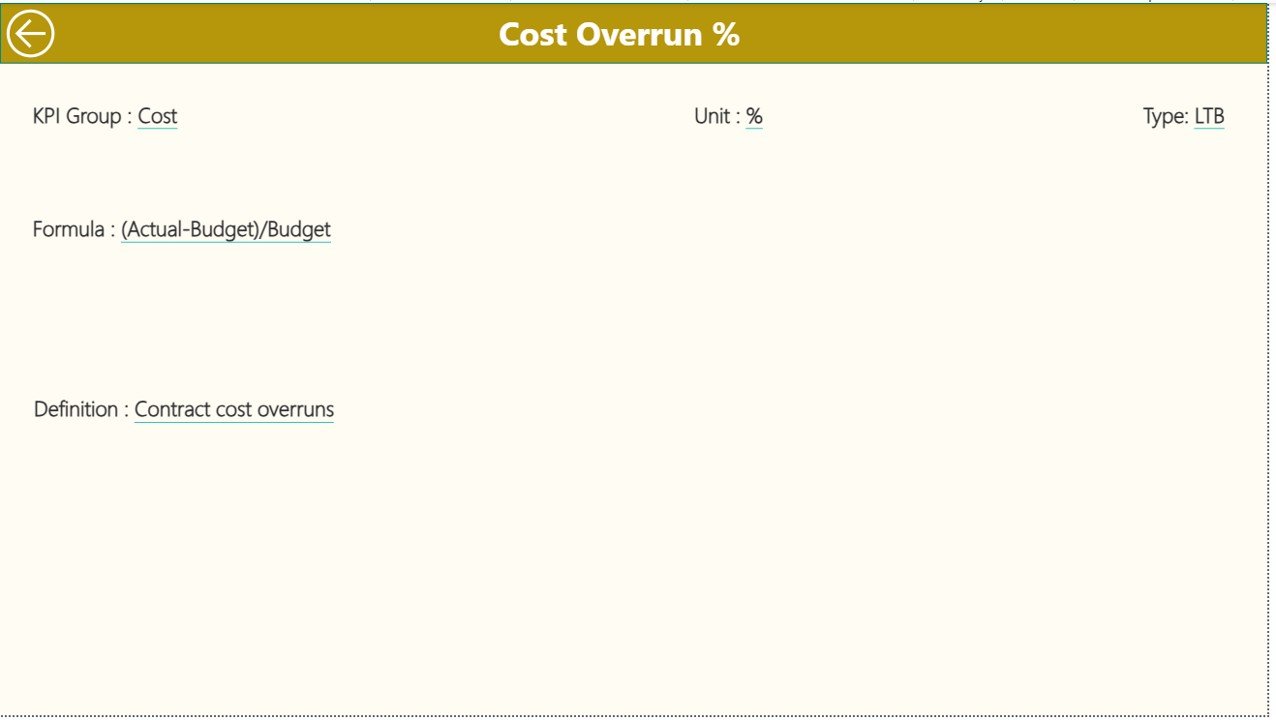
🔹 KPI Definition Page
A drill-through documentation page showing:
-
KPI formula
-
KPI definition
-
KPI type (LTB / UTB)
-
Measurement logic
This ensures governance clarity and audit-ready documentation.
⚙️ How to Use the Smart Cities Contract KPI Dashboard in Power BI
Using this dashboard is simple and business-friendly—no advanced technical skills required.
1️⃣ Enter actual KPI values in the Excel input file
2️⃣ Enter target KPI values in the Excel file
3️⃣ Define KPIs, units, and formulas once
4️⃣ Refresh the Power BI dashboard
5️⃣ Instantly analyze contract performance
Because the data structure is standardized, updates are fast, accurate, and scalable across multiple contracts.
👥 Who Can Benefit from This Smart Cities Contract KPI Dashboard in Power BI
🏙 Smart City Mission Offices – Monitor contract execution and compliance
🏛 Municipal Corporations – Improve transparency and accountability
📋 Contract Governance Teams – Track SLAs, milestones, and vendor performance
📊 Project Management Units (PMUs) – Detect risks early and act faster
🔍 Audit & Policy Teams – Ensure standardized reporting and documentation
🤝 Urban Development Authorities – Gain data-driven oversight across programs
Click here to read the Detailed Blog Post
Watch the step-by-step video tutorial:
Visit our YouTube channel to learn step-by-step video tutorials
https://www.youtube.com/@PKAnExcelExpert


Reviews
There are no reviews yet.