


🔑 Key Features of Small Business CFO Dashboard in Excel
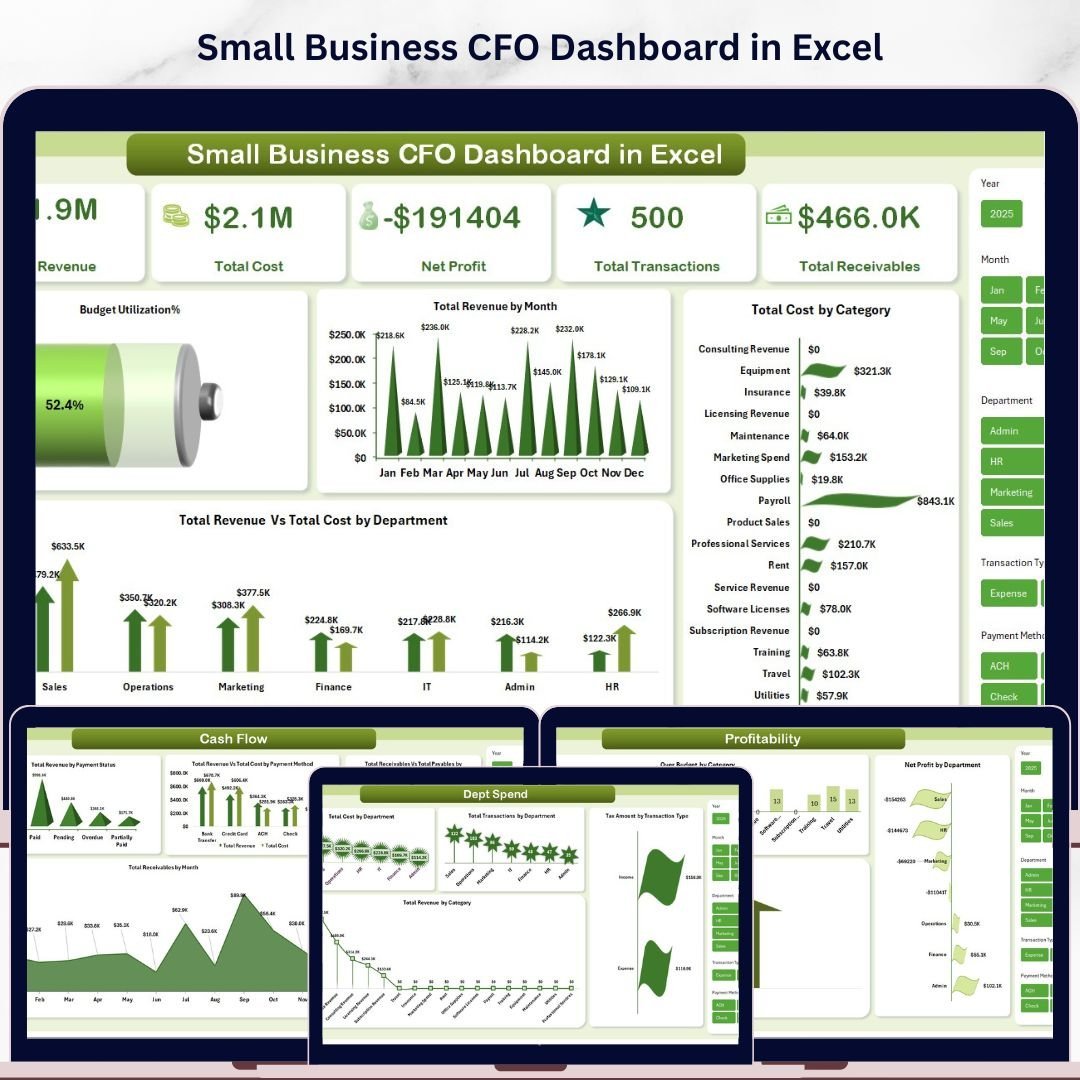
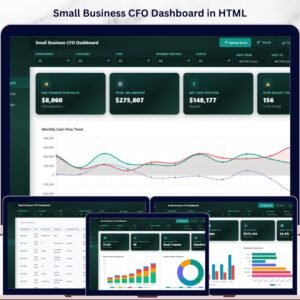
Small Business CFO Dashboard in Excel is a professionally designed, interactive financial analytics template built specifically for small business owners, CFOs, finance managers, and startup founders who need to track Total Revenue, Total Cost, Net Profit, Total Transactions, and Total Receivables from a single, powerful dashboard. This template includes 5 interactive dashboard pages covering Overview, Cash Flow, Budget Analysis, Department Spend, and Profitability — plus a dedicated Data Sheet and Support Sheet — making it one of the most comprehensive HTML Dashboard Templates available for small business financial management.
Whether you are running a growing startup or managing the finances of an established small business, this dashboard transforms your raw financial data into stunning, actionable visual insights. If you have been looking for a reliable, data-driven way to monitor cash flow, analyze budgets, and evaluate department-level spending, the Small Business CFO Dashboard in Excel is the solution you need. Also explore our Business Valuation Dashboard in Excel and Subscription Business Dashboard in Excel for complementary financial analytics tools.
📦 What’s Inside the Small Business CFO Dashboard in Excel
This template includes 5 dedicated dashboard pages, each designed to give you deep insights into your small business finances:
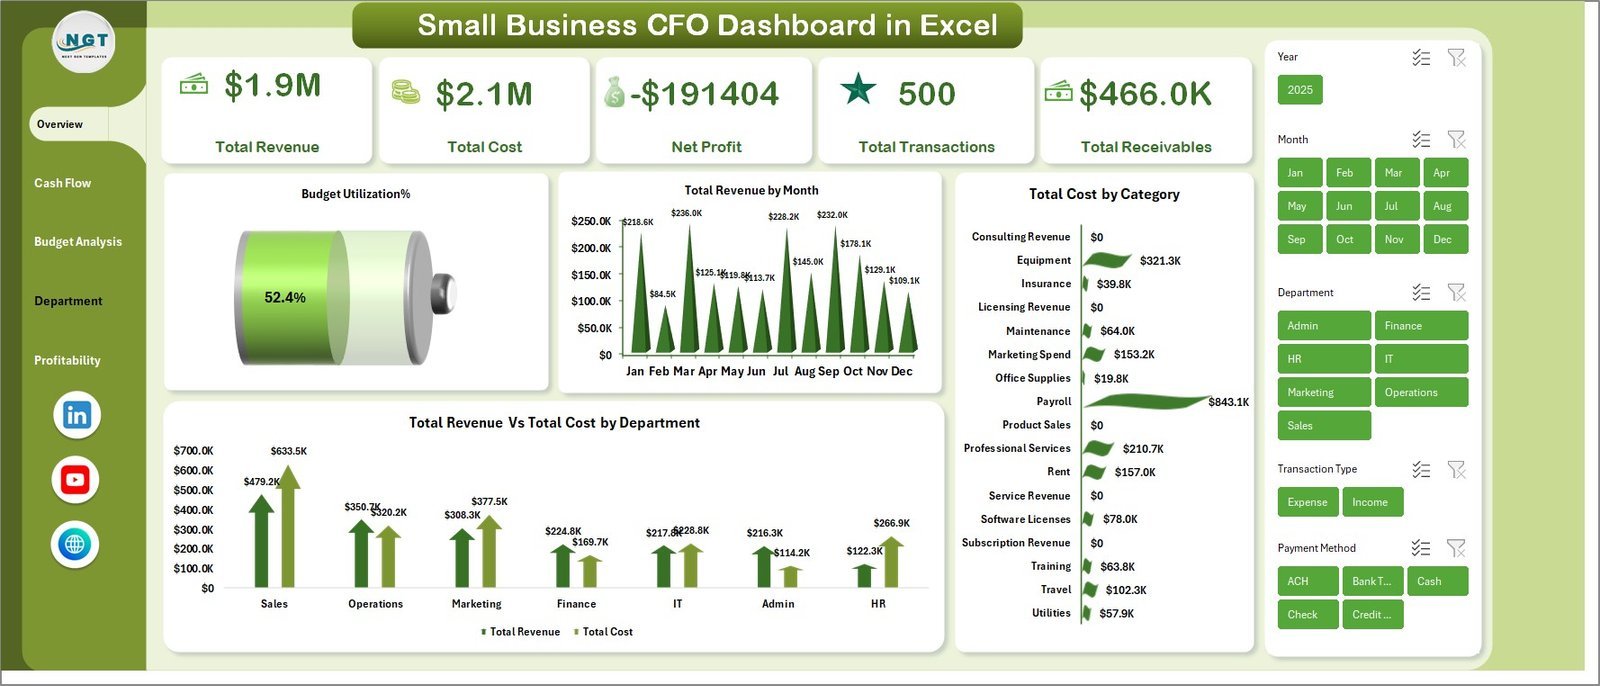
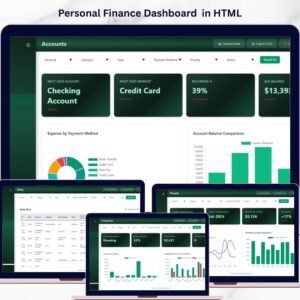
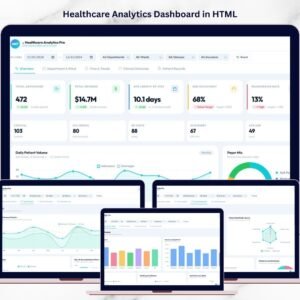
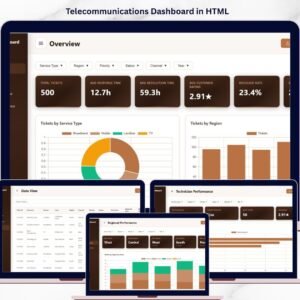
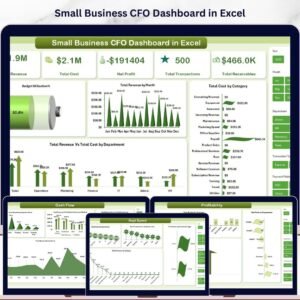
📊 Overview Page — The main dashboard view displays 5 high-level KPI cards: Total Revenue, Total Cost, Net Profit, Total Transactions, and Total Receivables. Below the cards, 4 interactive charts provide instant analysis: Budget Utilization by Percentage, Total Revenue by Month, Total Cost by Category, and Total Revenue Vs Total Cost by Department. Multiple slicers let you filter the entire dashboard by various dimensions quickly.
💰 Cash Flow Page — This page provides detailed cash flow analysis through 4 powerful charts: Total Revenue by Payment Status, Total Revenue Vs Total Cost by Payment Method, Total Receivables Vs Total Payables by Department, and Total Receivables by Month. Track every penny flowing in and out of your business.
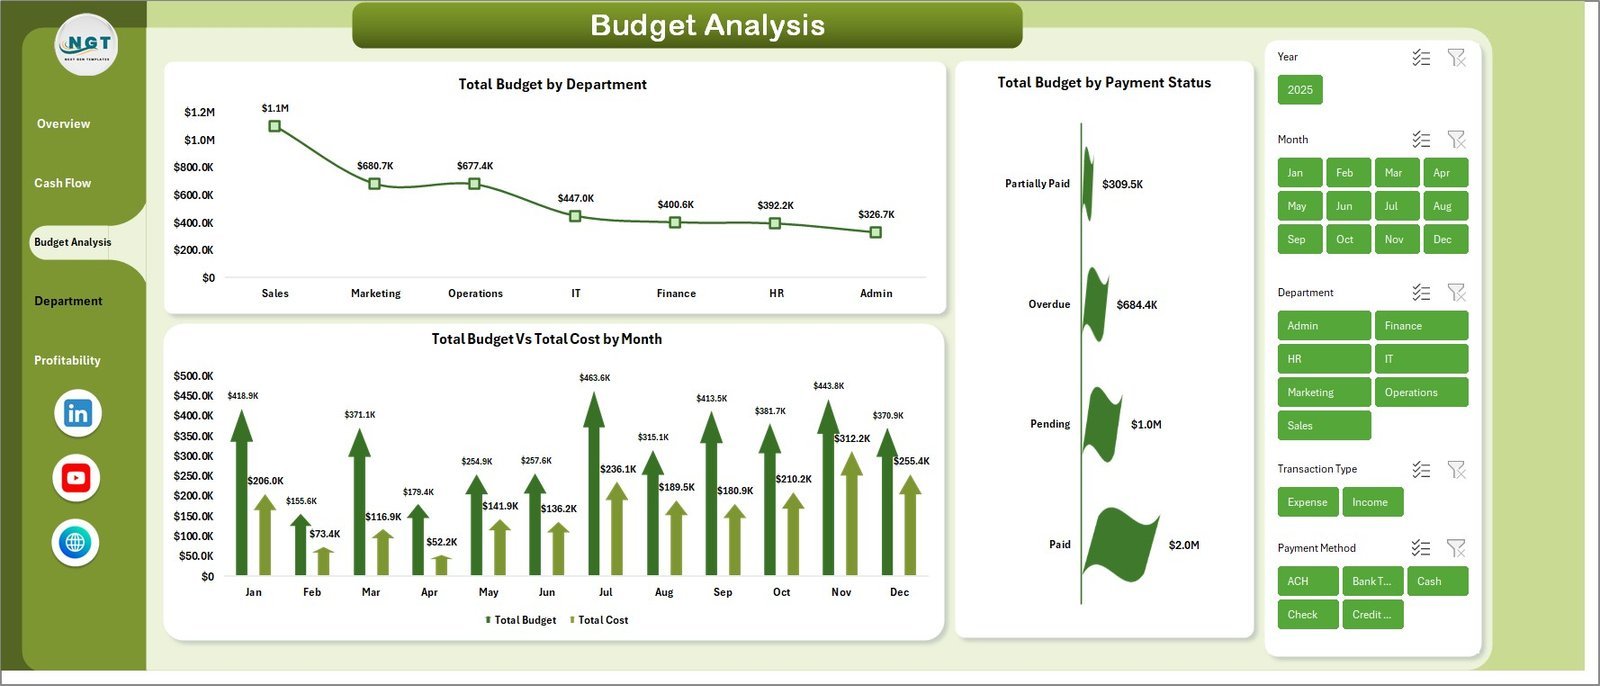
📋 Budget Analysis Page — Analyze your budgets in depth with 3 insightful charts: Total Budget by Department, Total Budget by Payment Status, and Total Budget Vs Total Cost by Month. Identify overspending and optimize allocation.
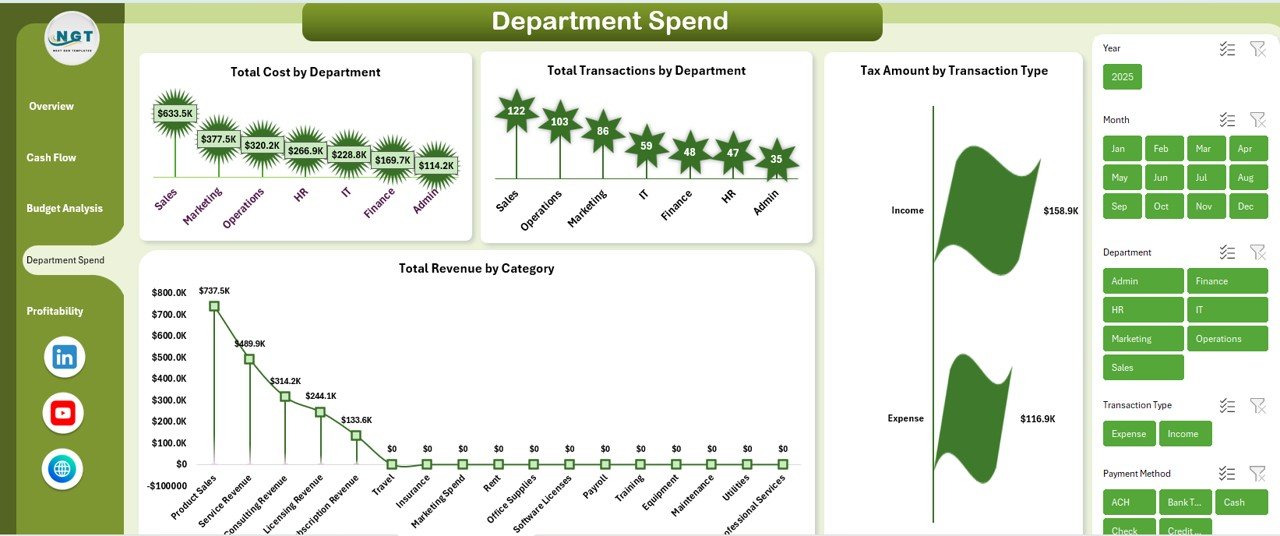
🏢 Department Spend Page — Break down spending across departments with 4 targeted charts: Total Cost by Department, Total Transactions by Department, Tax Amount by Transaction Type, and Total Revenue by Category. Pinpoint where your money is going at the departmental level.
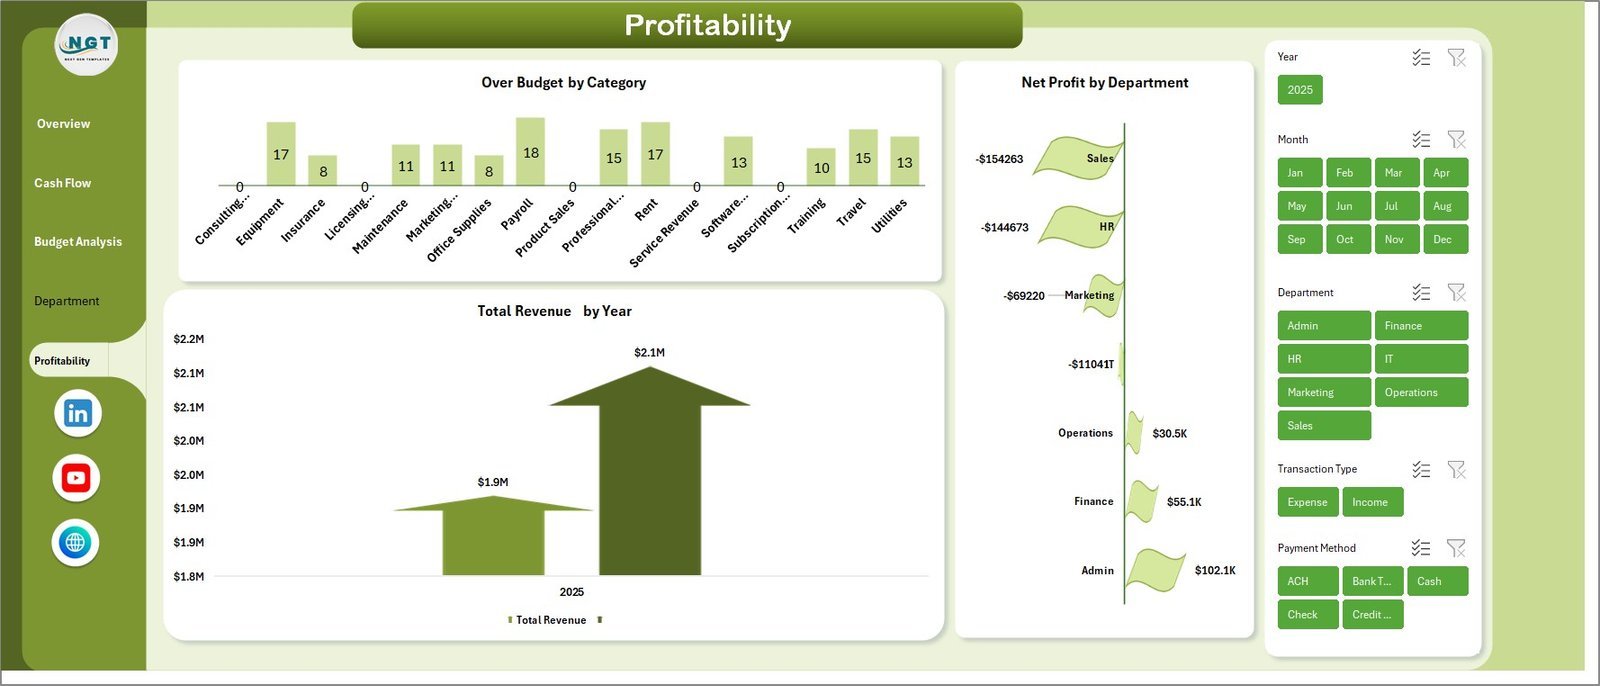
📈 Profitability Page — Evaluate your bottom line with 3 key charts: Over Budget by Category, Net Profit by Department, and Total Revenue by Year. Understand which departments and categories drive the most profit.
📝 Data Sheet — Add your business financial data in the structured format provided. All dashboard pages update dynamically based on the data you enter.
⚙️ Support Sheet — Contains multiple pivot tables that power the entire dashboard. After updating your data, go to the Data tab in the Excel Ribbon and click Refresh All. All pivots and charts will refresh automatically. You can keep this sheet hidden.
⚙️ How to Use the Small Business CFO Dashboard in Excel
1️⃣ Download and unzip the file on your computer.
2️⃣ Open the file and navigate to the Data Sheet tab.
3️⃣ Replace the sample data with your actual business financial data in the same format.
4️⃣ Go to the Data tab in the Ribbon and click Refresh All to update all pivot tables and charts.
5️⃣ Navigate through the 5 dashboard pages to explore your financial insights — use slicers and filters to drill down into specific areas.
👥 Who Can Benefit from This Small Business CFO Dashboard
🔹 Small Business Owners — Track overall financial health without hiring an expensive analyst
🔹 CFOs and Finance Managers — Get a bird’s-eye view of revenue, cost, cash flow, and profitability
🔹 Startup Founders — Monitor burn rate, department spending, and budget utilization
🔹 Accountants and Bookkeepers — Present clear financial summaries to clients and stakeholders
🔹 Business Consultants — Provide professional financial reporting to small business clients
🔹 Finance Students — Learn real-world financial analysis with a ready-to-use dashboard
❓ Frequently Asked Questions
What KPIs does the Small Business CFO Dashboard in Excel track?
The Small Business CFO Dashboard in Excel tracks 5 key performance indicators: Total Revenue, Total Cost, Net Profit, Total Transactions, and Total Receivables. It also provides in-depth analysis across cash flow, budget utilization, department spending, and profitability through 18 interactive charts spread across 5 dashboard pages.
Do I need advanced Excel skills to use this CFO dashboard?
No. Simply replace the sample data in the Data Sheet with your own financial data and click Refresh All in the Data tab. All charts, KPI cards, and pivot tables update automatically. No macros, formulas, or coding knowledge required.
Can I customize the Small Business CFO Dashboard for my specific industry?
Yes. The dashboard is designed to work with any small business financial data. You can add your own departments, categories, payment methods, and transaction types in the Data Sheet, and the dashboard will adapt dynamically to reflect your unique business structure.
What is the best Excel template for small business financial analysis?
The Small Business CFO Dashboard in Excel is one of the best templates for small business financial analysis. It covers 5 critical areas — overview, cash flow, budget analysis, department spend, and profitability — giving business owners and CFOs a complete financial picture in one file.
How do I track cash flow using this dashboard?
The dedicated Cash Flow page shows Total Revenue by Payment Status, Total Revenue Vs Total Cost by Payment Method, Total Receivables Vs Total Payables by Department, and Total Receivables by Month. These 4 charts give you complete visibility into money flowing in and out of your business.
🔗 Explore Related Templates
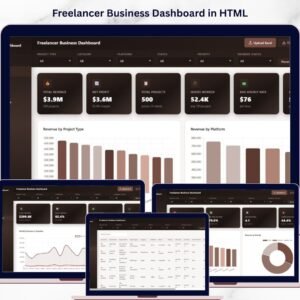
🔹 Freelancer Business Dashboard in Excel — Track freelance income, expenses, and client revenue in a clean Excel dashboard.
🔹 Subscription Business Dashboard in Excel — Analyze subscription revenue, churn, and recurring metrics for SaaS and membership businesses.
🔹 Finance & Accounting Command Center Bundle — Get 8 premium finance templates across Excel, Power BI, and Google Sheets at 46% savings.
📖 Click here to read the Detailed Blog Post about Small Business CFO Dashboard in Excel
Watch the step-by-step video tutorial:


Reviews
There are no reviews yet.