


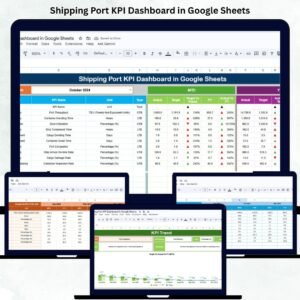
Efficient port management is the backbone of global trade. To keep operations smooth and profitable, port authorities need real-time visibility into vessel movements, cargo flow, and resource utilization. The Shipping Port KPI Dashboard in Google Sheets provides a ready-to-use, data-driven solution that helps you track, analyze, and improve overall port performance — all within a collaborative and interactive Google Sheets environment. ⚓📊
This dashboard centralizes critical port KPIs such as vessel turnaround time, cargo throughput, and berth utilization, giving decision-makers the insights they need to enhance operational efficiency, reduce downtime, and optimize logistics workflows.

🔑 Key Features of the Shipping Port KPI Dashboard in Google Sheets
📋 Dashboard Sheet Tab (Main Performance View)
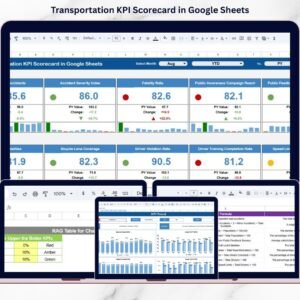
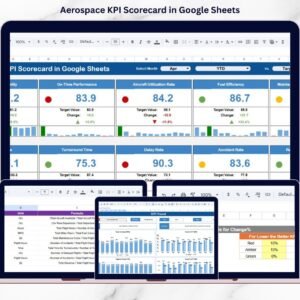
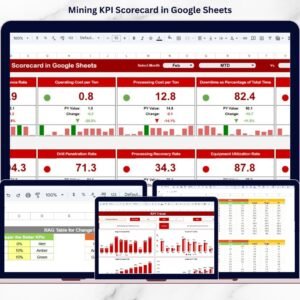
Get an instant snapshot of overall port performance with visual indicators and dynamic KPIs:
-
MTD (Month-to-Date) vs Target vs Previous Year: Evaluate short-term progress and track monthly changes.
-
YTD (Year-to-Date) vs Target vs Previous Year: Monitor annual cumulative performance.
-
Visual Arrows & Color Codes:
-
🟢 Green Arrow = Improvement
-
🔴 Red Arrow = Decline
-
🟡 Neutral/Stable = No major change
-
The dashboard automatically highlights trends, allowing port managers to quickly identify bottlenecks or underperforming areas.
📈 KPI Trend Sheet Tab
Dive deeper into individual KPI performance using interactive trend charts:
-
Select any KPI from a dropdown (Cell C3).
-
View historical data for multiple months.
-
Analyze patterns across time to understand performance behavior.
Each KPI displays its Group, Unit, Type (UTB/LTB), Formula, and Definition, ensuring clear understanding across teams.
🧾 Actual Number Sheet Tab
This tab holds actual operational data — MTD and YTD values.
-
Select the starting month (Cell E1).
-
Enter actual monthly figures for each KPI.
-
Data auto-updates across all visual dashboards.
📊 Target Sheet Tab
Define performance expectations by entering monthly and yearly targets.
This sheet enables variance analysis between Actual vs Target — empowering management to adjust goals dynamically.
📅 Previous Year Number Sheet Tab
Record previous year’s results to measure year-over-year growth or decline.
📘 KPI Definition Sheet Tab
Maintain a reference for all metrics with clearly defined details —
Group | KPI Name | Formula | Unit | Type (LTB/UTB).
This ensures data integrity and transparency across all teams.
📦 What’s Inside the Shipping Port KPI Dashboard
✅ Prebuilt Google Sheets File – Fully functional and ready to use
✅ Interactive Dashboard Page – Real-time KPI monitoring
✅ Automated Trend Charts – Compare monthly & yearly performance
✅ Color-Coded Indicators – Instant performance visualization
✅ Editable KPI Definition Sheet – Customize your own KPIs
✅ Targets vs Actual Comparison – Easy variance analysis
✅ Historical Performance Tracker – Year-over-year insights
✅ Cloud Collaboration – Multiple users can update in real time
Everything is plug-and-play — simply enter your port data and watch your dashboard come alive! 🚢💼
🧑💼 Who Can Benefit from This Dashboard
⚓ Port Authorities – Monitor overall port and terminal performance.
🚛 Logistics & Operations Managers – Optimize vessel turnaround and cargo handling.
📈 Executives & Analysts – Track trends and make data-driven decisions.
🏗️ Terminal Operators – Ensure efficient berth and equipment utilization.
This dashboard brings clarity, control, and collaboration to every level of port management.
🧪 How to Use the Shipping Port KPI Dashboard
1️⃣ Enter Actual Data: Update MTD & YTD numbers in the Actual Number Sheet.
2️⃣ Set Targets: Define monthly and yearly goals in the Target Sheet.
3️⃣ Track Trends: View KPI patterns in the Trend Sheet tab.
4️⃣ Analyze Performance: Compare current and previous year data.
5️⃣ Share Insights: Collaborate live with stakeholders or export as PDF reports.
💡 Pro Tip: Connect with Google Forms or APIs for automatic data imports from port systems!
🌟 Why Choose This Dashboard
-
Simplifies complex port data into actionable insights
-
Cloud-based collaboration for real-time performance tracking
-
Built-in comparison of MTD, YTD, and YoY data
-
Fully customizable KPI structure
-
Visual indicators make interpretation fast and intuitive
The Shipping Port KPI Dashboard in Google Sheets is your go-to solution for efficient, transparent, and scalable port performance management. 🌟


Reviews
There are no reviews yet.