The maritime Ship Chartering Dashboard is the backbone of global trade. Every day, ships transport millions of tons of cargo across international waters. However, managing ship chartering operations is complex because it involves multiple factors such as charter contracts, fuel expenses, cargo types, brokers, ports, and revenue performance.
Many shipping companies still rely on scattered spreadsheets and manual reports to track chartering activities. As a result, managers often struggle to monitor operational performance, analyze charter contracts, and evaluate revenue trends.
That is where the Ship Chartering Dashboard in Excel becomes extremely valuable.
This ready-to-use Excel dashboard converts complex chartering data into clear visual insights. Instead of analyzing multiple reports, managers can monitor charter contracts, fuel costs, revenue performance, and operational metrics through a centralized dashboard.
Because the dashboard uses interactive charts, KPI indicators, and slicers, users can quickly identify operational trends and make data-driven decisions.
If you want a structured and intelligent way to manage ship chartering operations, this Excel dashboard provides the perfect solution.
🚢 Key Feature of Ship Chartering Dashboard in Excel
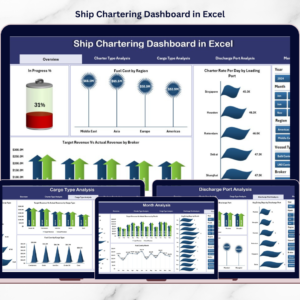
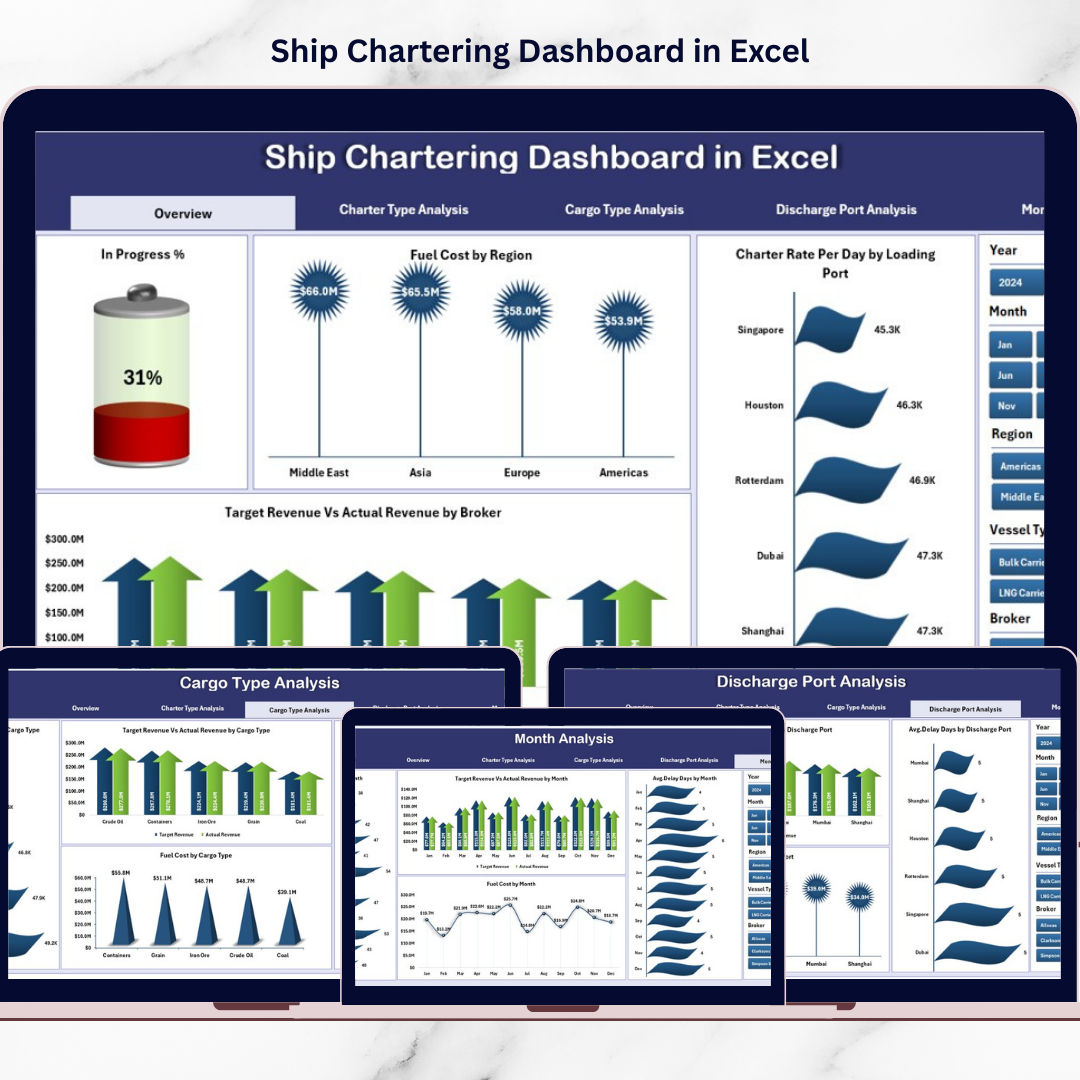
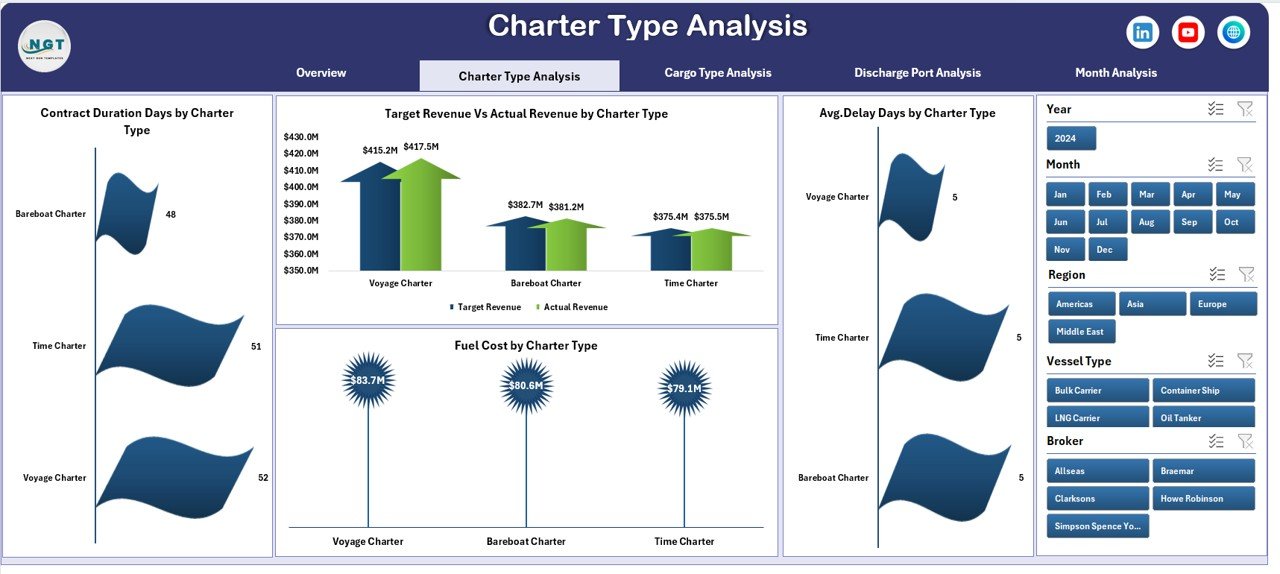
This powerful Excel dashboard includes five interactive analytical pages designed to monitor chartering performance from multiple perspectives.
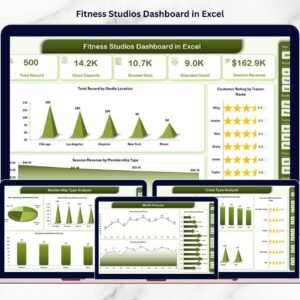
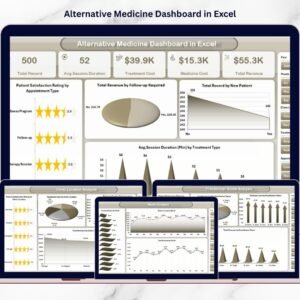
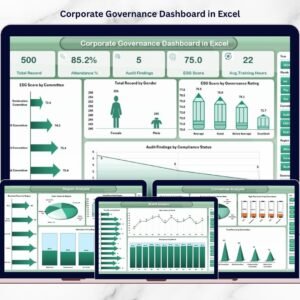
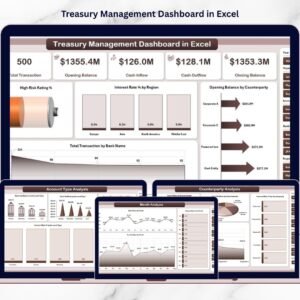
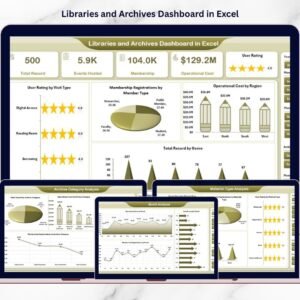
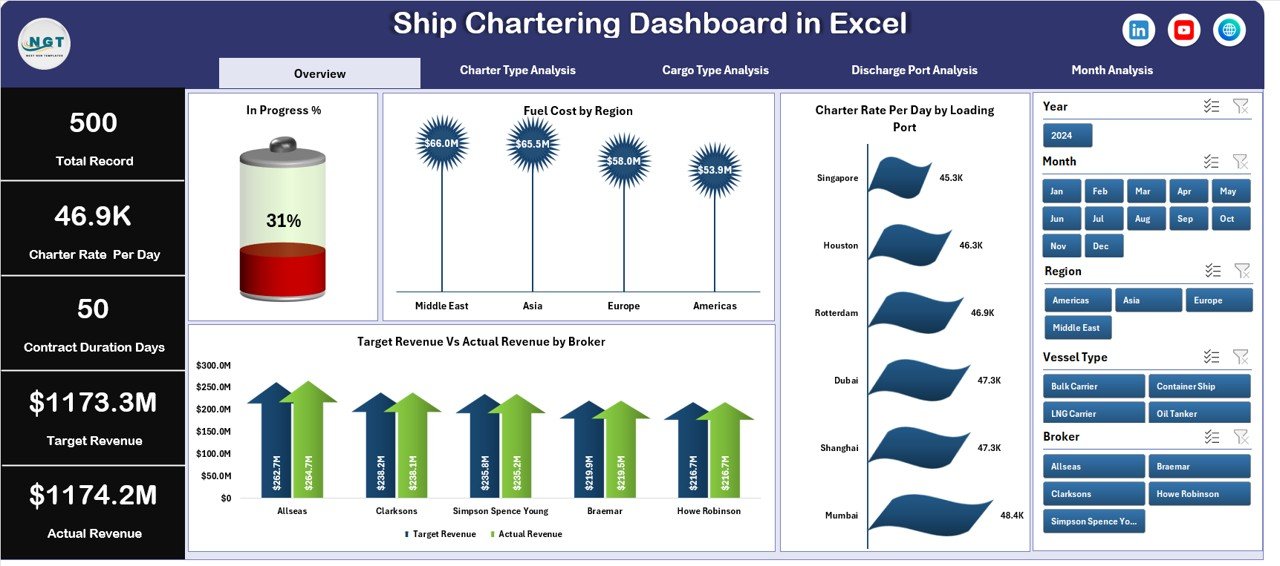
📊 Overview Page Dashboard – Provides a complete snapshot of chartering operations using KPI cards and charts.
🎯 Interactive Data Slicers – Filter dashboard insights by charter type, cargo type, port, broker, and month.
⛽ Fuel Cost Monitoring – Track fuel consumption across regions and operations.
📈 Charter Rate Analysis – Monitor charter rate per day by loading port.
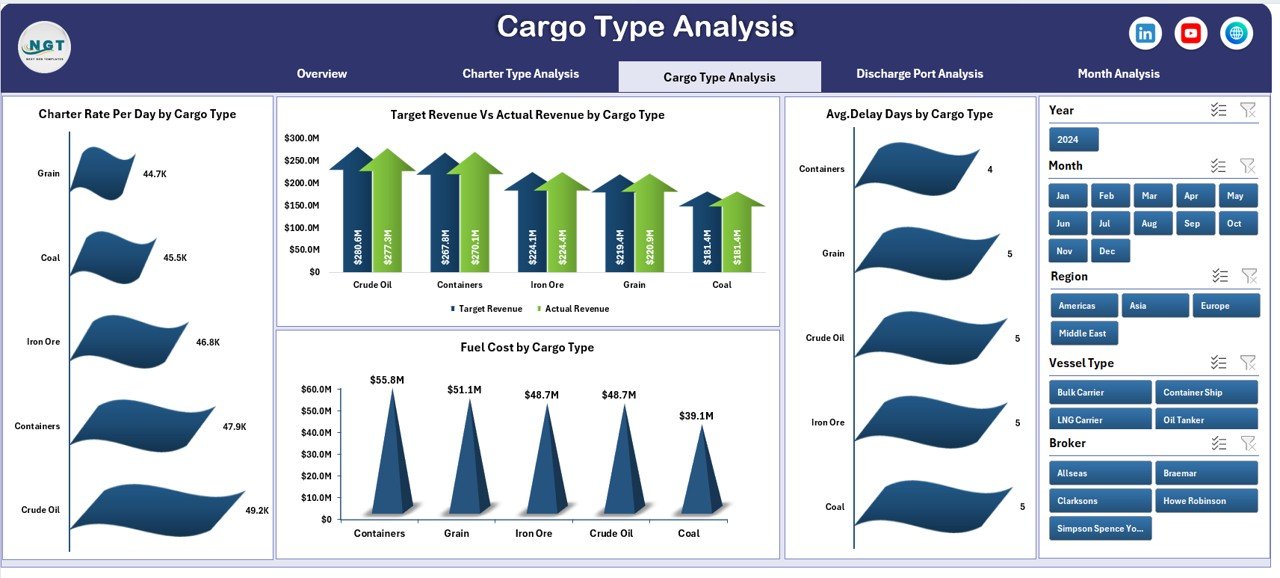
📦 Cargo Performance Insights – Analyze operational performance by cargo type.
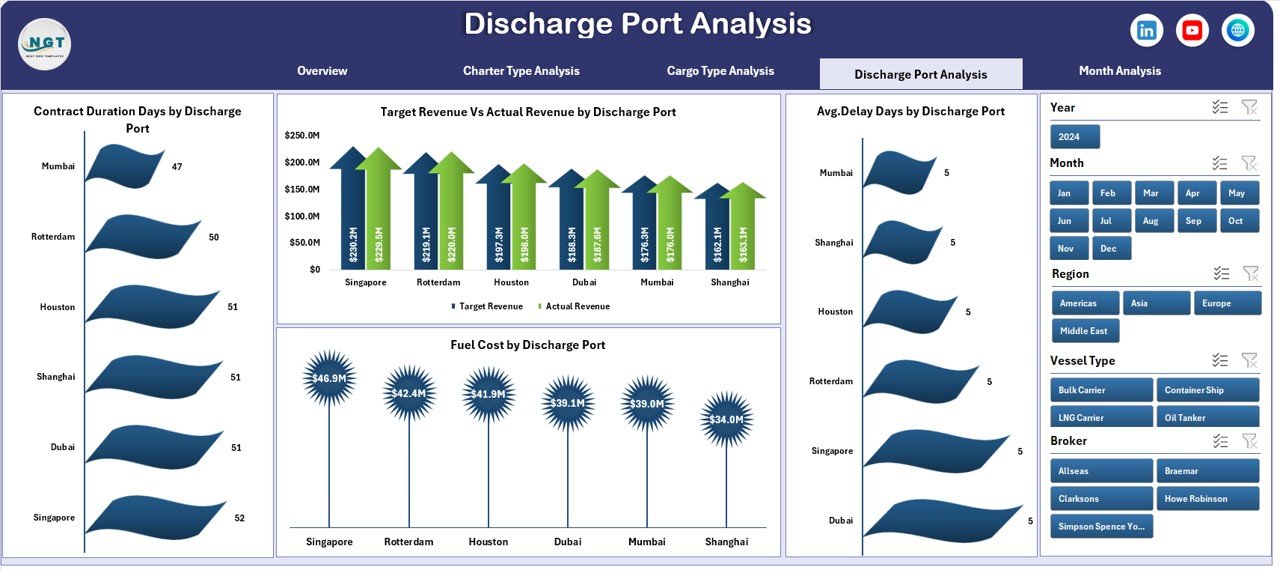
⚓ Port Performance Monitoring – Evaluate charter performance across discharge ports.
📊 Revenue Performance Tracking – Compare target revenue with actual revenue.
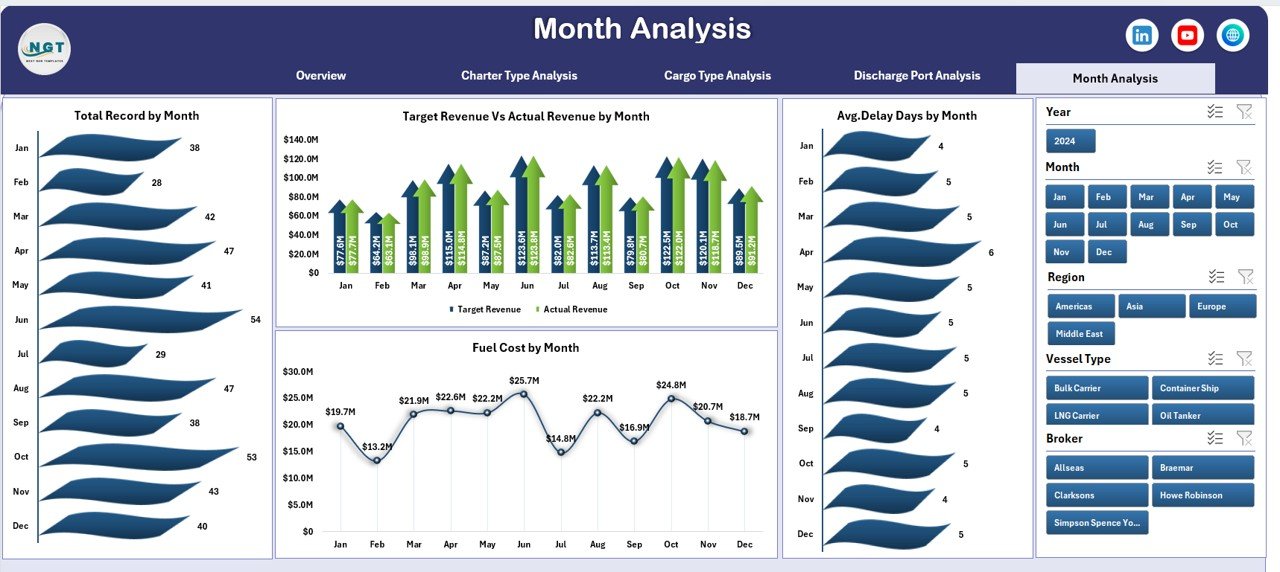
📅 Monthly Trend Analysis – Identify seasonal changes in charter operations.
Because the dashboard uses Pivot Tables and dynamic charts, refreshing the data automatically updates all visual insights.
📦 What’s Inside the Ship Chartering Dashboard in Excel
The template includes multiple analytical components designed to track chartering operations effectively.
Inside the file, you get:
✅ Overview Page – Summary of key chartering KPIs
✅ Charter Type Analysis Page – Performance insights by charter contract type
✅ Cargo Type Analysis Page – Operational analysis by cargo categories
✅ Discharge Port Analysis Page – Port performance monitoring
✅ Month Analysis Page – Time-based chartering performance trends
✅ Data Sheet – Stores raw chartering operational data
✅ Support Sheet – Stores dropdown lists and reference values
The Data Sheet typically includes fields such as:
Charter ID
Vessel Name
Charter Type
Cargo Type
Loading Port
Discharge Port
Broker Name
Fuel Cost
Charter Rate
Contract Duration
Delay Days
Revenue
Month
Because the data structure is flexible, organizations can customize the dashboard according to their operational requirements.
⚙️ How to Use the Ship Chartering Dashboard in Excel
Using this dashboard is simple and efficient.
1️⃣ Enter chartering data into the Data Sheet.
2️⃣ Ensure the data format remains consistent.
3️⃣ Refresh Pivot Tables and charts.
4️⃣ Use slicers to filter by charter type, cargo type, broker, port, or month.
5️⃣ Analyze KPIs and operational trends.
Within seconds, the dashboard provides a complete overview of chartering operations.
No advanced Excel skills are required.
👥 Who Can Benefit from This Ship Chartering Dashboard in Excel
This dashboard is designed for professionals working in maritime logistics and shipping operations.
It is especially useful for:
🚢 Shipping Companies
⚓ Vessel Operators
📦 Maritime Logistics Firms
📊 Charter Brokers
📈 Shipping Analysts
🚚 Global Trade Operations Teams
Because the dashboard simplifies complex operational data, both technical teams and executives can easily analyze performance insights.
💡 Why This Dashboard Improves Chartering Operations
✔ Centralized monitoring of charter operations
✔ Faster identification of operational delays
✔ Clear fuel cost analysis
✔ Better revenue performance monitoring
✔ Improved cargo and port performance insights
✔ Data-driven chartering strategies
✔ Enhanced operational efficiency
✔ Easy customization and scalability
Instead of spending hours analyzing scattered reports, shipping companies gain instant insights into operational performance.
This dashboard transforms chartering data into actionable intelligence that supports smarter maritime operations.
### Click here to read the Detailed blog post
Visit our YouTube channel to learn step-by-step video tutorials
Youtube.com/@PKAnExcelExpert