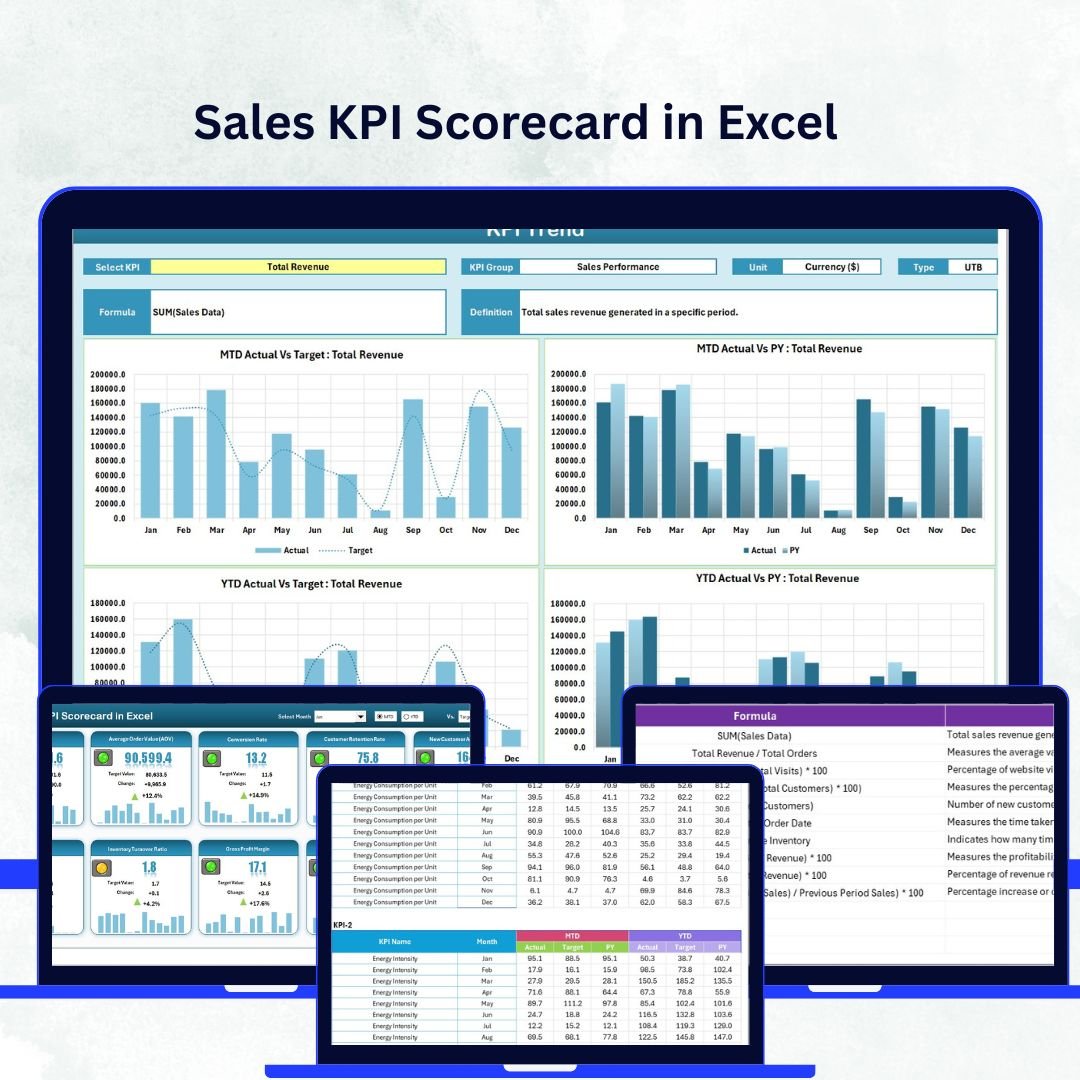
In today’s fast-paced business world, understanding how your sales team performs is no longer optional — it’s essential. The Sales KPI Scorecard in Excel gives you a complete, ready-to-use performance management system that helps you track, compare, and visualize your key sales metrics in one place.
This Excel-based scorecard template is perfect for managers, analysts, and business owners who want to turn raw sales data into actionable insights. Whether you’re reviewing Month-to-Date (MTD), Year-to-Date (YTD), or quarterly trends, this tool empowers you to identify what’s working, what’s not, and where to focus next.
💼 Key Features of Sales KPI Scorecard in Excel
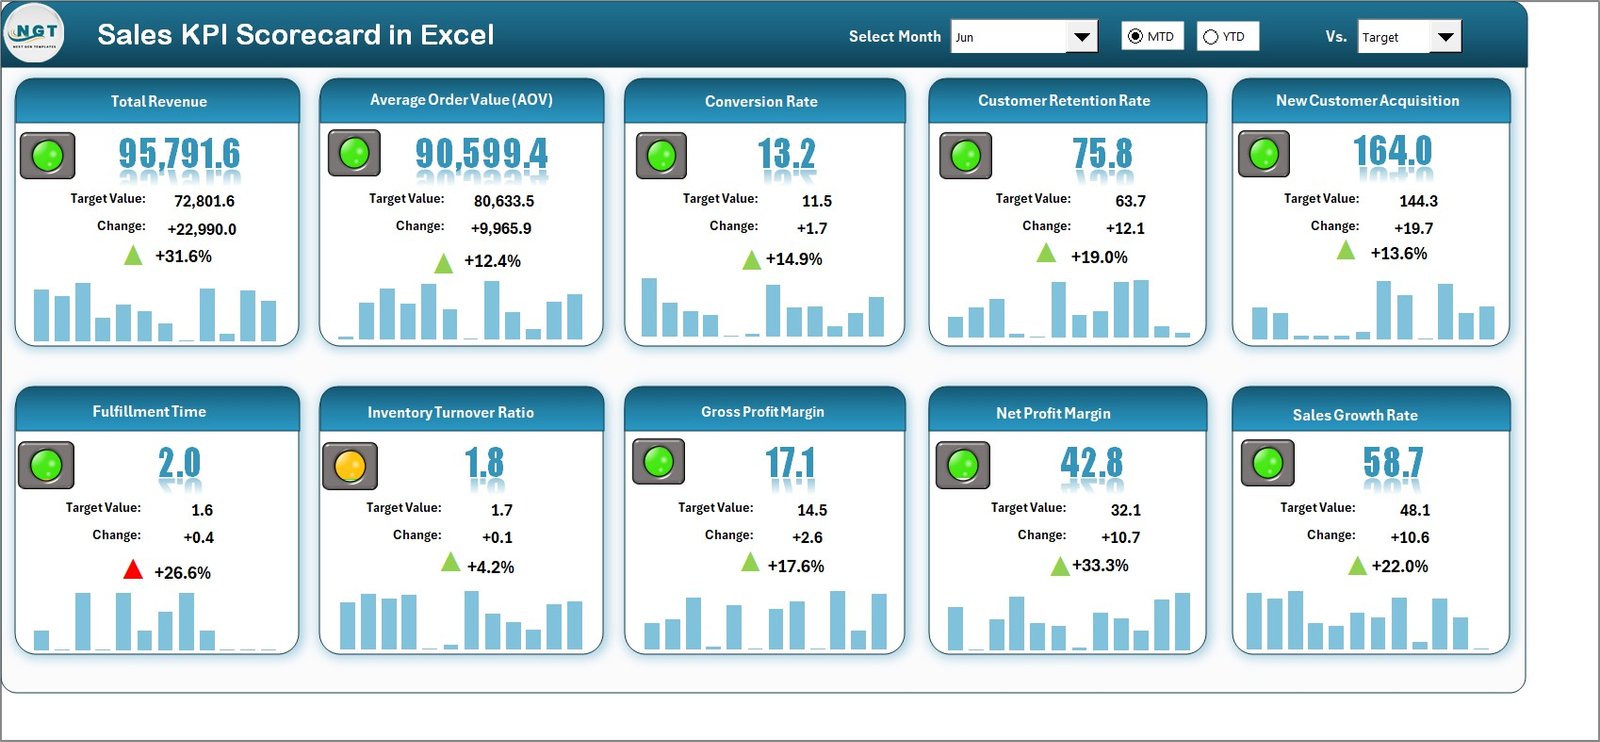
✨ Interactive Scorecard Dashboard – A powerful, user-friendly interface lets you switch between MTD and YTD views with dropdowns for instant insights.
📊 Actual vs Target Analysis – Compare your team’s performance against monthly and yearly goals to stay aligned with business objectives.
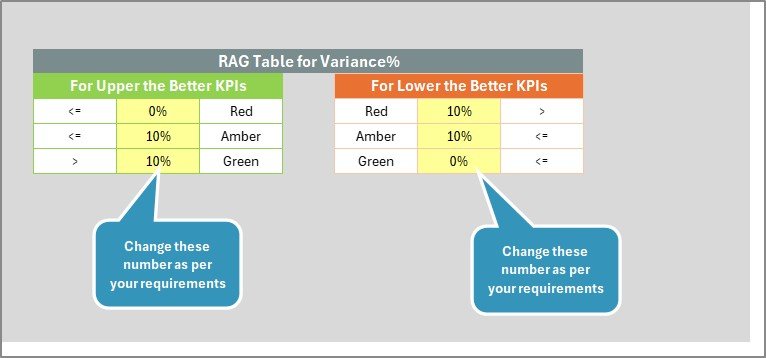
🟢 Visual Performance Indicators – Conditional formatting highlights achievements in green and underperformance in red, helping you spot trends instantly.
📈 10 KPIs in One View – Get a compact yet comprehensive view of your most important metrics for quick reviews.
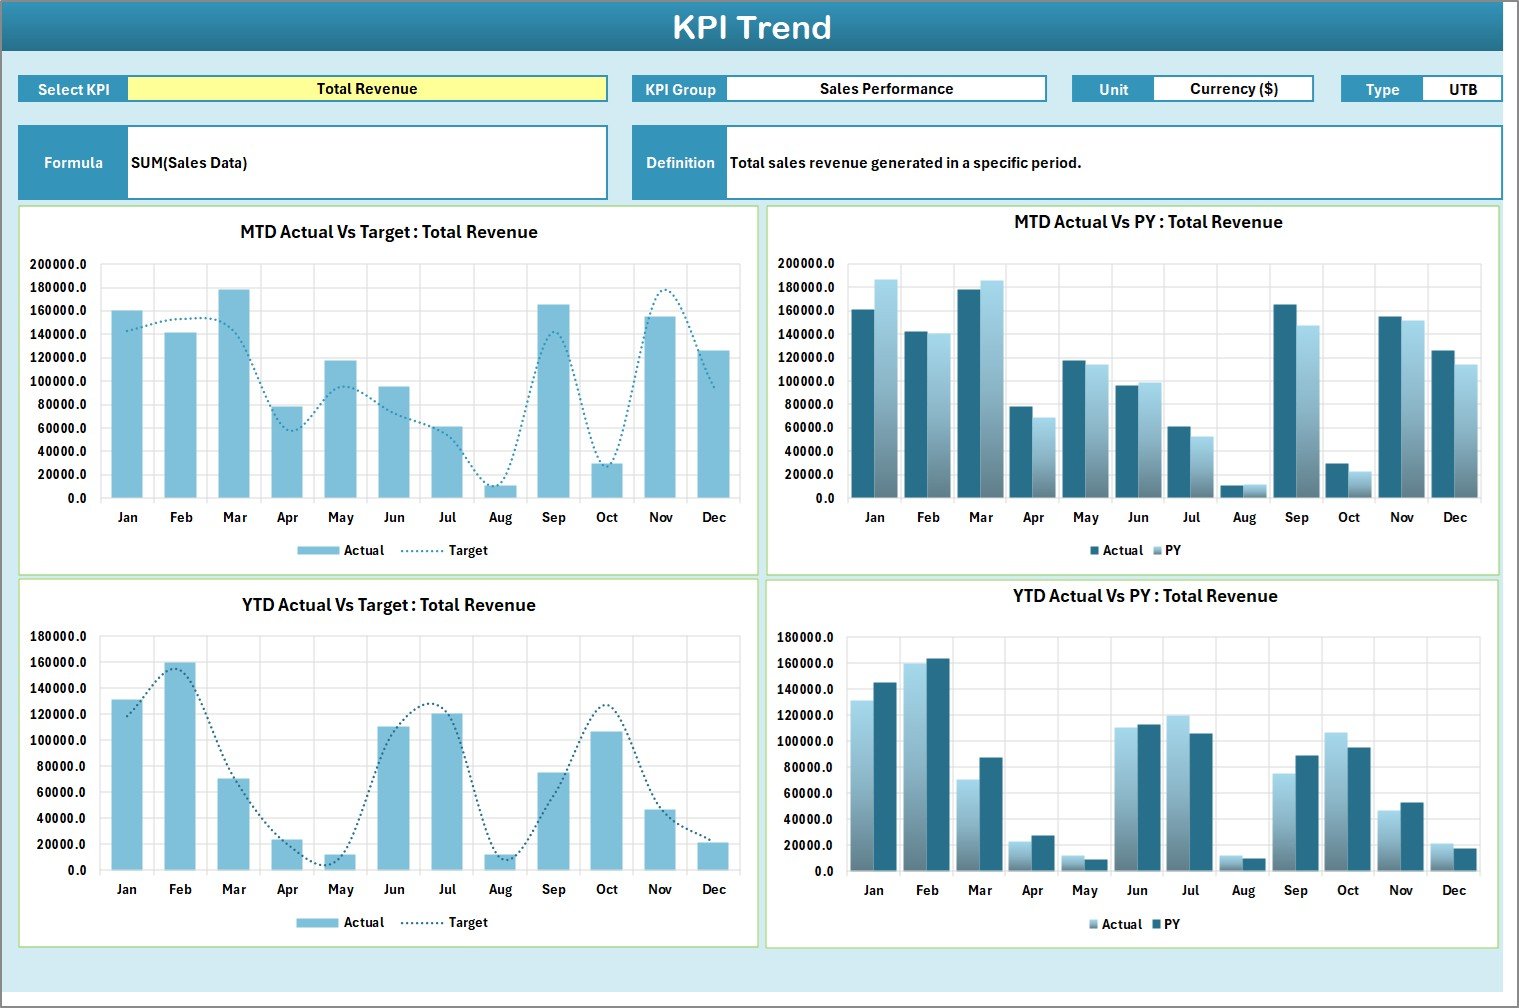
🔍 KPI Trend Analysis – Visualize how each KPI evolves over time and identify patterns that drive or hinder performance.
⚙️ Automated Updates – Once you input new data, all charts and metrics refresh automatically, reducing manual effort.
🧮 Customizable Structure – Add or modify KPIs easily to match your sales objectives or departmental needs.
💰 Cost-Effective Solution – No need for expensive analytics software; Excel provides everything you need for effective sales reporting.
📂 What’s Inside the Sales KPI Scorecard in Excel
This template includes four professionally designed worksheet tabs, each serving a unique purpose:
1️⃣ Scorecard Sheet – The main dashboard showcasing all 10 KPIs with dropdown menus for MTD or YTD selection and instant actual vs target comparison.
2️⃣ KPI Trend Sheet – A dynamic page where you can select any KPI from the dropdown and analyze trends, deviations, and long-term patterns.
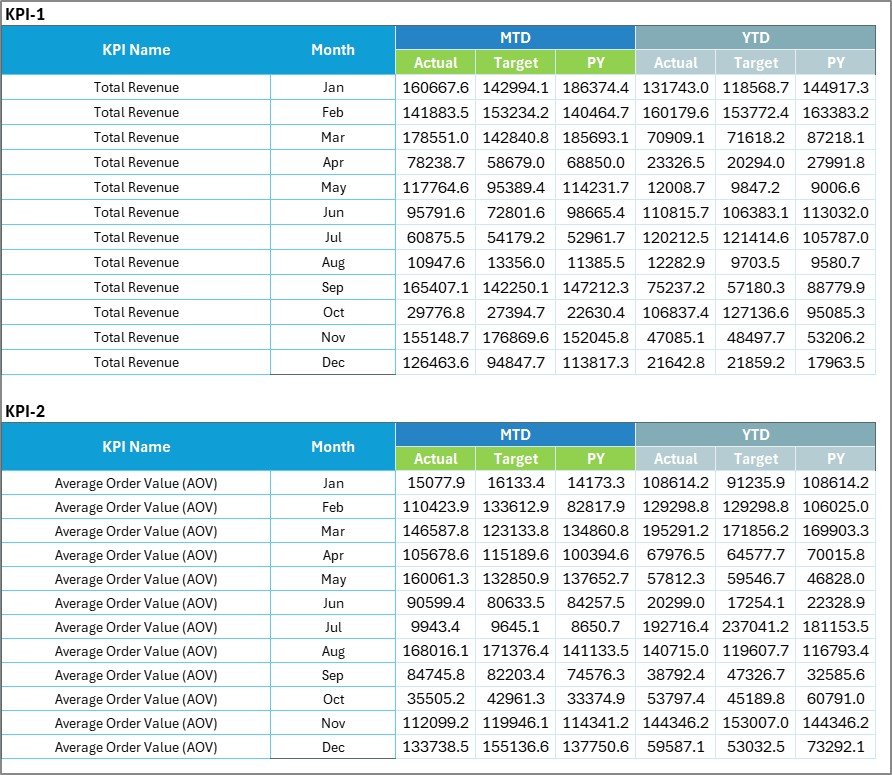
3️⃣ Input Data Sheet – The data engine of your scorecard where Actual, Target, and Previous Year (PY) values are recorded. It ensures every report stays current.
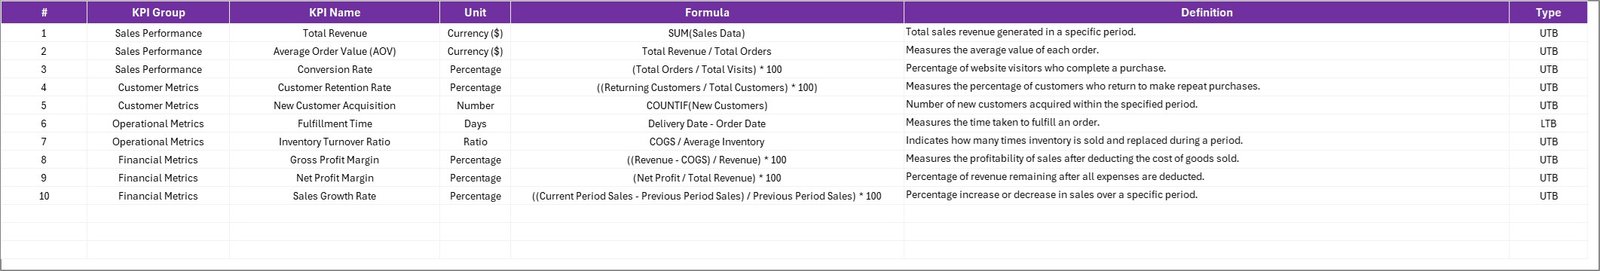
4️⃣ KPI Definition Sheet – A reference section containing KPI names, units, formulas, definitions, and type (UTB/LTB), ensuring consistency and clarity across reports.
Together, these sheets form a powerful ecosystem that provides clarity, structure, and transparency for all sales tracking activities.
🧭 How to Use the Sales KPI Scorecard in Excel
✅ Step 1: Enter your monthly data (Actual, Target, and PY) into the Input Data sheet.
✅ Step 2: Review the Scorecard Dashboard to see real-time KPI updates.
✅ Step 3: Use dropdown filters to switch between MTD and YTD performance.
✅ Step 4: Analyze KPI trends in the Trend sheet to spot growth opportunities.
✅ Step 5: Refer to the Definition sheet to ensure every KPI is standardized and easy to interpret.
✅ Step 6: Present insights during meetings with visual indicators and charts that speak for themselves.
This plug-and-play Excel tool requires no advanced skills — just input your data and let the template do the rest!
👥 Who Can Benefit from This Sales KPI Scorecard in Excel
💼 Sales Managers – Gain an instant overview of performance metrics to drive team accountability and growth.
📊 Business Analysts – Use data visualization tools to transform raw numbers into actionable insights.
🏢 Executives & Decision-Makers – Monitor company-wide sales health at a glance for smarter strategic planning.
💻 Small Business Owners – Track revenue, conversion rates, and growth without investing in complex tools.
🎯 Sales Teams – Stay motivated with transparent goals, color-coded feedback, and clear performance indicators.
📈 Consultants & Trainers – Showcase real-time results during workshops or client reviews with ready-to-present visuals.
💡 Why Choose This Template?
Because it’s simple, effective, and 100% Excel-based — designed to help you make informed decisions, improve efficiency, and achieve sales excellence without technical complexity.


Reviews
There are no reviews yet.