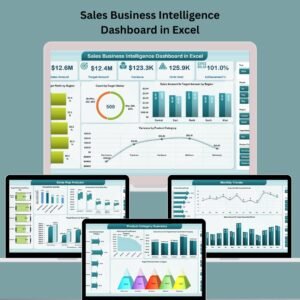
Are you drowning in scattered sales reports and struggling to make sense of it all? Say goodbye to disjointed data and hello to clarity with the Sales Business Intelligence Dashboard in Excel – your ultimate solution for visualizing, tracking, and analyzing your sales performance across regions, reps, products, and months – all from a single, dynamic dashboard! 💼📈
Built for businesses of all sizes, this ready-to-use Excel template combines the power of business intelligence with the familiarity of Excel, making it easy for you and your team to unlock actionable insights. Whether you’re a sales manager, executive, or entrepreneur, this tool will help you track KPIs, identify trends, and make data-driven decisions confidently.
🧩 What’s Inside This Powerful Dashboard?
Our Excel dashboard comes packed with 7 essential worksheet tabs designed to give you a complete picture of your sales operation:
🟦 1. Overview Page:

Get a high-level summary of your overall sales performance with:
-
🎯 Key metric cards (Total Sales, Target, Achievement %)
-
📊 Visual charts like Sales Met % by Region, Target Status Count, and Sales vs Target by Product
🟩 2. Region Analysis:
Drill down into regional performance with:
-
Achievement % by Region
-
Variance % by Region
-
Units Sold per Region
🟨 3. Sales Rep Analysis:
Evaluate individual performance with:
-
Target Met % by Top 5 Reps
-
Variance % by Rep
-
Sales Target Allocation per Rep
🟧 4. Product Category Summary:
Understand which categories drive success with:
-
Units Sold by Category
-
Target vs Actual Analysis
-
Achievement % by Product Category
🟥 5. Monthly Trends:
Track how your sales progress throughout the year with:
-
Monthly Sales Trends
-
Target Missed Counts by Month
-
Monthly Sales vs Target comparisons
📋 6. Data Sheet:
Input your raw sales data easily. Once updated, the dashboard refreshes automatically—no coding required!
🔧 7. Support Sheet:
Manage dropdown lists, lookup values, and maintain control of all reference data effortlessly.
🚀 Why You Need This Dashboard
✅ Instant Insights: Get the information you need to make decisions on the fly.
✅ Fully Customizable: Add your own KPIs, charts, or metrics with ease.
✅ Data Accuracy: Avoid manual errors with automated calculations and visuals.
✅ User-Friendly: Designed for non-techies and Excel pros alike.
✅ Time-Saving: Consolidates all sales insights into one sleek report.
💡 Best Practices to Maximize Your Dashboard
-
📆 Keep Your Data Fresh: Update the data sheet regularly for real-time insights.
-
🧠 Review Monthly: Use the trends tab to understand seasonality and performance dips.
-
👥 Train Your Team: Make sure your sales reps understand how to read and act on dashboard insights.
-
🛠️ Use for Forecasting: Historical variance can help inform future targets and strategy.
🙋♂️ Frequently Asked Questions
Q: Can I customize the dashboard?
A: Absolutely! Change charts, add data fields, or restructure visuals as per your business model.
Q: Do I need coding skills to use this?
A: Not at all. This dashboard works entirely in Excel with built-in logic and visuals.
Q: What if my data changes every month?
A: No worries—just paste your updated data in the Data Sheet, and all visuals will auto-refresh.
🎁 Bonus: Includes a YouTube walkthrough to guide you step-by-step!
🔗 YouTube.com/@PKAnExcelExpert
🔗 Click here to read the Detailed blog post








Reviews
There are no reviews yet.