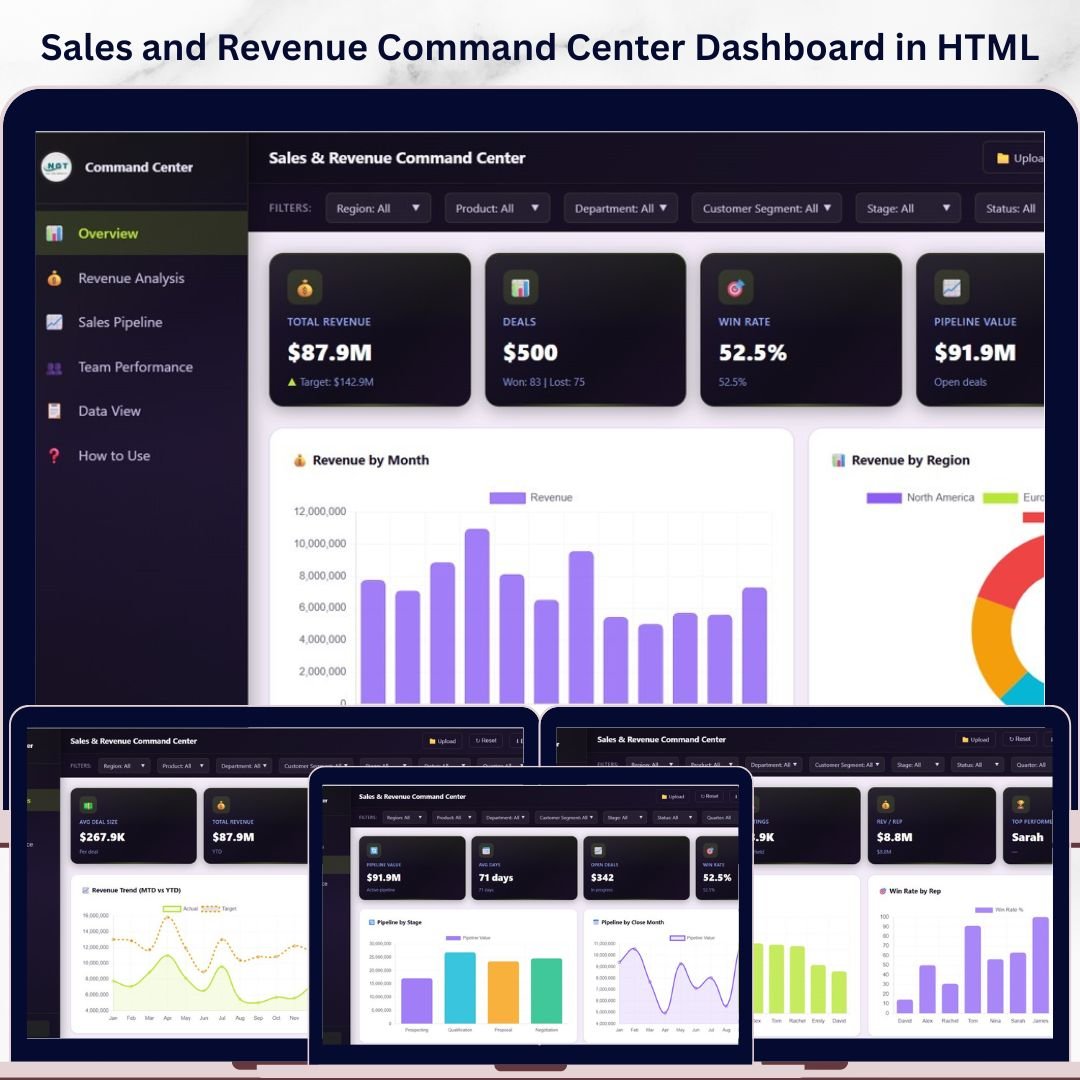


🔑 Key Features of Sales and Revenue Command Center Dashboard in HTML
Sales and Revenue Command Center Dashboard in HTML is a powerful, browser-based analytics template designed for sales directors, revenue operations managers, VP of sales, and business leaders who want to monitor total revenue, deal pipelines, win rates, team performance, and revenue trends from one centralized interactive dashboard. This template includes 5 interactive dashboard pages covering Overview, Revenue Analysis, Sales Pipeline, Team Performance, and a detailed Data View — making it one of the most comprehensive HTML Dashboard Templates available for sales and revenue management.
Whether you are managing a startup sales team or overseeing enterprise revenue operations, this dashboard transforms raw sales data into actionable visual insights without any software installation 🚀. Simply open the HTML file in any modern browser and start tracking your sales performance instantly. If you have been looking for a ready-to-use, interactive way to analyze sales pipeline health, revenue trends, and team quotas, the Sales and Revenue Command Center Dashboard in HTML is the ideal solution. Also explore our CRM Dashboard in HTML and SaaS Metrics Dashboard in HTML for complementary analytics.
📦 What’s Inside the Sales and Revenue Command Center Dashboard in HTML
This template includes 5 fully interactive pages that provide comprehensive coverage of sales and revenue analytics:
📊 Overview Page — The main landing page features 5 high-level KPI cards showing Total Revenue, Total Deals, Win Rate, Pipeline Value, and Attainment. Below the cards, interactive charts display Revenue by Month tracking monthly revenue trends, Revenue by Region comparing performance across geographic areas, Target vs Actual by Department measuring quota attainment per team, and Deal Status Distribution revealing how deals are spread across stages. Multiple slicers allow you to filter the entire dashboard for quick, focused analysis.
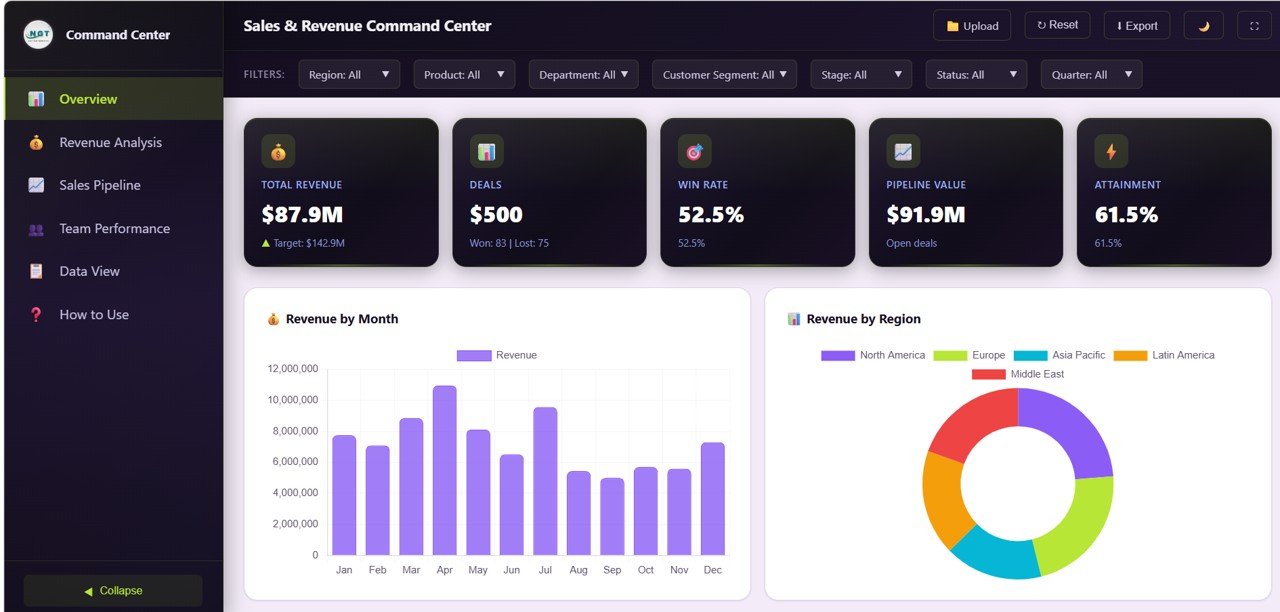
Overview
📈 Revenue Analysis — This page dives deep into revenue streams with charts showing Revenue Trend MTD vs YTD comparing month-to-date against year-to-date performance, Revenue by Product Line breaking down income across product categories, Average Deal Size by Quarter tracking deal value trends over time, and Revenue by Customer Segment identifying which customer groups drive the most revenue.
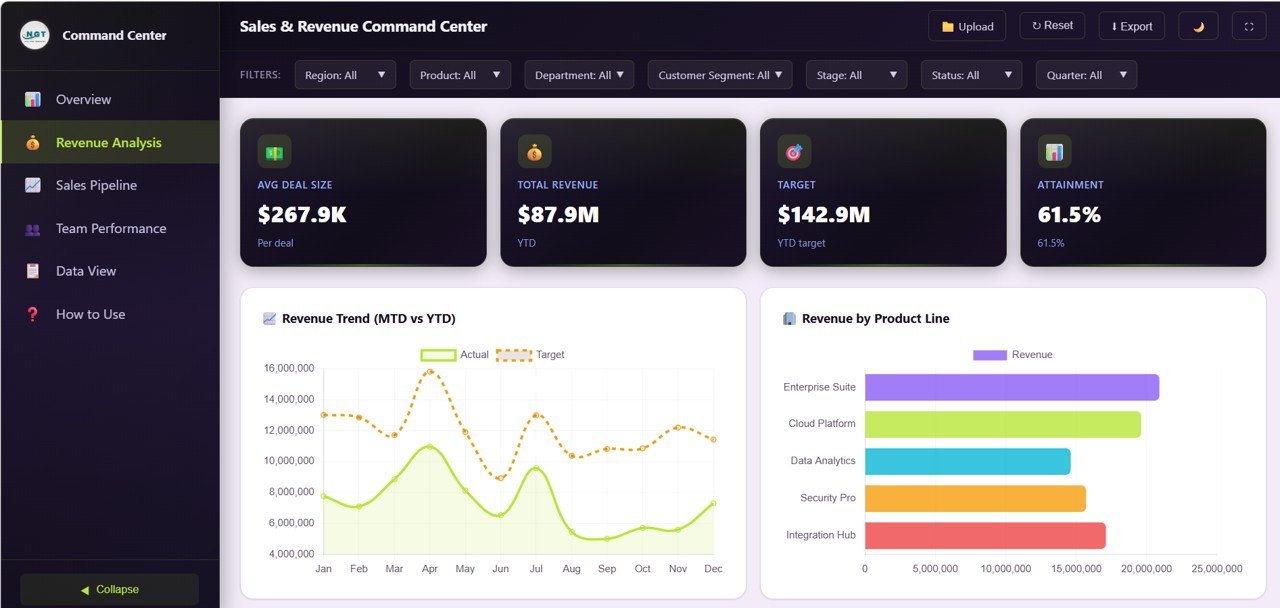
Revenue Analysis
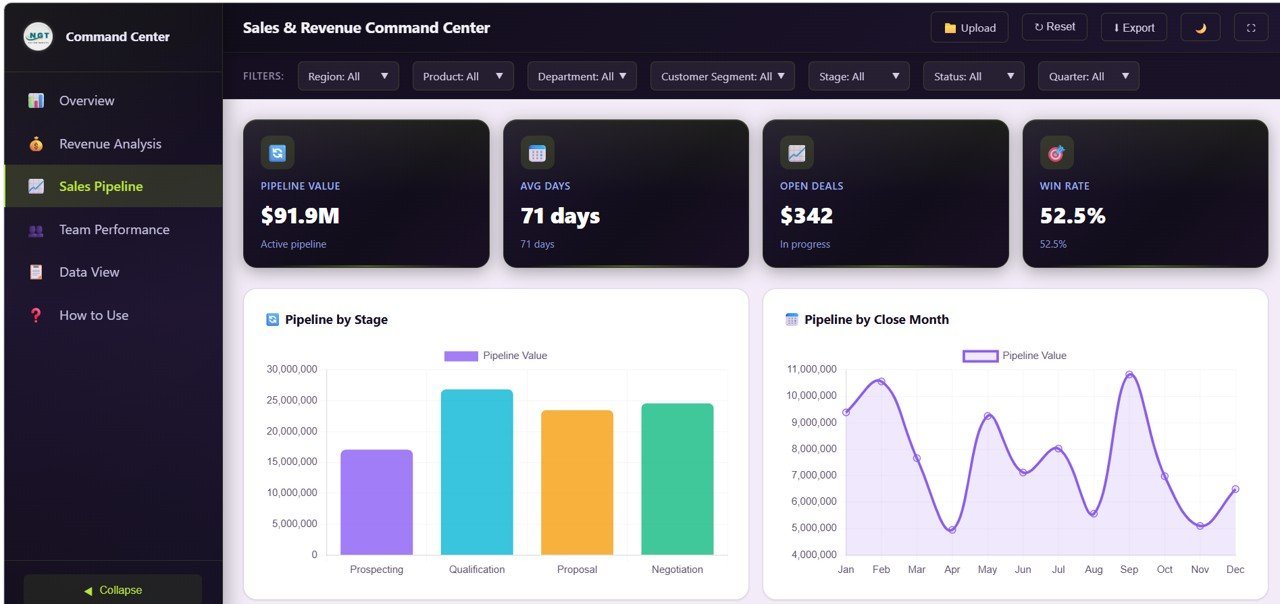
🎯 Sales Pipeline — Monitor your pipeline health with Pipeline by Stage showing how deals flow through the sales funnel, Pipeline by Close Month projecting expected revenue by closing period, and Top Deals by Value highlighting your highest-value opportunities that deserve focused attention.

Sales Pipeline
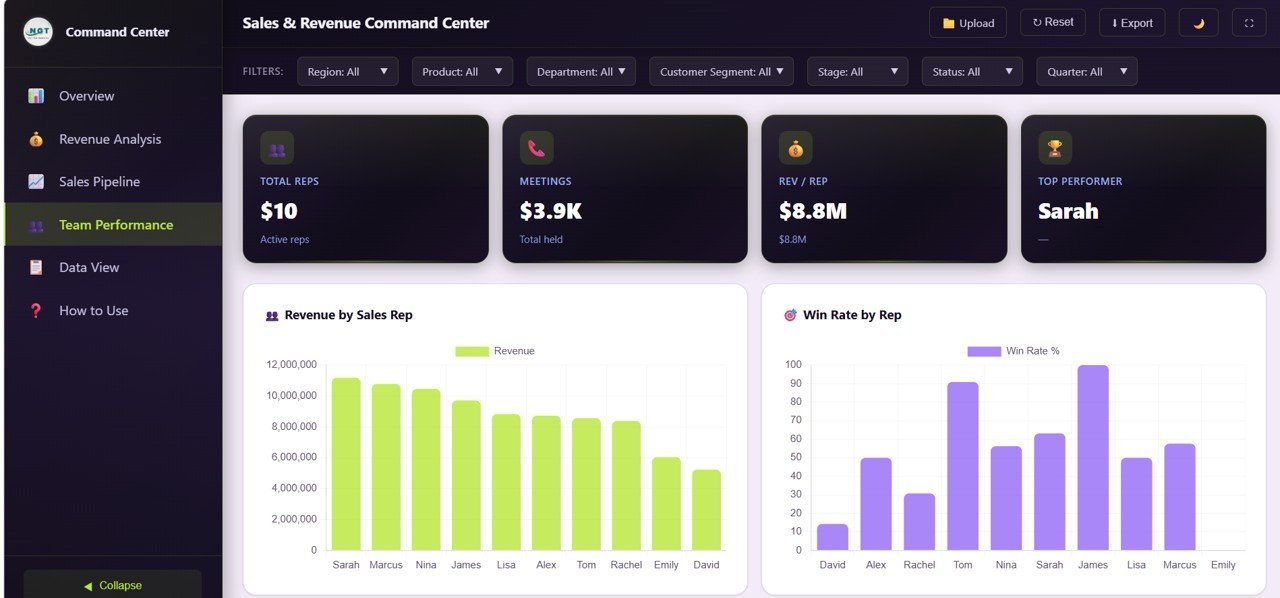
👥 Team Performance — Evaluate your sales team with Revenue by Sales Rep comparing individual contribution to overall revenue, Win Rate by Rep measuring closing effectiveness across team members, and Department Ranking showing which departments are hitting their targets and which need support.

Team Performance
📋 Data View — The detailed data table page lets you browse all records with search, sort, and pagination features. You can also export the filtered data to CSV for further analysis in Excel or other tools.
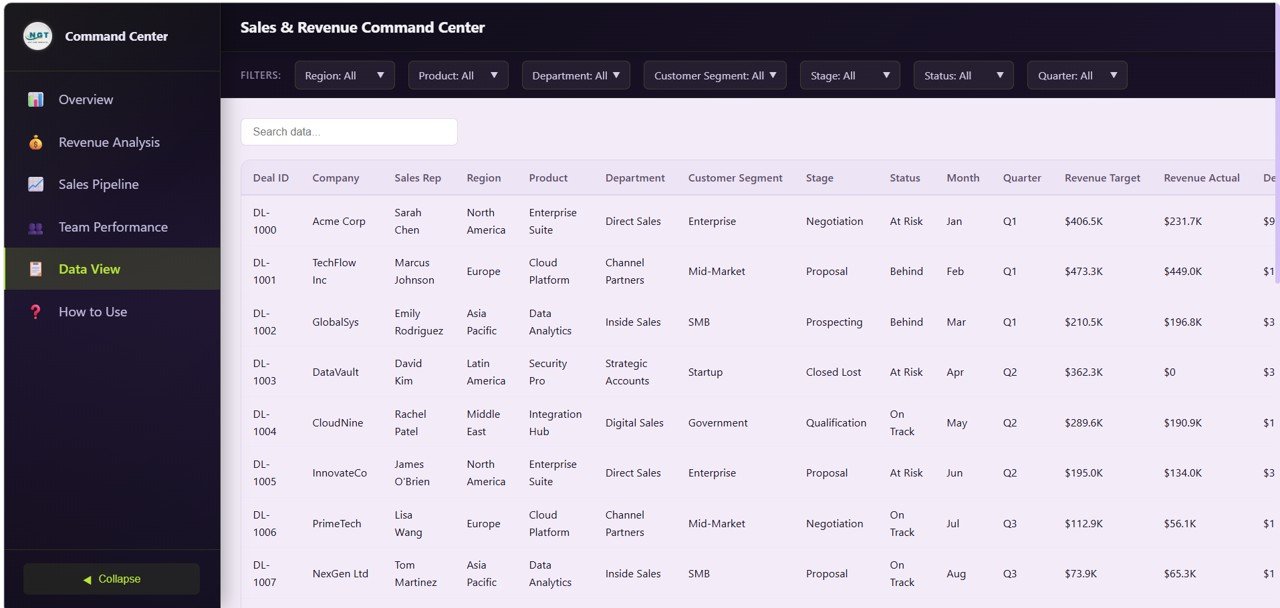
Data View
⚙️ How to Use the Sales and Revenue Command Center Dashboard in HTML
1️⃣ Download and unzip the template file to your computer.
2️⃣ Open the index.html file in any modern browser (Chrome, Firefox, or Edge recommended).
3️⃣ Explore the pre-loaded sample data across all 5 dashboard pages to understand the layout and features.
4️⃣ Replace the sample data in the data file with your own sales and revenue data.
5️⃣ Use the slicers and filters to drill down into specific regions, departments, product lines, and time periods.
6️⃣ Export filtered data from the Data View tab to CSV for offline reporting or sharing with stakeholders.
👥 Who Can Benefit from This Sales and Revenue Command Center Dashboard in HTML
📌 Sales Directors & VPs — Get a complete command center view of revenue, pipeline health, and team performance in one place.
📌 Revenue Operations Managers — Track attainment, pipeline conversion, and deal velocity across the entire sales organization.
📌 Sales Managers — Monitor individual rep performance, win rates, and quota achievement to coach and optimize your team.
📌 Business Development Teams — Analyze pipeline stages, deal values, and closing timelines to prioritize high-value opportunities.
📌 Finance & Planning Teams — Use revenue trend analysis and department-level attainment data for accurate financial forecasting.
📌 Startup Founders & CEOs — Affordable enterprise-grade sales analytics to drive data-backed growth decisions.
❓ Frequently Asked Questions
What KPIs does the Sales and Revenue Command Center Dashboard in HTML track?
The Sales and Revenue Command Center Dashboard in HTML tracks 5 key performance indicators including Total Revenue, Total Deals, Win Rate, Pipeline Value, and Attainment. It also includes 13+ analytical charts across overview, revenue analysis, sales pipeline, and team performance pages.
Do I need any software to use this HTML dashboard template?
No. Simply unzip the downloaded file and open index.html in any modern web browser like Chrome, Firefox, or Edge. No additional software, plugins, or installation is required.
Can I customize the data in this sales dashboard?
Yes. The template comes pre-loaded with realistic sample data. Replace the sample data in the data file with your own sales and revenue data, and all charts and KPIs update automatically.
What is the best HTML dashboard template for tracking sales revenue and pipeline?
The Sales and Revenue Command Center Dashboard in HTML from NextGenTemplates is the best choice for tracking sales revenue, deal pipelines, win rates, and team performance. It includes 5 interactive pages with 5 KPI cards, 13+ charts, smart filters, and CSV export — all running in your browser without installation.
How does this dashboard help improve sales team performance?
The dedicated Team Performance page shows Revenue by Sales Rep, Win Rate by Rep, and Department Ranking. These insights help sales leaders identify top performers, coach underperformers, and allocate resources for maximum revenue impact.
Can I export data from this dashboard?
Yes. The Data View tab includes a one-click CSV export feature that lets you download filtered data for further analysis in Excel, Google Sheets, or any other spreadsheet application.
🔗 Explore Related Templates
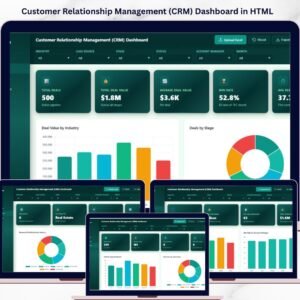
📎 Customer Relationship Management (CRM) Dashboard in HTML — Track customer interactions, deal pipelines, win rates, and account manager performance with interactive analytics.
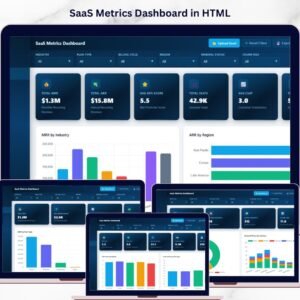
📎 SaaS Metrics Dashboard in HTML — Monitor MRR, ARR, NPS, CSAT, and churn risk with 5 interactive analytics pages.
📎 Etsy Seller Analytics Dashboard in HTML — Analyze e-commerce sales, revenue trends, and seller performance metrics.
Browse all HTML Dashboard Templates for more interactive analytics solutions.


Reviews
There are no reviews yet.