
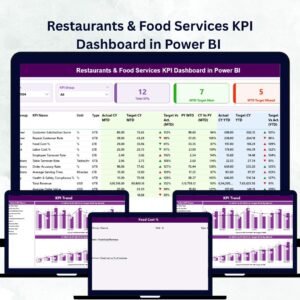
Restaurants & Food Services KPI Dashboard in Power BI Running a successful restaurant or food-service operation requires more than delicious dishes — it demands real-time visibility into performance, profits, and customer satisfaction 🍽️.
The Restaurants & Food Services KPI Dashboard in Power BI is a complete performance-management solution built for owners, managers, and finance teams who want data-driven clarity instead of guesswork. Restaurants & Food Services KPI Dashboard in Power BI Connected to your Excel data, it transforms complex numbers into beautiful, interactive visuals — helping you track sales, monitor costs, and boost service quality across every outlet in seconds ⚡.
Restaurants & Food Services KPI Dashboard in Power BI This ready-to-use Power BI template consolidates all your KPIs — financial, operational, and customer-related — into one smart, automated dashboard that refreshes with a single click.
⚙️ Key Features of the Restaurants & Food Services KPI Dashboard in Power BI
📊 3 Powerful Pages – Summary, KPI Trend & KPI Definition.
🎯 MTD & YTD Tracking – Compare monthly and year-to-date results instantly.
📈 Actual vs Target vs Previous Year – Spot gaps and growth in real time.
🟢 Color-Coded Visuals – Green = on track | Red = needs attention.
💬 Drill-Through Definitions – Right-click any KPI to see its formula and purpose.
💡 Interactive Slicers – Filter by Month or KPI Group effortlessly.
📦 Excel-Linked Data Source – Update your Excel sheets, refresh Power BI, and you’re done!
🚀 No Coding Needed – 100% ready-to-use template for non-technical users.
📦 What’s Inside the Dashboard

1️⃣ Summary Page – Performance at a Glance
Your main control hub for restaurant analytics.
-
Month & KPI Group slicers for quick filtering.
-
KPI cards showing Total KPIs Count, MTD Target Met, and MTD Target Missed.
-
At-a-glance insight into financial health and operational efficiency.
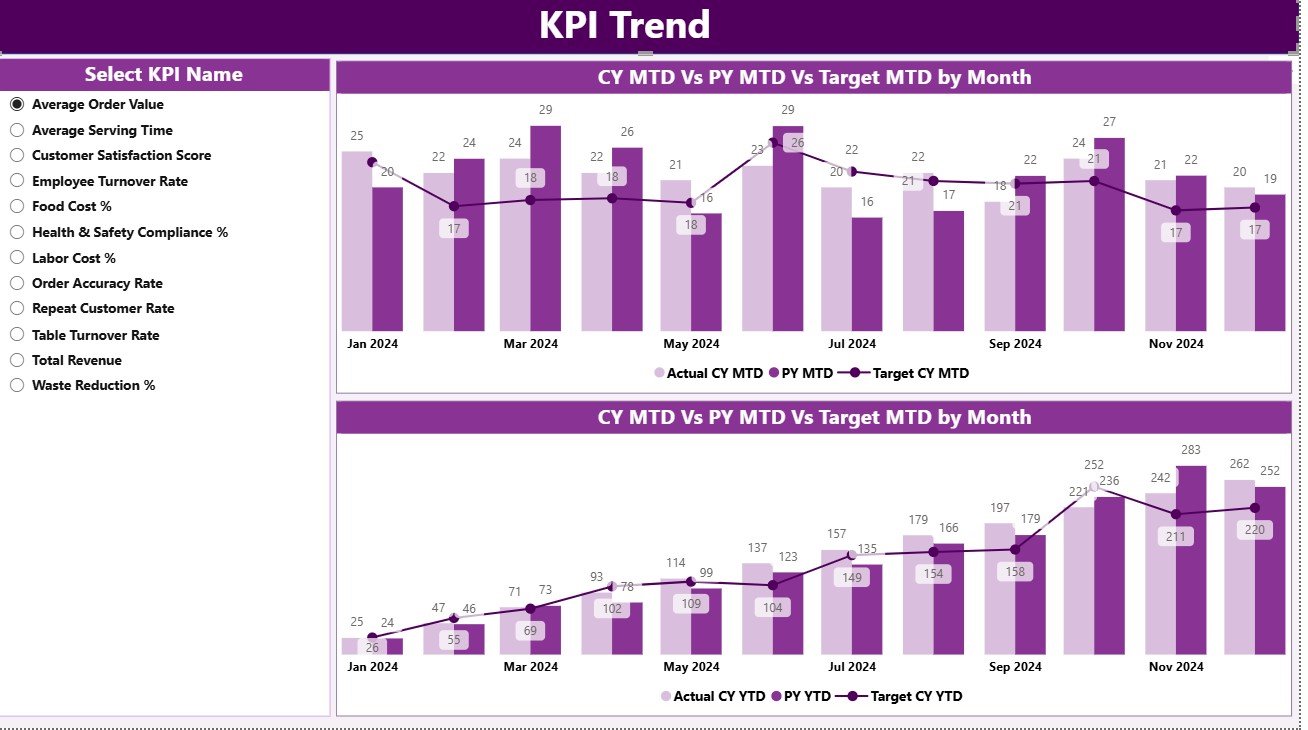
2️⃣ KPI Trend Page – Track Progress Over Time
Dive deeper with interactive combo charts for both MTD and YTD metrics.
-
Choose any KPI from the slicer (left panel).
-
Compare Actual, Target, and Previous Year data in real time.
-
Identify seasonal trends and forecast future results with ease 📈.
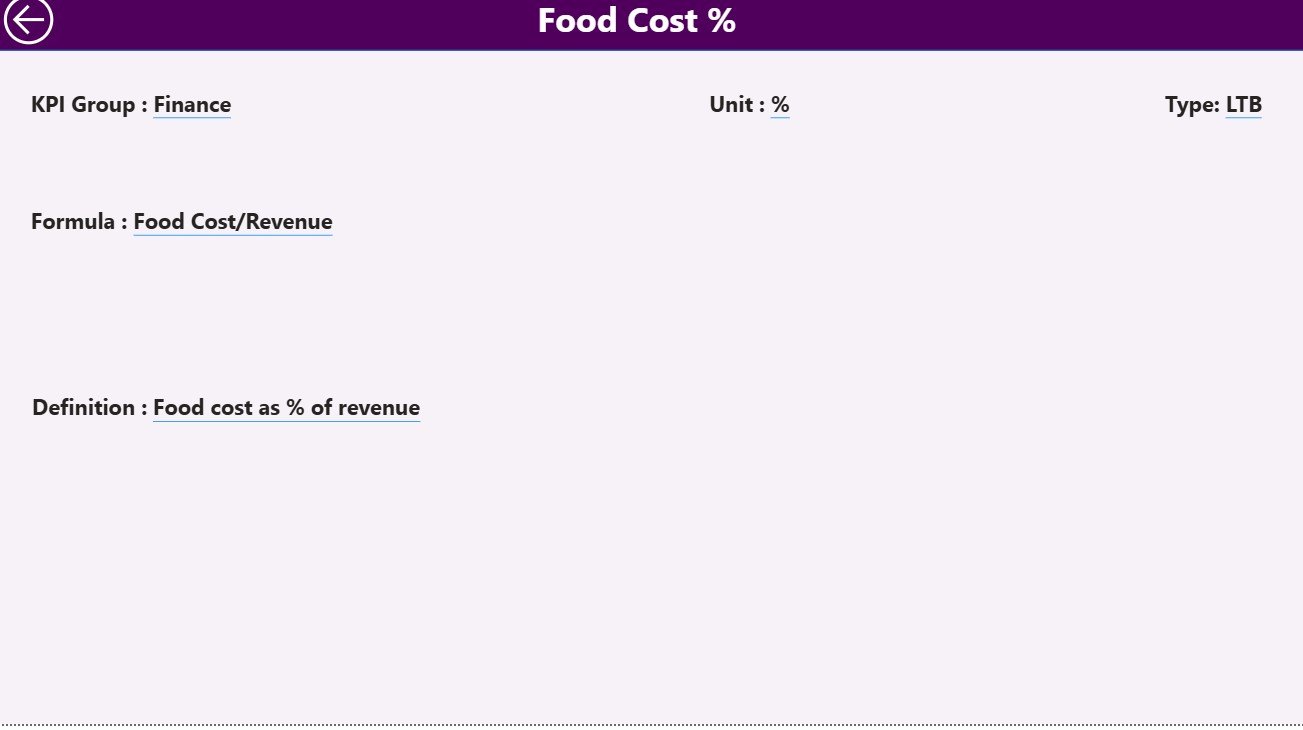
3️⃣ KPI Definition Page – Your Reference Guide
Accessed via drill-through from the Summary page.
-
Shows each KPI’s Formula, Definition, Unit, and Type (LTB/UTB).
-
Includes a handy Back button to return to the main view.
💼 Excel Data Source Structure
🧾 Input Actual Sheet – Enter KPI Name, Month, MTD & YTD Actuals.
🎯 Input Target Sheet – Record Target values for each KPI and month.
📘 KPI Definition Sheet – List KPI Number, Group, Unit, Formula, Definition & Type.
Update these three sheets, refresh Power BI, and your dashboard instantly reflects the latest data.
🍔 Key KPIs You Can Track
💰 Financial KPIs – Revenue Growth %, Gross Profit Margin %, Average Check Value (USD), COGS %.
⚙️ Operational KPIs – Table Turnover Rate, Inventory Turnover Ratio, Order Accuracy %, Food Waste %.
👥 Customer KPIs – CSAT Score, Repeat Customer Rate %, Complaint Resolution Time (mins).
These KPIs deliver a 360° view of sales performance, cost control, and guest experience.
🌟 Advantages of the Restaurants & Food Services KPI Dashboard in Power BI
✅ Real-Time Monitoring – Stay updated as soon as data changes.
✅ Clear Visuals – Charts and cards make data easy to understand.
✅ Time Savings – Automated formulas cut manual work by hours.
✅ Performance Transparency – All stakeholders see the same metrics.
✅ Customizable Design – Add new KPIs or tweak layouts in minutes.
✅ Comparative Insights – Instant MTD/YTD/PY comparisons.
✅ Scalable – Works for single restaurants or large chains.
💡 Best Practices for Effective Use
-
📅 Update data monthly to keep insights accurate.
-
🎯 Define and document KPIs clearly in the Definition page.
-
📈 Analyze both MTD and YTD views for short- and long-term performance.
-
🟢 Use color signals to spot improvements instantly.
-
🔍 Drill through to KPI formulas for root-cause analysis.
-
🤝 Share Power BI reports across teams to enhance collaboration.
By combining these steps with consistent data updates, you’ll turn Power BI into your restaurant’s ultimate growth engine.


Reviews
There are no reviews yet.