Managing procurement operations in a refinery is complex and demanding. Refineries handle large volumes of raw materials, multiple suppliers, strict quality standards, and tight delivery schedules. Even a small delay or pricing mismatch can affect production continuity, cost efficiency, and profitability.
That is exactly why the Refinery Procurement Dashboard in Excel is a powerful and essential solution. 🚀
This professionally designed Excel dashboard helps refinery teams track procurement performance, monitor supplier efficiency, analyze costs, and improve purchasing decisions using clear and interactive visuals.
Built completely in Microsoft Excel, this dashboard eliminates manual reporting and gives procurement teams full control over purchasing operations without the need for expensive BI tools.
Key Features of Refinery Procurement Dashboard in Excel 🔑
📊 Centralized Procurement Monitoring
Track all procurement activities, suppliers, costs, and departments from one unified dashboard.
📈 Real-Time Cost Visibility
Monitor total PO value, unit cost, invoice status, and spending trends instantly.
🧭 Easy Navigation Panel
Quickly switch between dashboard pages using the built-in page navigator.
📉 Department & Supplier Insights
Analyze purchasing behavior by department and supplier for better cost control.
📅 Monthly Trend Analysis
Track procurement performance over time to identify patterns and forecast spending.
⚡ Faster Decision-Making
Visual KPIs highlight risks, delays, and cost overruns instantly.
💼 Management-Ready Reporting
Perfect for procurement reviews, audits, and strategic planning meetings.
What’s Inside the Refinery Procurement Dashboard in Excel 📁
This ready-to-use Excel dashboard consists of five interactive analytical pages along with a data and support sheet.
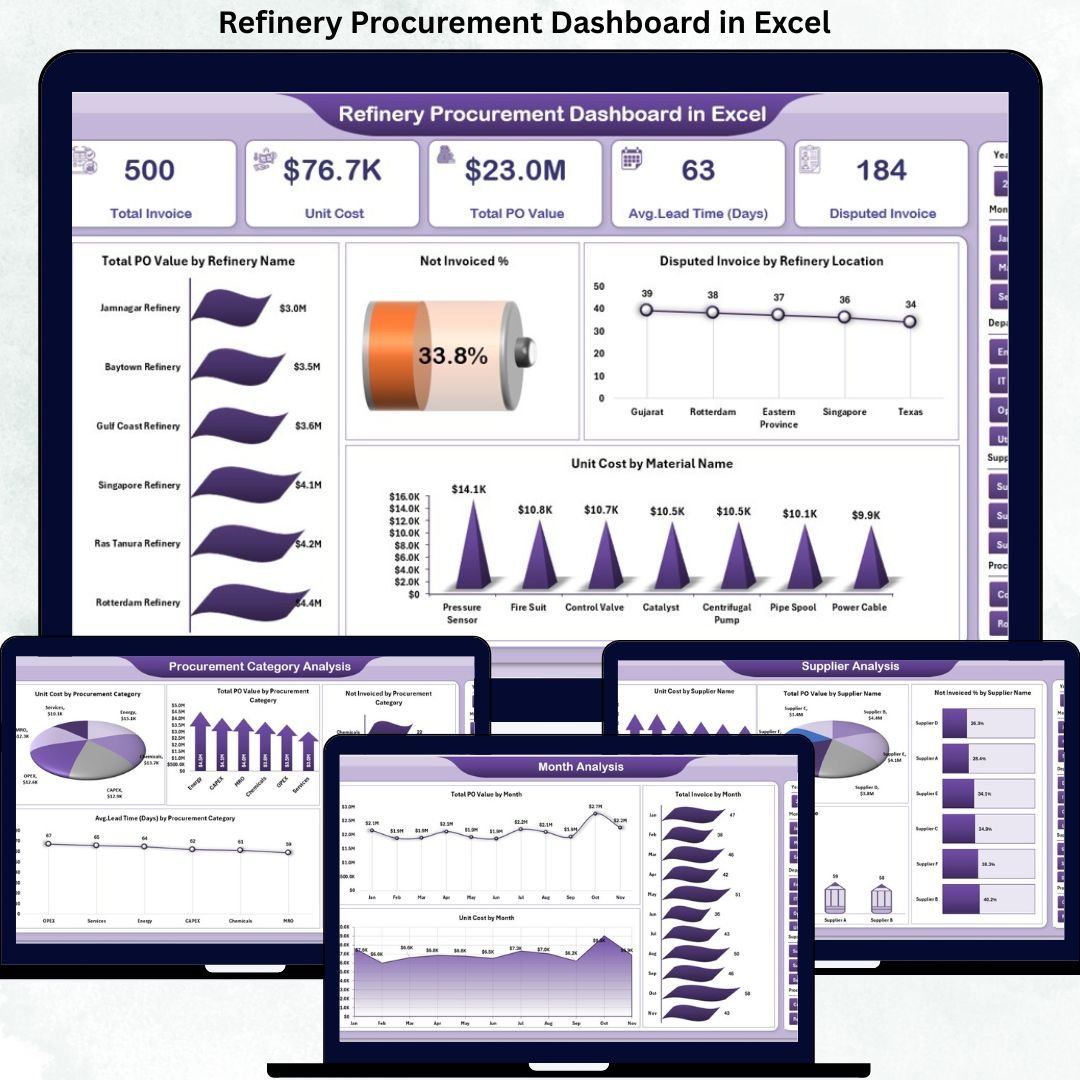
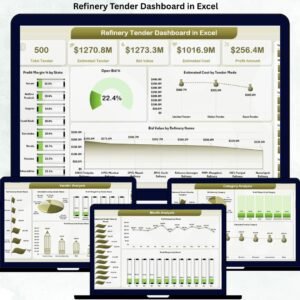
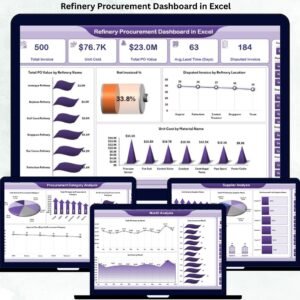
📄 Overview Page
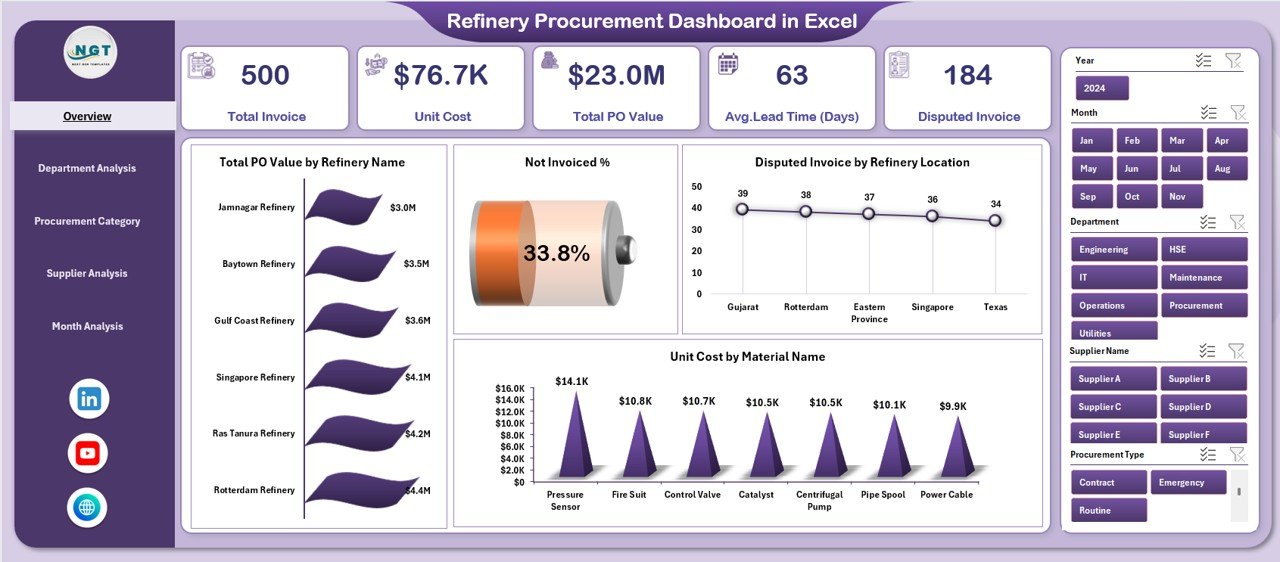
The main dashboard that provides a high-level view of procurement performance, including:
-
Total PO Value by Refinery Name
-
Not Invoiced Percentage
-
Disputed Invoice by Refinery Location
-
Unit Cost by Material Name
This page gives instant visibility into overall procurement health.
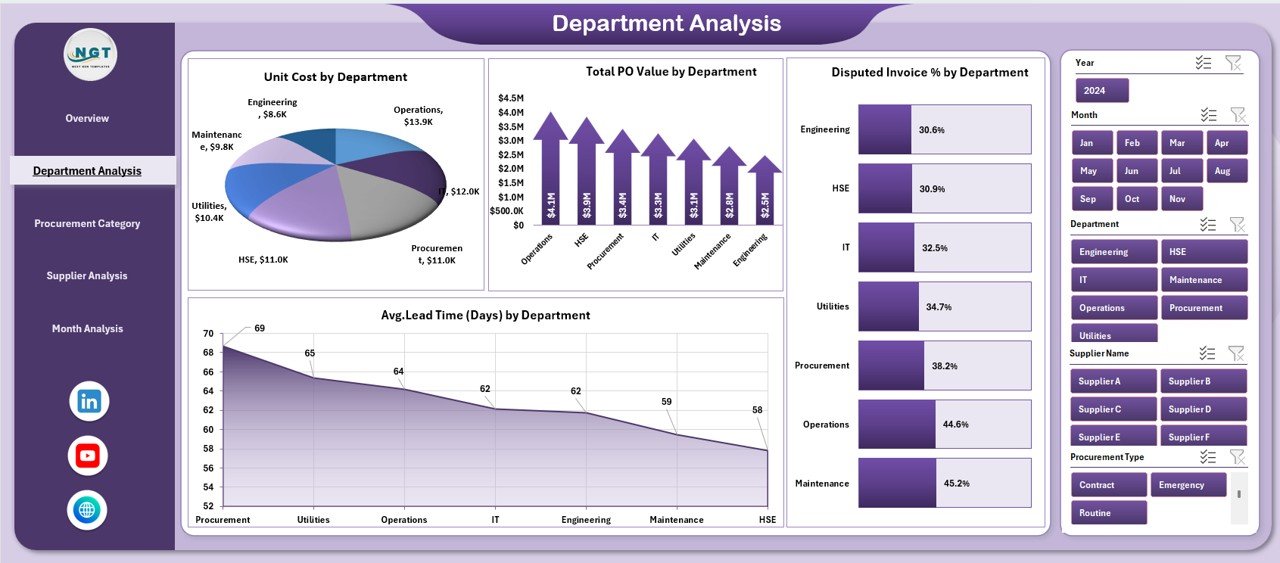
📄 Department Analysis Page
Helps analyze procurement by department using:
-
Unit Cost by Department
-
Total PO Value by Department
-
Disputed Invoice % by Department
-
Average Lead Time by Department
This page supports department-wise cost control and accountability.
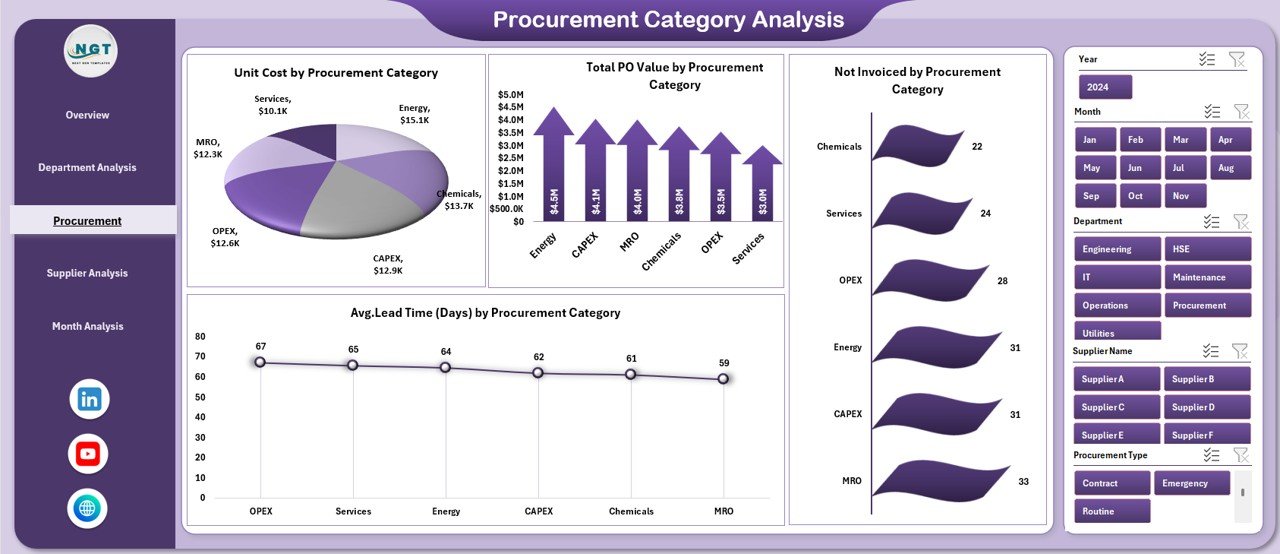
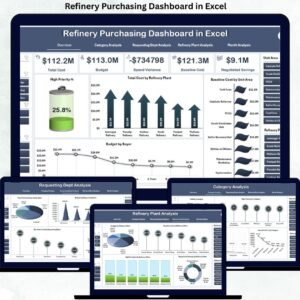
📄 Procurement Category Analysis Page
Provides category-level insights such as:
-
Unit Cost by Procurement Category
-
Total PO Value by Category
-
Not Invoiced Amount by Category
-
Average Lead Time by Category
Helps identify high-cost categories and optimization opportunities.
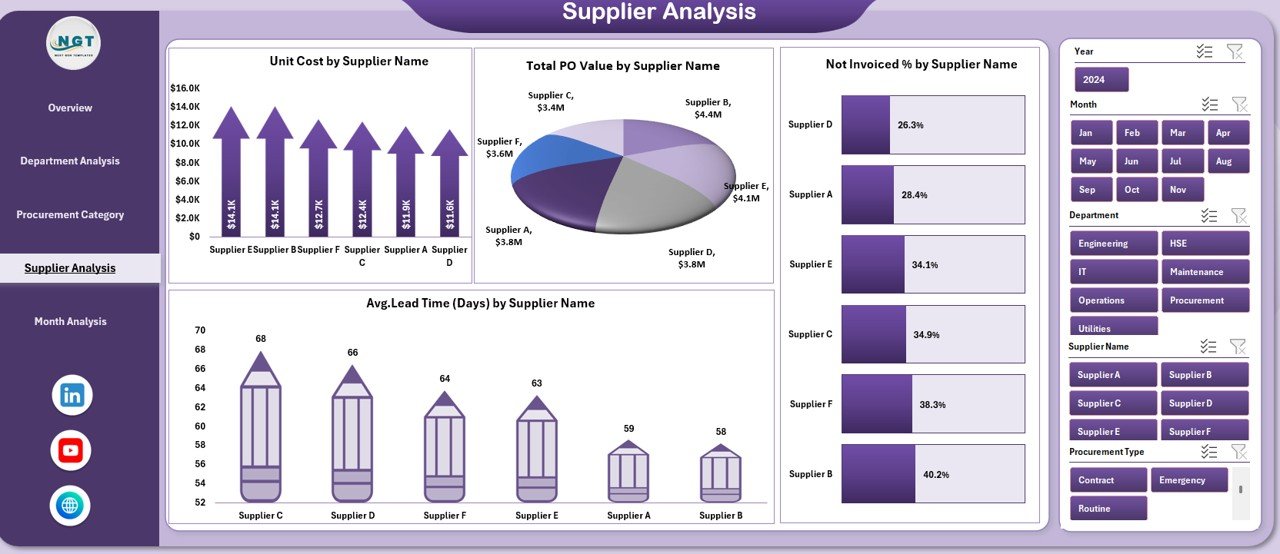
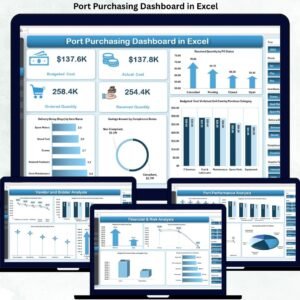
📄 Supplier Analysis Page
Enables supplier performance tracking using:
-
Unit Cost by Supplier
-
Total PO Value by Supplier
-
Pending Invoices by Supplier
-
Average Lead Time by Supplier
Supports better vendor evaluation and negotiation.
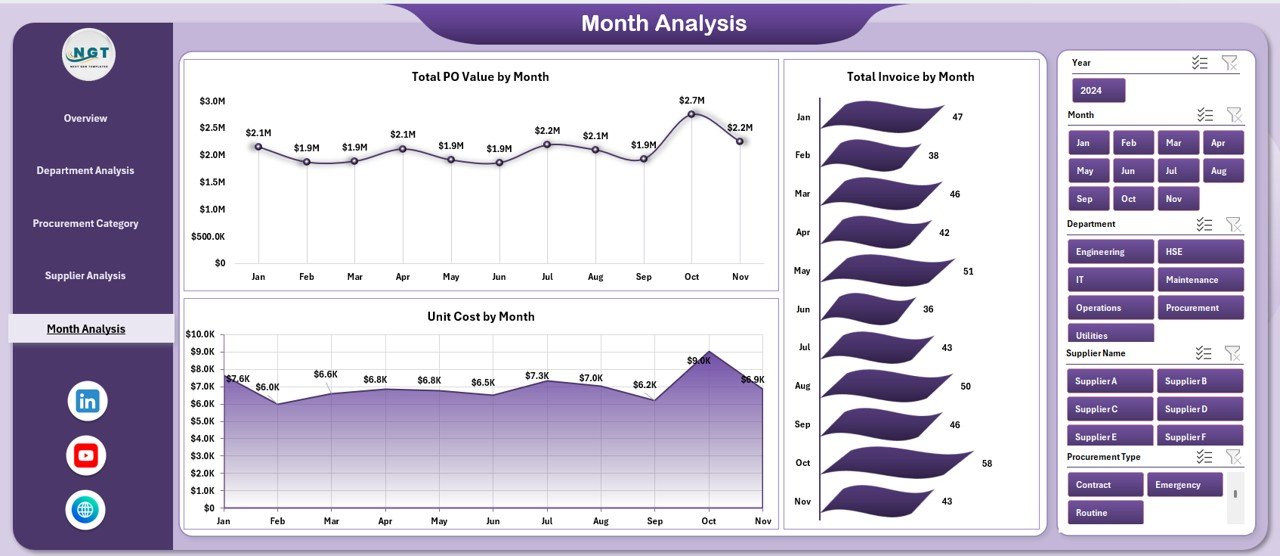
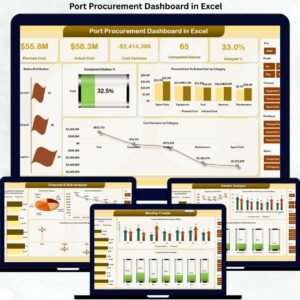
📄 Month Analysis Page
Shows procurement trends over time with:
-
Unit Cost by Month
-
Total PO Value by Month
-
Total Invoice by Month
Helps in forecasting and budget planning.
📄 Data & Support Sheets
Store raw procurement data, calculations, and helper tables that power the entire dashboard automatically.
How to Use the Refinery Procurement Dashboard in Excel 🛠️
1️⃣ Enter or update procurement data in the Data Sheet
2️⃣ Use slicers to filter by refinery, department, supplier, or month
3️⃣ View KPIs and charts update automatically
4️⃣ Identify cost drivers and procurement risks
5️⃣ Use insights for reporting and decision-making
No advanced Excel knowledge is required. The dashboard is fully automated and user-friendly.
Who Can Benefit from This Refinery Procurement Dashboard 👥
🏭 Procurement Teams – Track purchases and supplier performance
📦 Supply Chain Managers – Monitor delivery and cost efficiency
💰 Finance Teams – Control budgets and spending
⚙️ Operations Managers – Improve procurement planning
📊 Senior Management – Make data-driven strategic decisions
Suitable for both small and large refinery operations.


Reviews
There are no reviews yet.