Product Return Rate KPI Dashboard in Excel – Track Returns, Cut Costs & Boost Customer Trust 📊
Running a business means constantly keeping an eye on performance. Among all metrics, the Product Return Rate is one of the most critical. A high return rate not only impacts your bottom line but also signals deeper problems in product quality, shipping accuracy, or customer satisfaction.
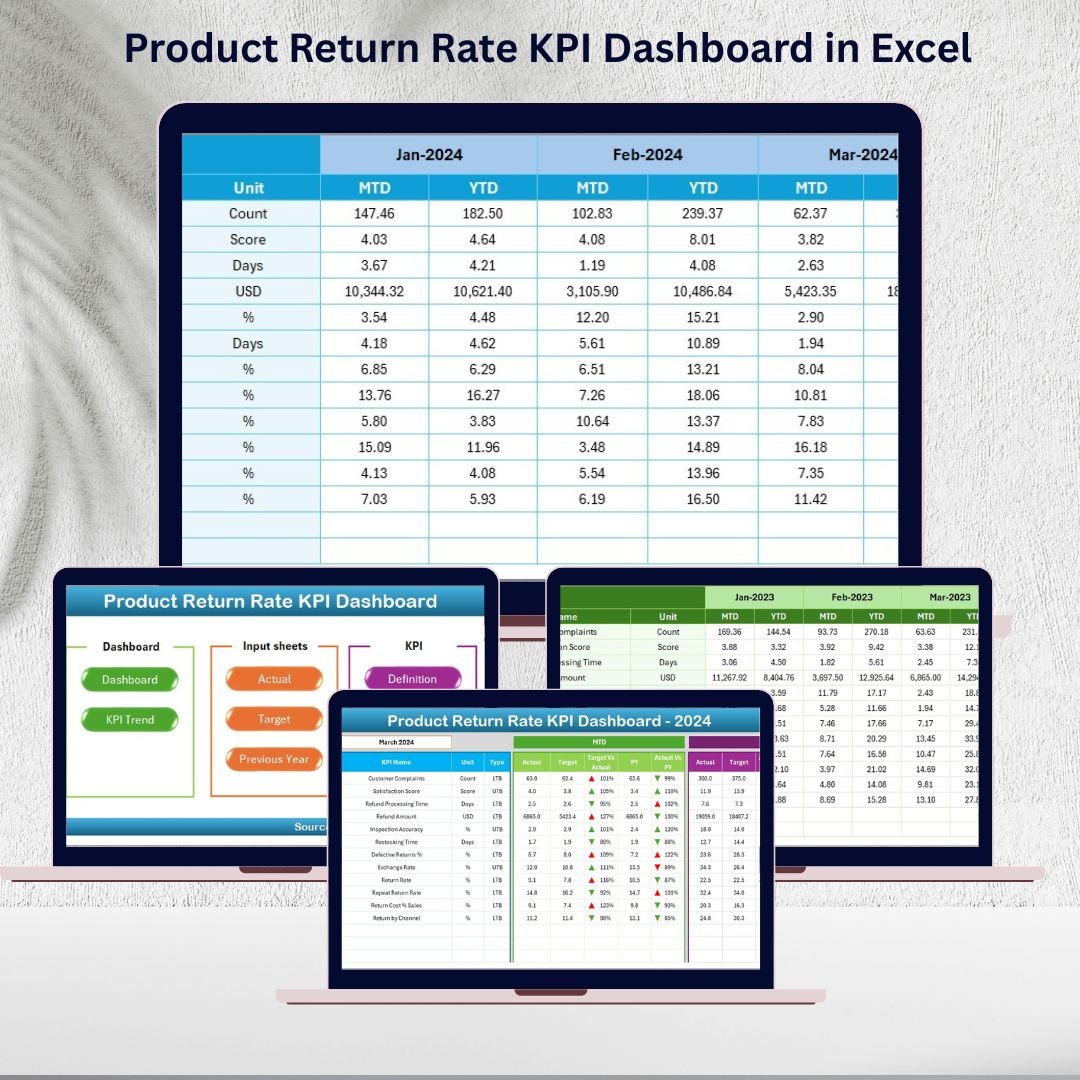
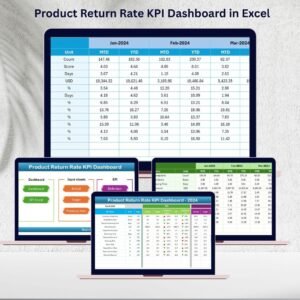
That’s where the Product Return Rate KPI Dashboard in Excel becomes a must-have. Instead of juggling scattered reports, this ready-to-use dashboard gives you a clear, visual, and structured overview of all return-related KPIs—empowering managers to spot problems early, take corrective action, and build long-term customer loyalty.Product Return Rate KPI Dashboard in Excel
With seven dedicated sheets, the dashboard helps you manage actuals, targets, and historical comparisons seamlessly. From month-to-date (MTD) to year-to-date (YTD) tracking, you can evaluate return rates, analyze trends, and measure performance against targets—all within a single Excel file.
✨ Key Features of Product Return Rate KPI Dashboard
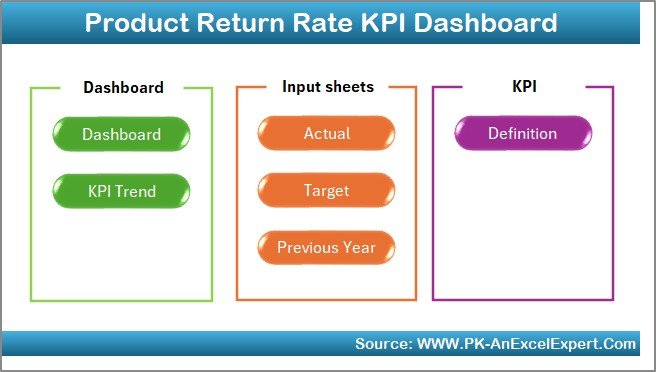
✅ 7 Ready-to-Use Sheets – Home, Dashboard, KPI Trend, Actual Numbers, Targets, Previous Year Data, and KPI Definition.
✅ One-Click Navigation – Buttons on the Home sheet allow quick access to all tabs.
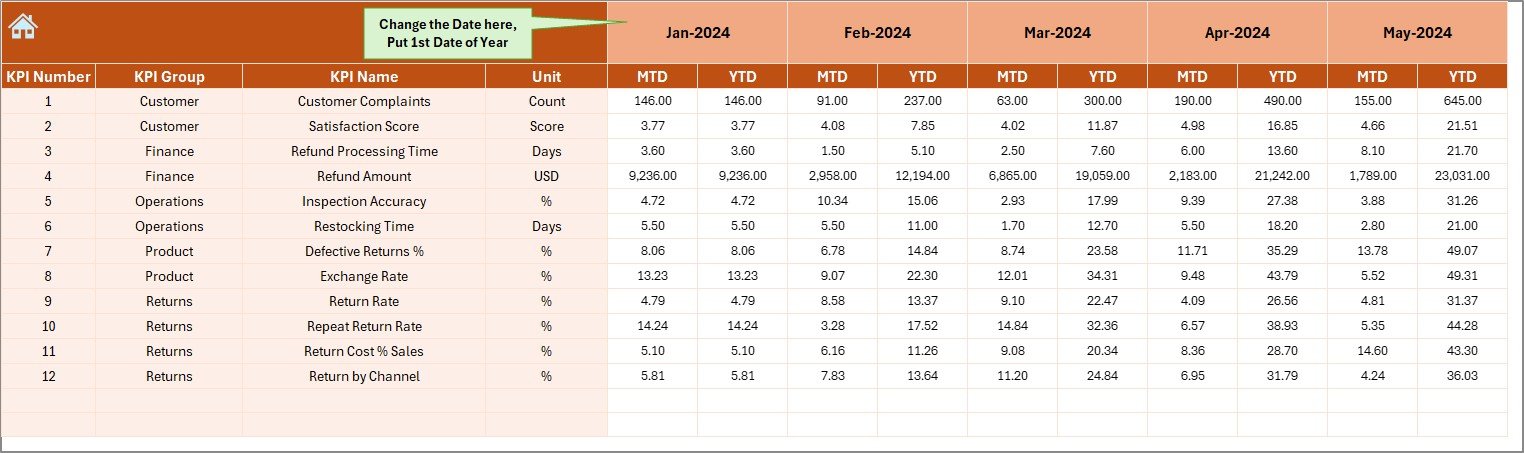
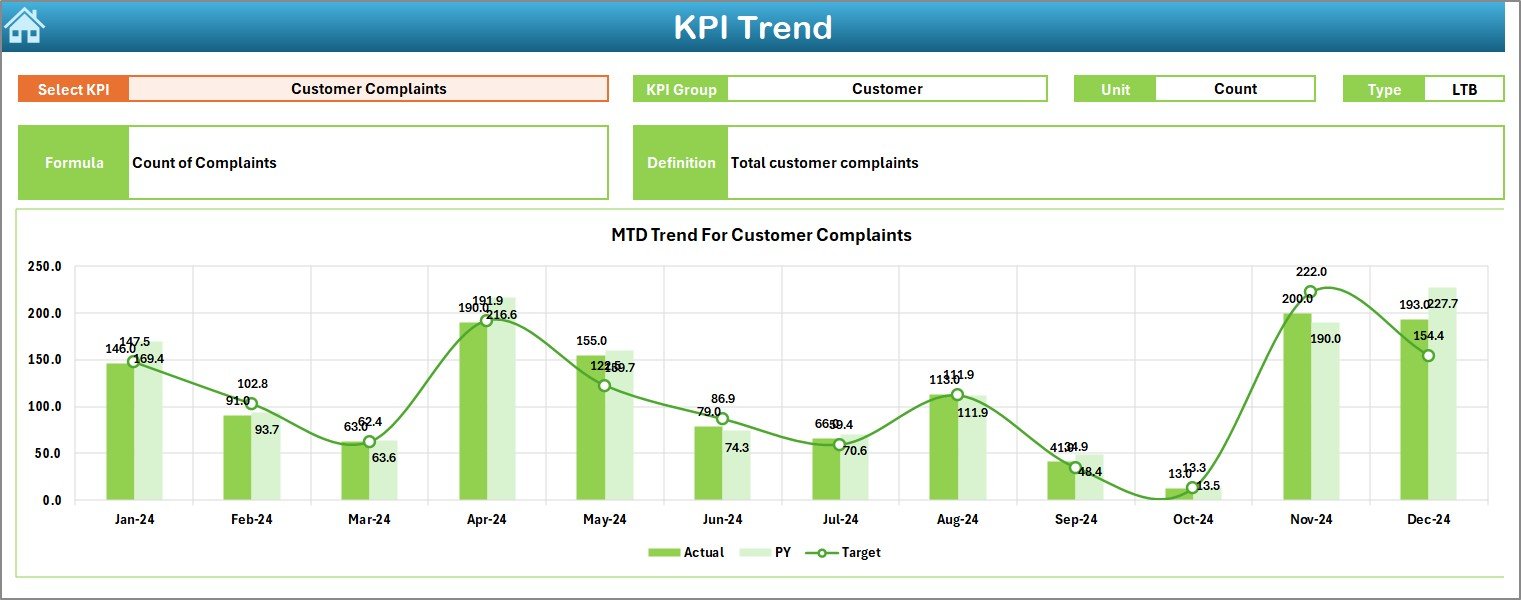
✅ Dynamic Drop-Downs – Select months and KPIs to instantly update charts.
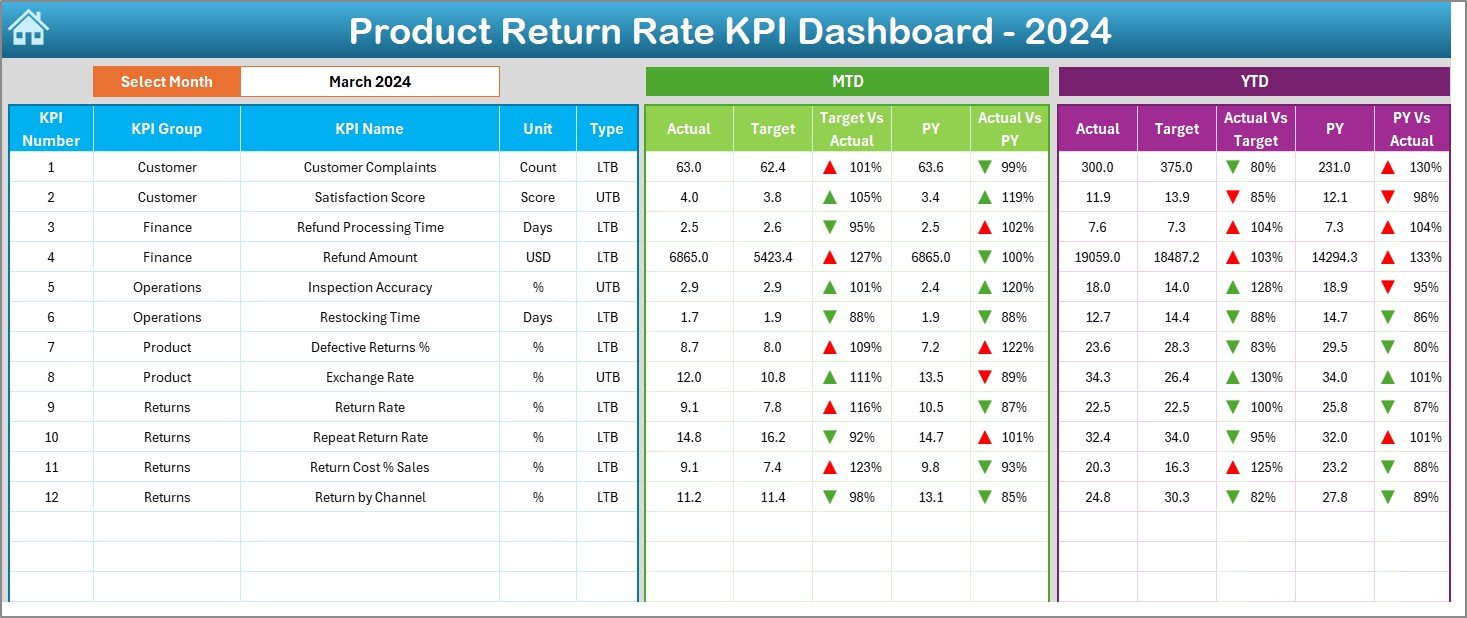
✅ Comprehensive Analysis – MTD and YTD return metrics with Actual vs Target and Previous Year comparisons.
✅ Conditional Formatting – Color-coded arrows highlight performance gaps.Product Return Rate KPI Dashboard in Excel
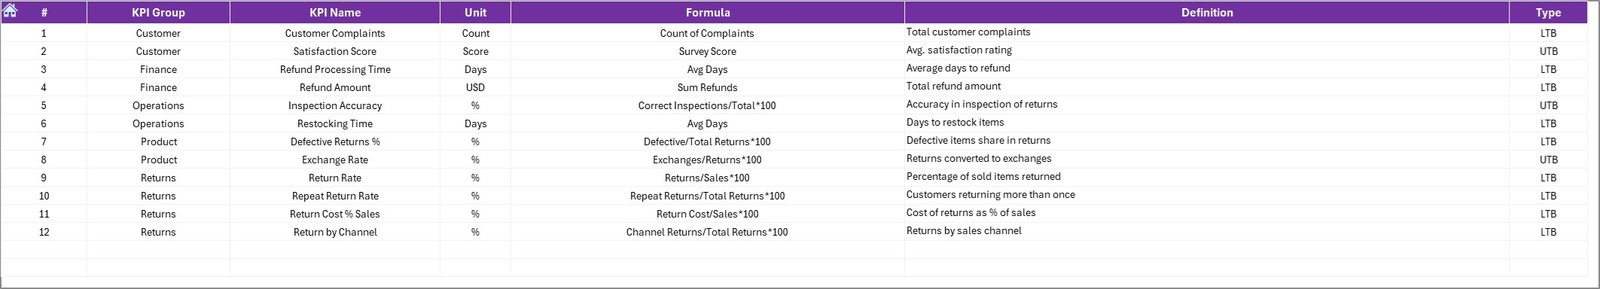
✅ KPI Repository – Built-in KPI definitions with unit, formula, and type for clarity.
✅ Excel-Based & Flexible – No complex software, just pure Excel with full customization.
📦 What’s Inside the Product Return Rate KPI Dashboard?
-
Home Sheet – Your index page for fast navigation.
-
Dashboard Sheet – The central hub with all key visual insights.
-
KPI Trend Sheet – Analyze selected KPIs with trend charts.
-
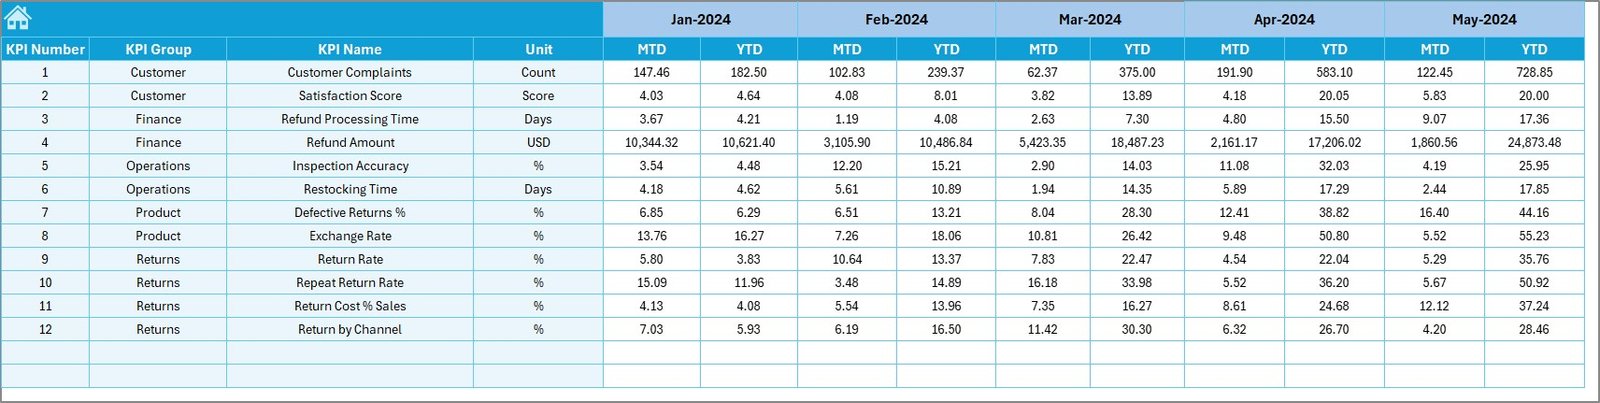
Actual Numbers Input Sheet – Easy interface to update real data.Product Return Rate KPI Dashboard in Excel
-
Target Sheet – Define your monthly and yearly goals.
-
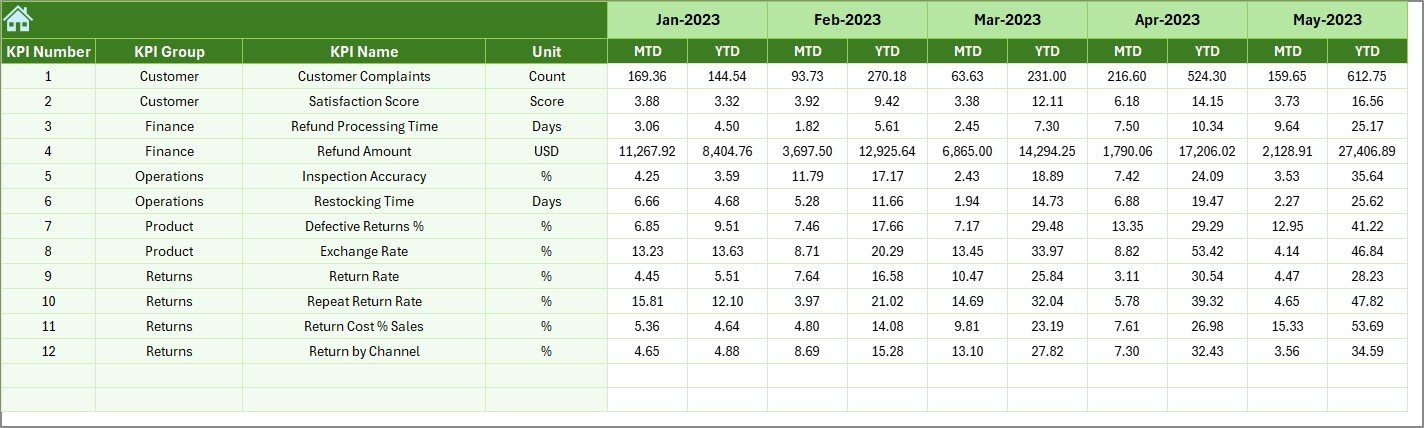
Previous Year Sheet – Compare with last year’s data for trends.
-
KPI Definition Sheet – All KPI details in one place for reference.
This structure ensures that you can enter, monitor, and analyze data without confusion or extra setup.
🛠️ How to Use the Product Return Rate KPI Dashboard
-
Enter Your Data – Input actual return values, targets, and past year’s numbers.
-
Pick a Month or KPI – Use drop-downs to dynamically view insights.
-
Check Trends – Monitor MTD vs YTD returns and compare against goals.
-
Spot Issues Quickly – Use arrows and color codes to detect deviations.
-
Review with Teams – Share findings with quality, logistics, and sales.
It’s designed to be plug-and-play—just update numbers monthly, and the dashboard takes care of the rest.
👥 Who Can Benefit from This Product?
-
Business Owners & Managers – To track performance and cut return costs.
-
E-Commerce Sellers – To monitor product issues and reduce repeat returns.
-
Quality & Operations Teams – To identify recurring defects and improve packaging.
-
Customer Experience Managers – To address service gaps impacting satisfaction.
-
Retail Analysts – To study trends and improve supply chain efficiency.
No matter your industry, if product returns affect your business, this dashboard will provide the clarity and control you need.


Reviews
There are no reviews yet.