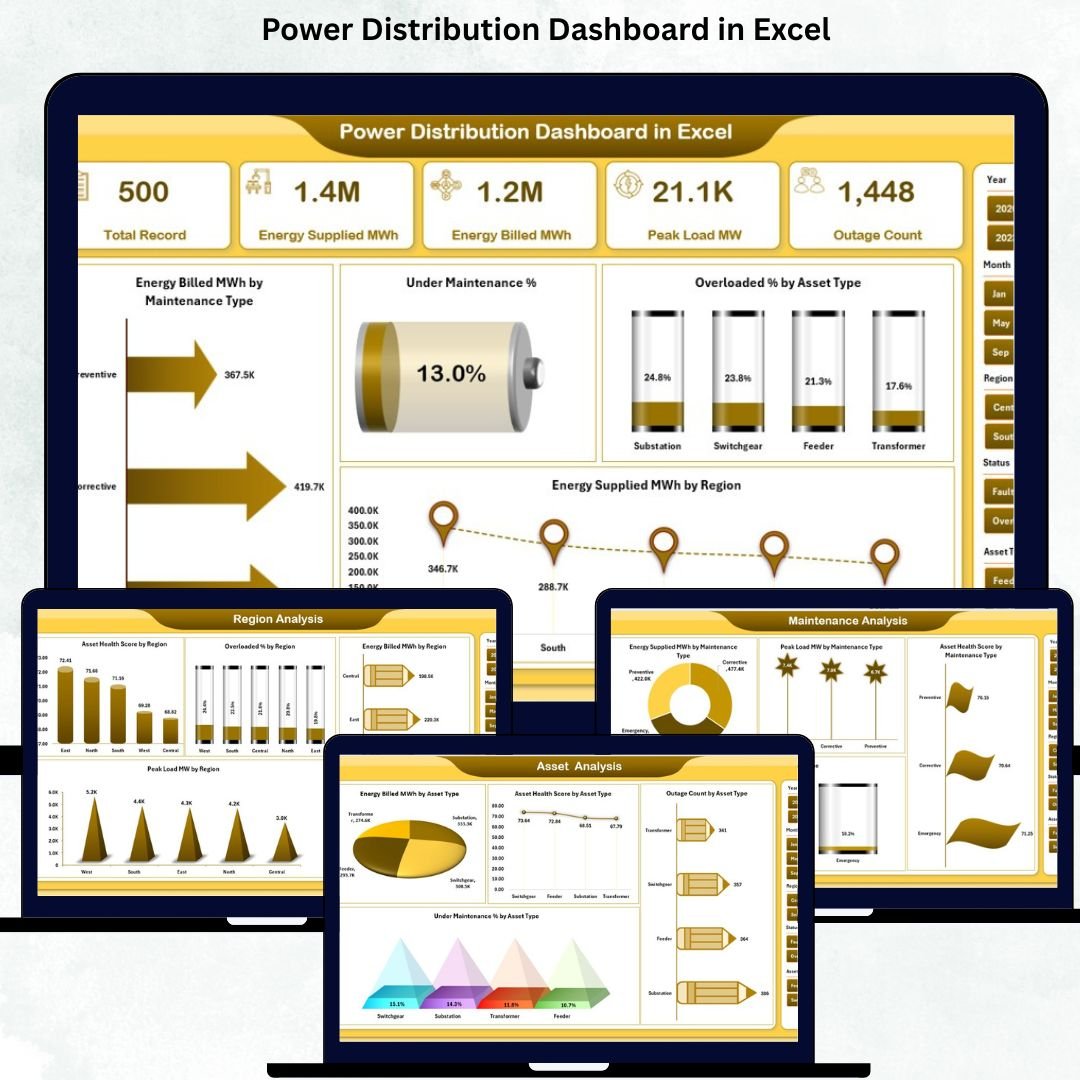
Power Distribution Dashboard in Excel is the backbone of modern infrastructure. Industries, utilities, smart cities, and public services rely on uninterrupted electricity to function efficiently. However, managing power distribution assets, peak loads, maintenance schedules, outages, and regional performance becomes challenging when information is scattered across multiple Excel files and manual reports. This lack of centralized visibility often results in delayed decisions, increased risks, and operational inefficiencies. That is exactly why a Power Distribution Dashboard in Excel becomes a powerful operational and decision-making tool.
The Power Distribution Dashboard in Excel is a ready-to-use, interactive analytics solution designed to bring all critical power distribution data into one structured, visual dashboard. Built entirely in Excel, this dashboard transforms raw electrical data into meaningful KPIs, charts, and trend visuals. With slicers, KPI cards, and page navigation, users can instantly monitor system health, identify problem areas, and take proactive actions—without using complex or expensive tools.
Whether you manage a utility network, industrial power system, or city-wide distribution infrastructure, this dashboard helps you improve efficiency, reliability, and transparency across operations.
✨ Key Features of the Power Distribution Dashboard in Excel
This professionally designed dashboard includes five in-depth analytical pages, each focused on a critical aspect of power distribution performance.
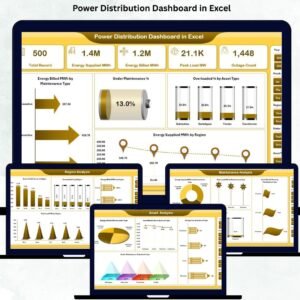
⭐ Overview Page – Complete Power Distribution Snapshot
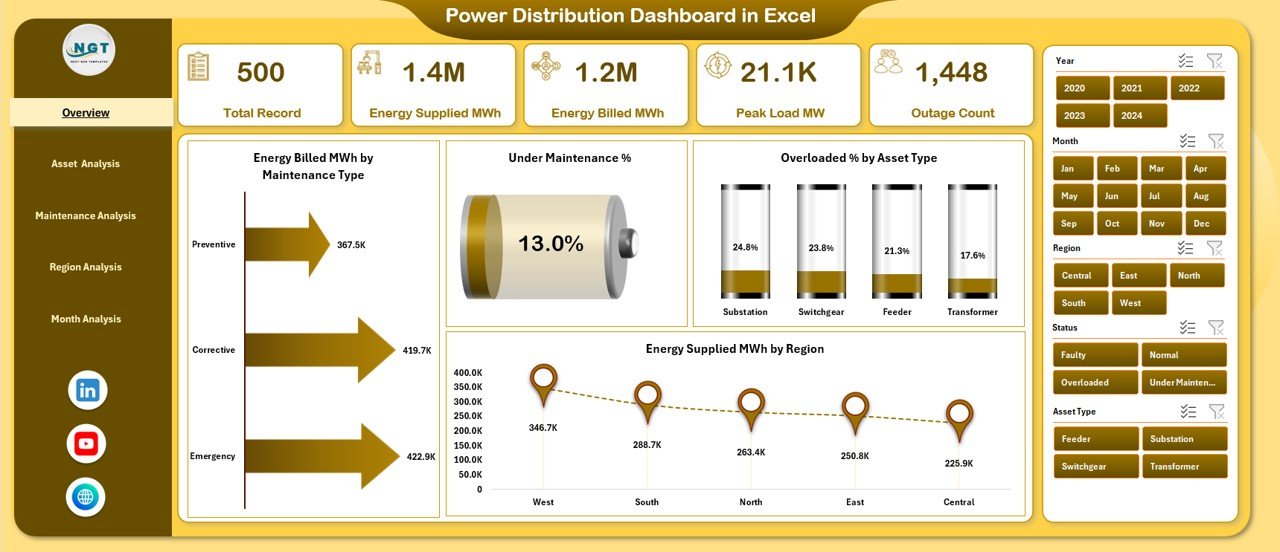
✔ Right-side slicers for filtering by maintenance type, asset type, region, and month
✔ Five KPI cards for fast performance understanding
✔ Four key charts:
-
High Energy Billed MWh by Maintenance Type
-
Under Maintenance %
-
Overloaded % by Asset Type
-
Energy Supplied MWh by Region
This page gives leadership a quick overview of system efficiency, risks, and workload.
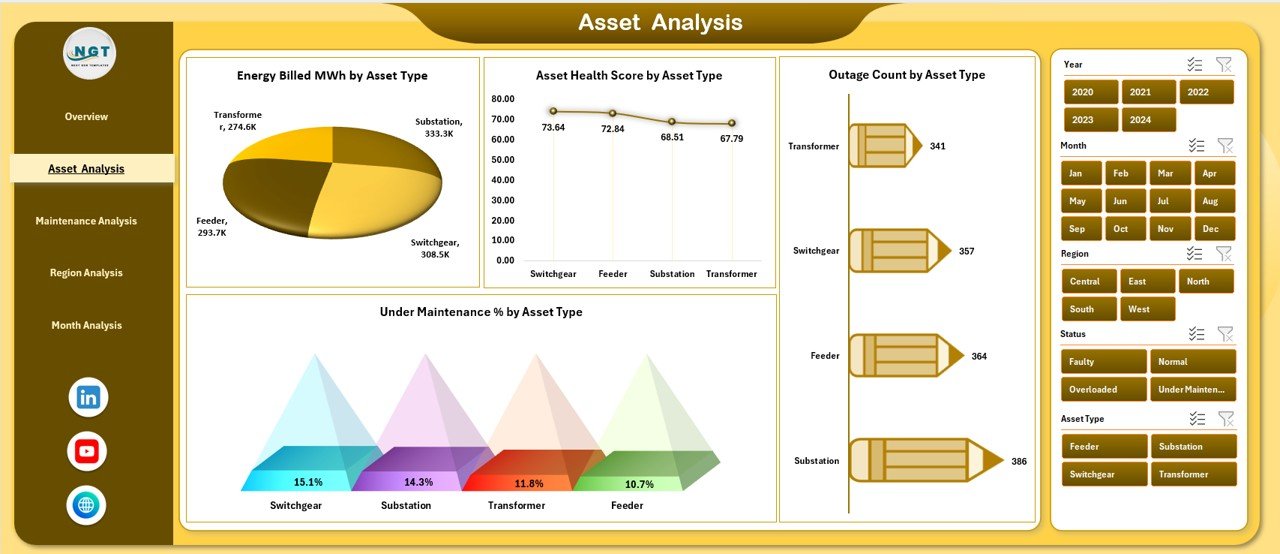
⭐ Asset Analysis Page – Monitor Asset Health & Reliability
✔ Energy Billed MWh by Asset Type
✔ Asset Health Score by Asset Type
✔ Outage Count by Asset Type
✔ Under Maintenance % by Asset Type
This page helps asset managers identify weak or overloaded assets and prioritize corrective actions.
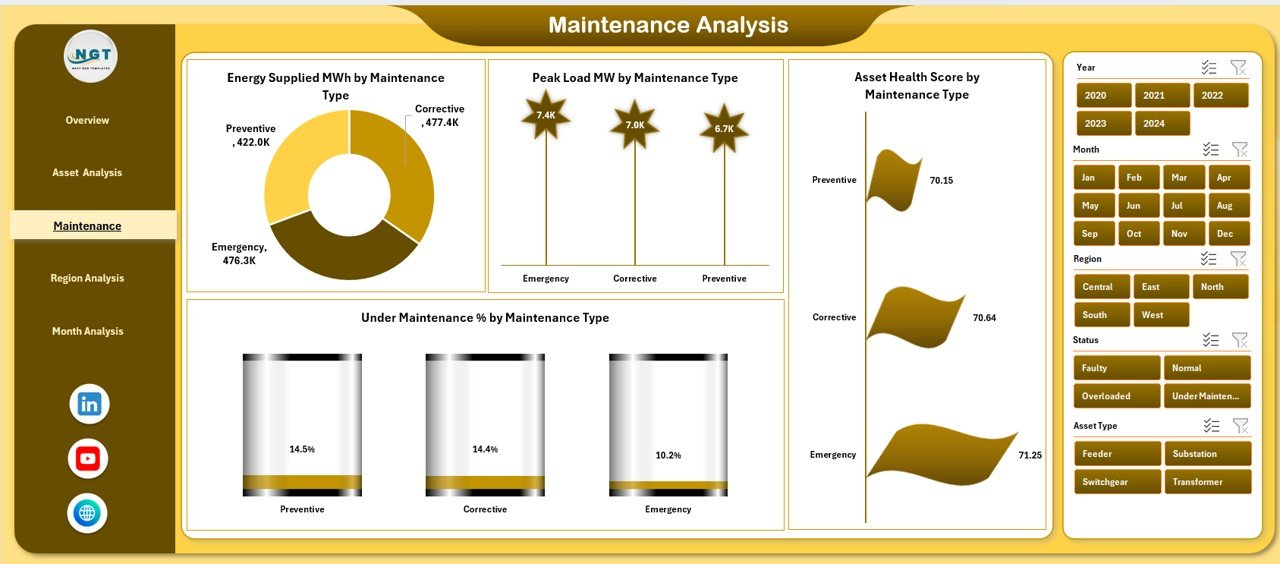
⭐ Maintenance Analysis Page – Evaluate Maintenance Effectiveness
✔ Energy Billed MWh by Maintenance Type
✔ Peak Load MW by Maintenance Type
✔ Asset Health Score by Maintenance Type
✔ Under Maintenance % by Maintenance Type
Using these insights, operations teams can optimize maintenance planning and reduce downtime.
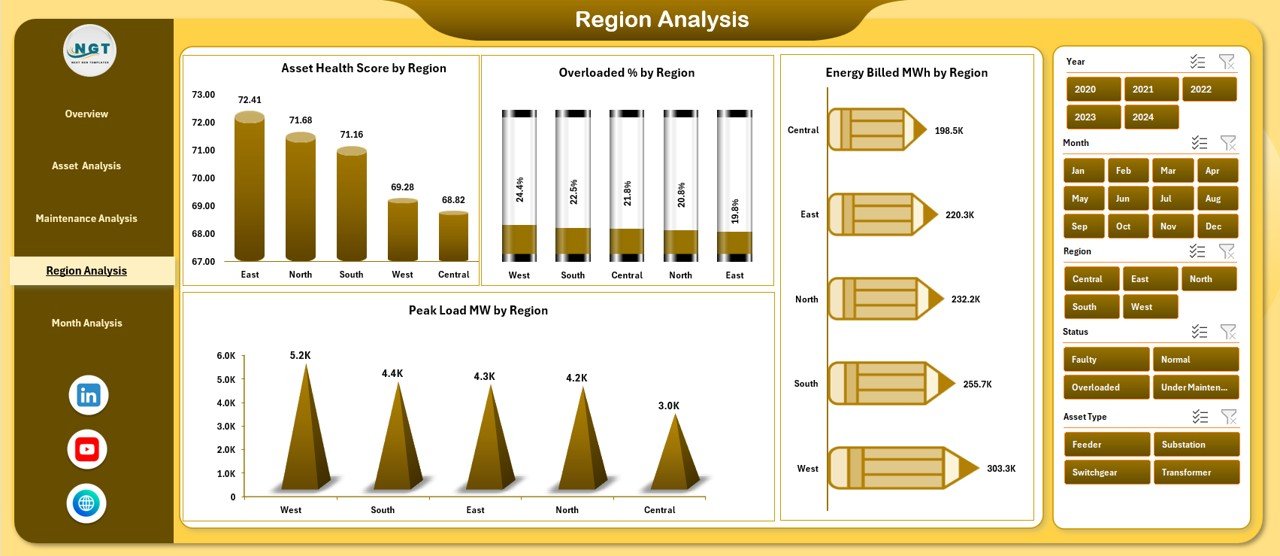
⭐ Region Analysis Page – Compare Regional Performance
✔ Energy Billed MWh by Region
✔ Overloaded % by Region
✔ Asset Health Score by Region
✔ Peak Load MW by Region
This page helps utilities allocate resources efficiently across regions based on performance and risk.
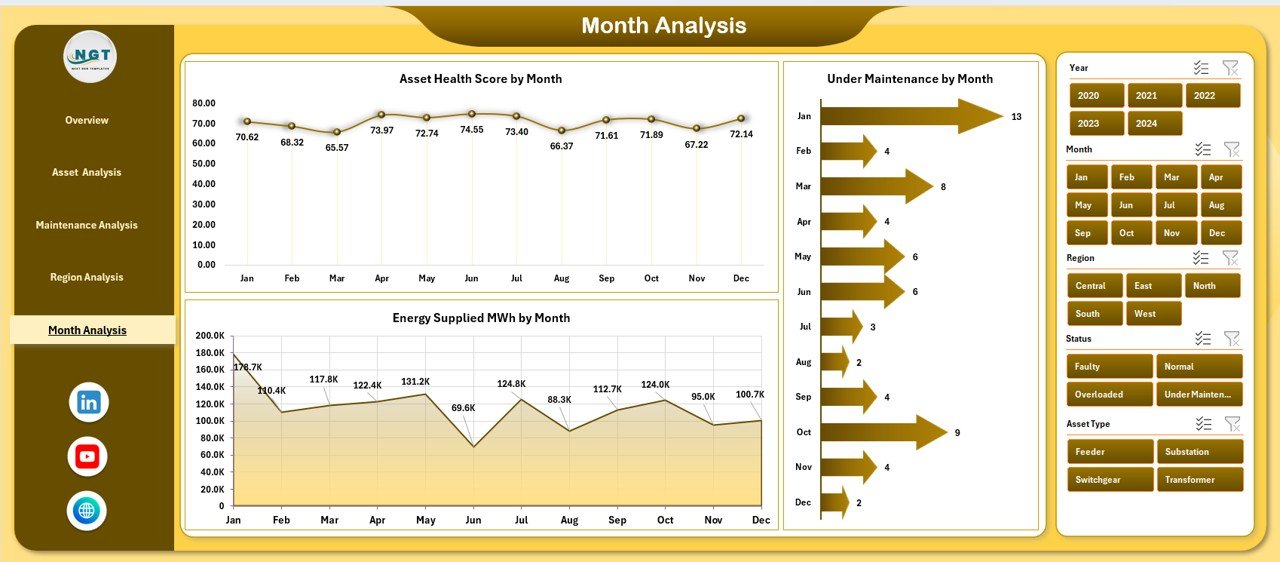
⭐ Month Analysis Page – Track Trends Over Time
✔ Asset Health Score by Month
✔ Under Maintenance % by Month
✔ Energy Supplied MWh by Month
This page highlights seasonal trends and long-term patterns for better forecasting and planning.
📦 What’s Inside the Power Distribution Dashboard in Excel
When you download this product, you receive:
✨ A ready-to-use Excel dashboard file
✨ Five interactive analysis pages
✨ Left-side page navigator for easy movement
✨ Right-side slicers for dynamic filtering
✨ KPI cards for instant insights
✨ Charts driven by structured data
✨ Data Sheet for raw inputs
✨ Support Sheet for background calculations
Everything is designed to deliver clarity with minimal effort.
🛠️ How to Use the Power Distribution Dashboard in Excel
1️⃣ Open the Excel dashboard file
2️⃣ Enter or update power distribution data in the Data Sheet
3️⃣ Navigate between pages using the page navigator
4️⃣ Apply filters using slicers (region, asset, maintenance, month)
5️⃣ Review KPI cards and charts
6️⃣ Identify risks such as overloads or maintenance backlogs
7️⃣ Take data-driven operational decisions
No advanced Excel skills are required—basic familiarity is sufficient.
👥 Who Can Benefit from This Power Distribution Dashboard in Excel
This dashboard is ideal for:
✔ Power utility companies
✔ Energy distribution firms
✔ Infrastructure & facility managers
✔ Smart city development teams
✔ Electrical maintenance departments
✔ Energy consultants
✔ Government and public utility bodies
Both technical and non-technical users can benefit from this dashboard.
### 📘 Click here to read the Detailed blog post
🎥 Visit our YouTube channel to learn step-by-step video tutorials
👉 Youtube.com/@PKAnExcelExpert


Reviews
There are no reviews yet.