Ports and harbors never sleep. Ships dock at all hours. Cargo moves continuously. Fuel prices fluctuate. Delay hours impact profitability. Meanwhile, customers expect smooth and timely service.
If you are still managing port performance using scattered spreadsheets and manual reports, you are missing the complete operational picture.
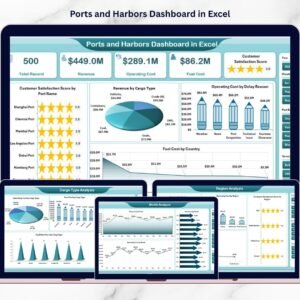
That is why we created the Ports and Harbors Dashboard in Excel — a powerful, ready-to-use performance monitoring system designed specifically for port authorities and logistics managers.
This interactive Excel dashboard helps you track revenue, operating cost, fuel cost, delay hours, and customer satisfaction — all in one structured file. Instead of compiling reports manually, you simply refresh Pivot Tables and gain instant insights.
If you want complete visibility, faster decisions, and stronger cost control, this dashboard is built for you.
🚀 Key Feature of Ports and Harbors Dashboard in Excel
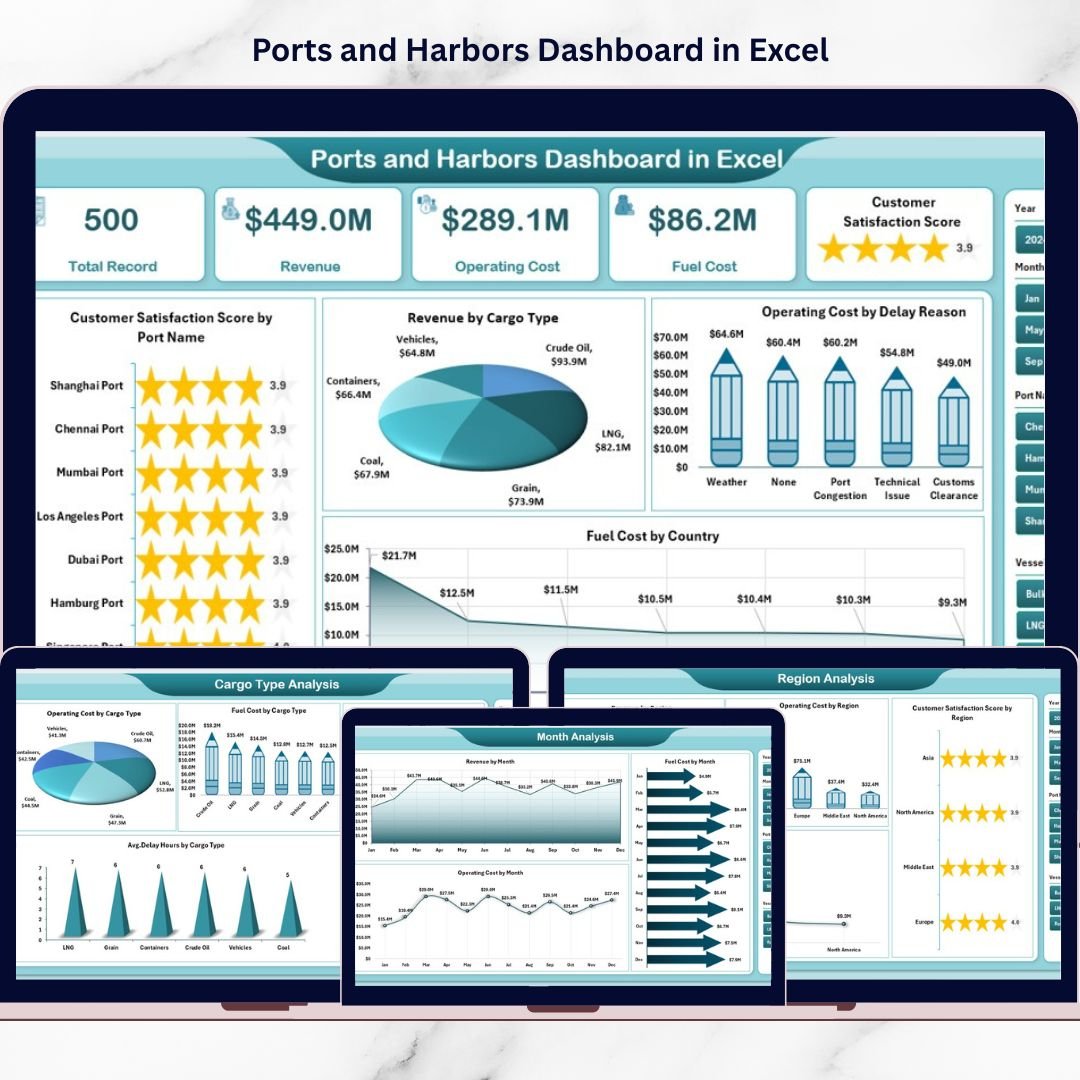
This dashboard includes 5 analytical pages, along with a Support Sheet and Data Sheet for structured data management.
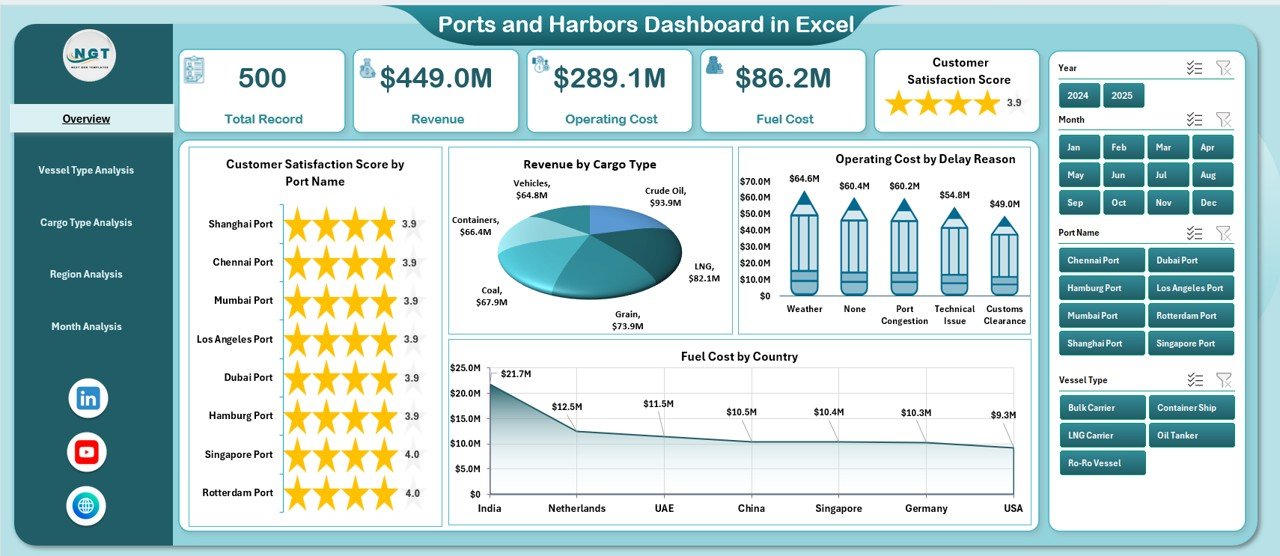
📊 Overview Page – Monitor customer satisfaction, revenue by cargo type, operating cost by delay reason, and fuel cost by country.
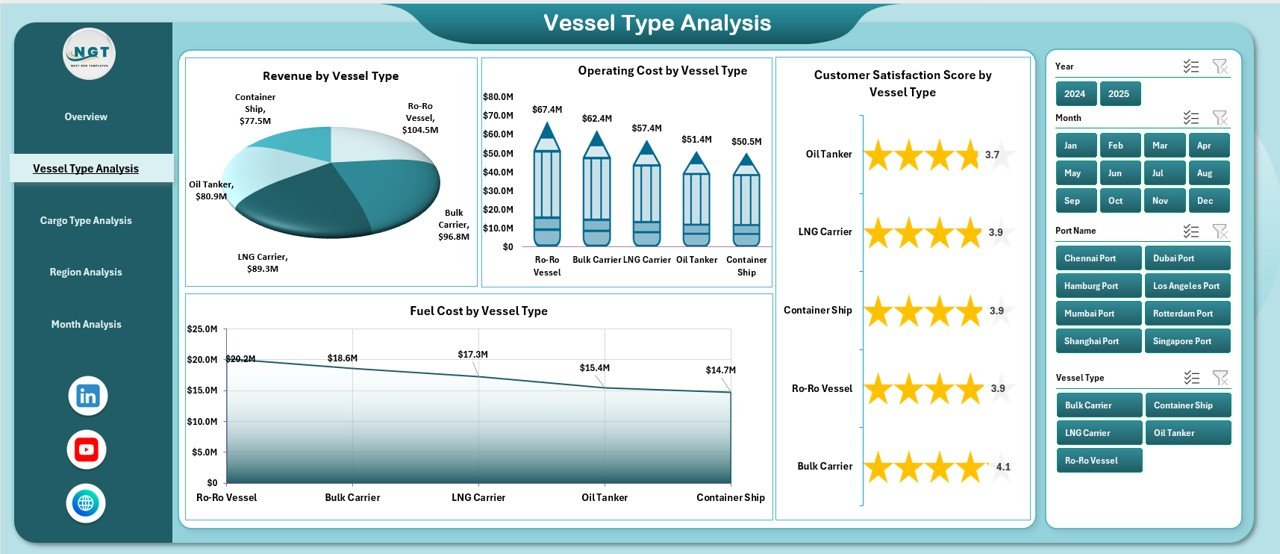
🚢 Vessel Type Analysis – Compare revenue, fuel cost, operating cost, and satisfaction by vessel category.
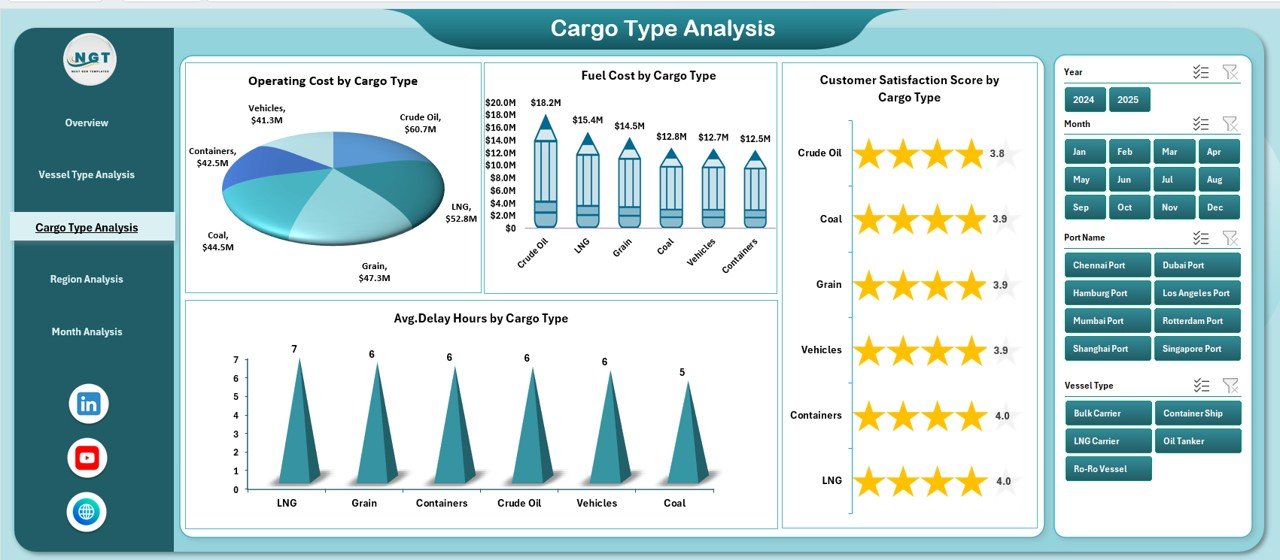
📦 Cargo Type Analysis – Identify cargo-specific delay patterns, cost drivers, and revenue trends.
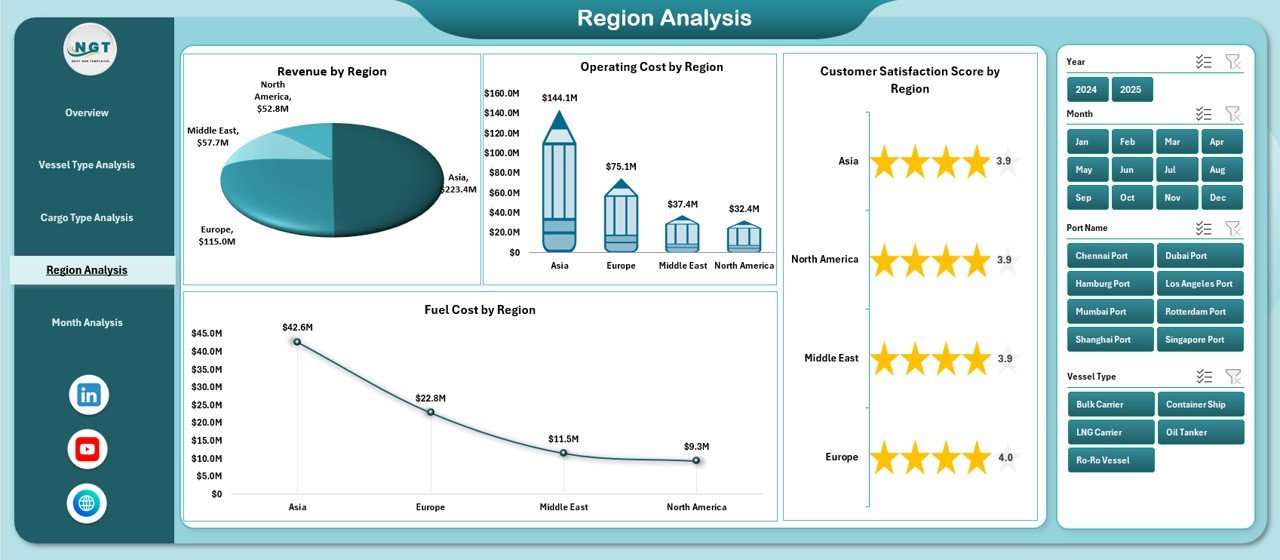
🌍 Region Analysis – Analyze performance region-wise to detect profitability and cost variations.
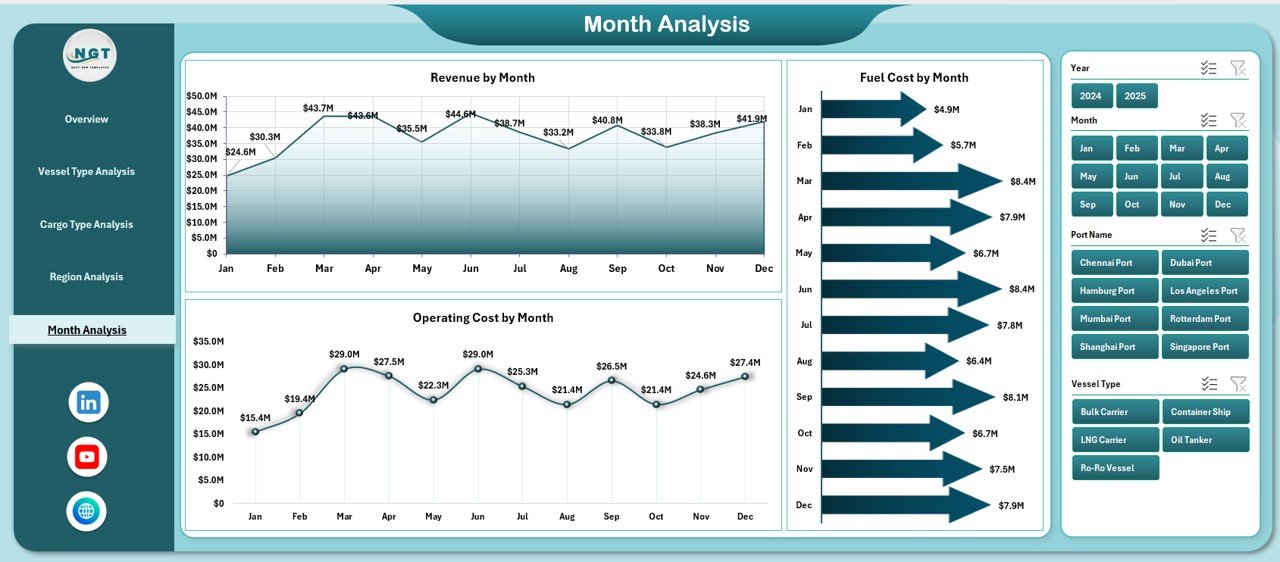
📅 Month Analysis – Track revenue, operating cost, and fuel cost month by month to identify seasonal patterns.
✨ Additional highlights:
-
Left-side Page Navigator for easy switching
-
Right-side slicers for dynamic filtering
-
Pivot Tables & Pivot Charts for automated analysis
-
Fully customizable Excel structure
Because everything runs in Excel, you can modify KPIs and expand data anytime.
📦 What’s Inside the Ports and Harbors Dashboard in Excel
This ready-to-use Excel file contains:
✔ 5 Interactive Dashboard Pages
✔ Structured Data Sheet for operational inputs
✔ Support Sheet for slicers and dropdown lists
✔ Revenue tracking by cargo, region & vessel type
✔ Operating cost monitoring by delay reason
✔ Fuel cost analysis by country & month
✔ Customer satisfaction performance insights
✔ Average delay hour tracking
✔ Easy refresh functionality
You only need to update the Data Sheet. The dashboard updates automatically.
🛠 How to Use the Ports and Harbors Dashboard in Excel
Using this dashboard is simple:
1️⃣ Enter operational data in the Data Sheet (Revenue, Cost, Delay Hours, Satisfaction, Date).
2️⃣ Refresh the Pivot Tables.
3️⃣ Use slicers to filter by port, vessel type, cargo type, region, or month.
4️⃣ Analyze charts to identify trends and performance gaps.
For example:
If fuel cost increases in a specific country, you can investigate supply contracts immediately.
If delay hours spike for container cargo, you can review loading processes.
If customer satisfaction drops in one region, you can improve service standards quickly.
Because the dashboard centralizes operations, decision-making becomes faster and smarter.
👥 Who Can Benefit from This Ports and Harbors Dashboard in Excel
This dashboard is ideal for:
⚓ Port Authorities
🚢 Logistics & Shipping Managers
📦 Cargo Operations Teams
💼 Maritime Finance Teams
🌍 Regional Port Administrators
🏗 Harbor Infrastructure Planners
Whether you manage a single port or multiple harbor locations, this dashboard supports both operational and strategic decisions.
It improves:
✔ Cost transparency
✔ Delay management
✔ Revenue tracking
✔ Fuel monitoring
✔ Regional profitability analysis
When port data becomes structured and visual, performance improves naturally.
💰 How This Dashboard Improves Profitability
Profitability depends on cost control and operational efficiency.
This dashboard helps you:
-
Detect operating cost spikes early
-
Monitor fuel expense fluctuations
-
Reduce delay-related losses
-
Improve berth and vessel allocation
-
Track revenue growth by cargo type
Instead of reacting to problems late, you prevent them early.
And that strengthens your financial performance.
Click hare to read the Detailed blog post
Visit our YouTube channel to learn step-by-step video tutorials