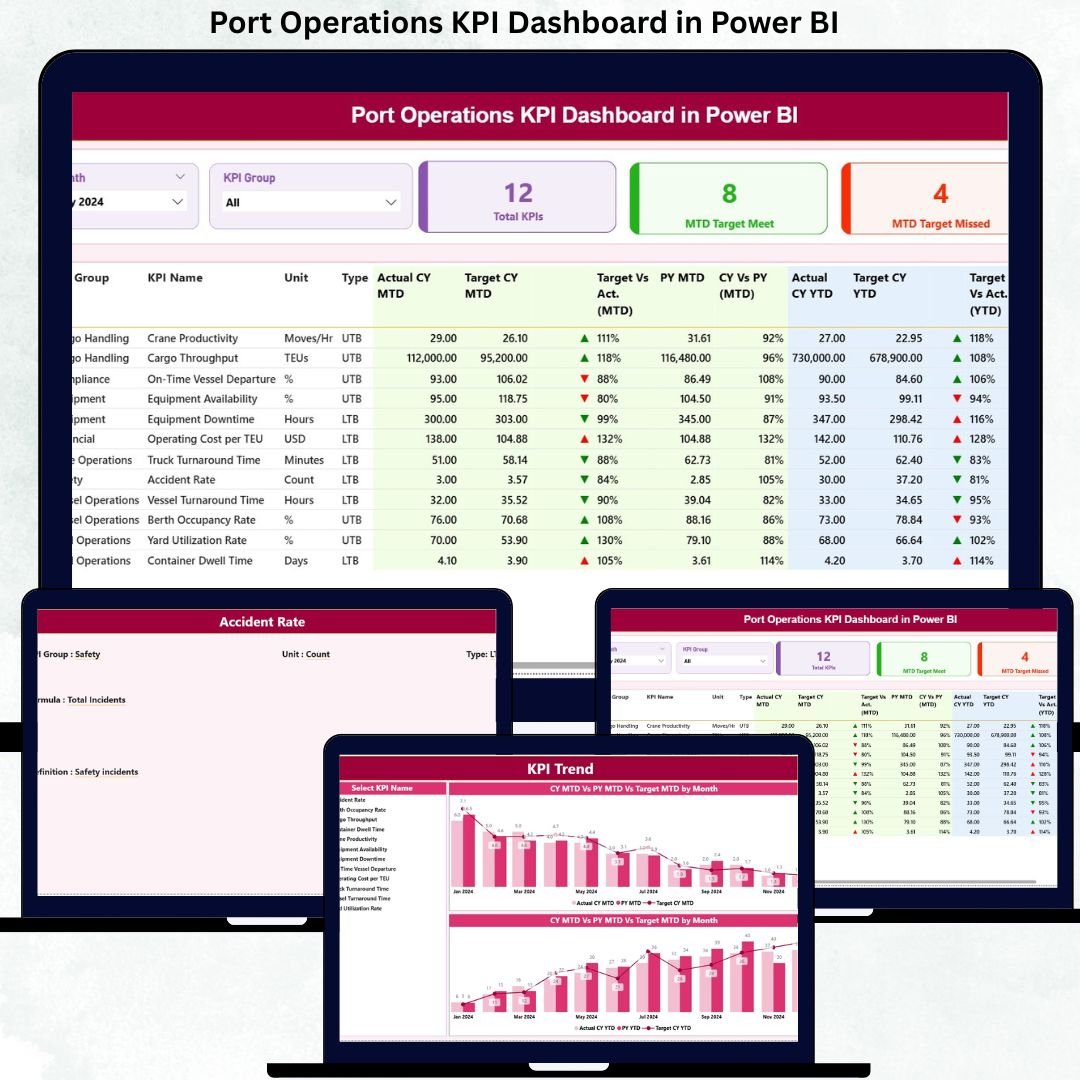
Port operations never slow down. Every delay, missed target, or inefficiency directly impacts vessel schedules, logistics costs, and customer satisfaction. That is why relying on manual reports or scattered spreadsheets is no longer enough. Port Operations KPI Dashboard in Power BI This is exactly where the Port Operations KPI Dashboard in Power BI becomes a game-changer for modern port management.
Port Operations KPI Dashboard in Power BI This ready-to-use Power BI dashboard helps port authorities, terminal operators, and logistics teams track operational performance with absolute clarity. Instead of guessing or waiting for delayed reports, you get real-time visibility into KPIs, targets, trends, and performance gaps—all in one interactive dashboard.
Built with Excel as the data source and Power BI as the visualization layer, this dashboard keeps things simple, flexible, and powerful. Even non-technical users can update data and analyze results confidently.
🚀 Key Features of Port Operations KPI Dashboard in Power BI
✅ Centralized KPI Monitoring – Track all port operation KPIs in one unified dashboard
✅ MTD & YTD Performance Tracking – Monitor short-term and long-term performance side by side
✅ Target vs Actual Comparison – Instantly identify KPIs that are meeting or missing targets
✅ LTB & UTB KPI Classification – Clear visibility for Lower-the-Better and Upper-the-Better KPIs
✅ Interactive Slicers – Filter by Month and KPI Group for focused analysis
✅ Trend Analysis Charts – Analyze MTD and YTD trends with year-over-year comparisons
✅ Excel-Based Data Input – Update data easily without complex Power BI modeling
✅ Drill-Through KPI Definitions – Understand formulas, logic, and KPI intent instantly
📦 What’s Inside the Port Operations KPI Dashboard in Power BI
This digital product includes a professionally designed Power BI file connected to a structured Excel data model.
🔹 Power BI Pages Included
📌 Summary Page

-
Month & KPI Group slicers
-
KPI cards showing Total KPIs, Target Met, and Target Missed
-
Detailed KPI performance table with MTD & YTD analysis
-
Conditional icons for quick performance status
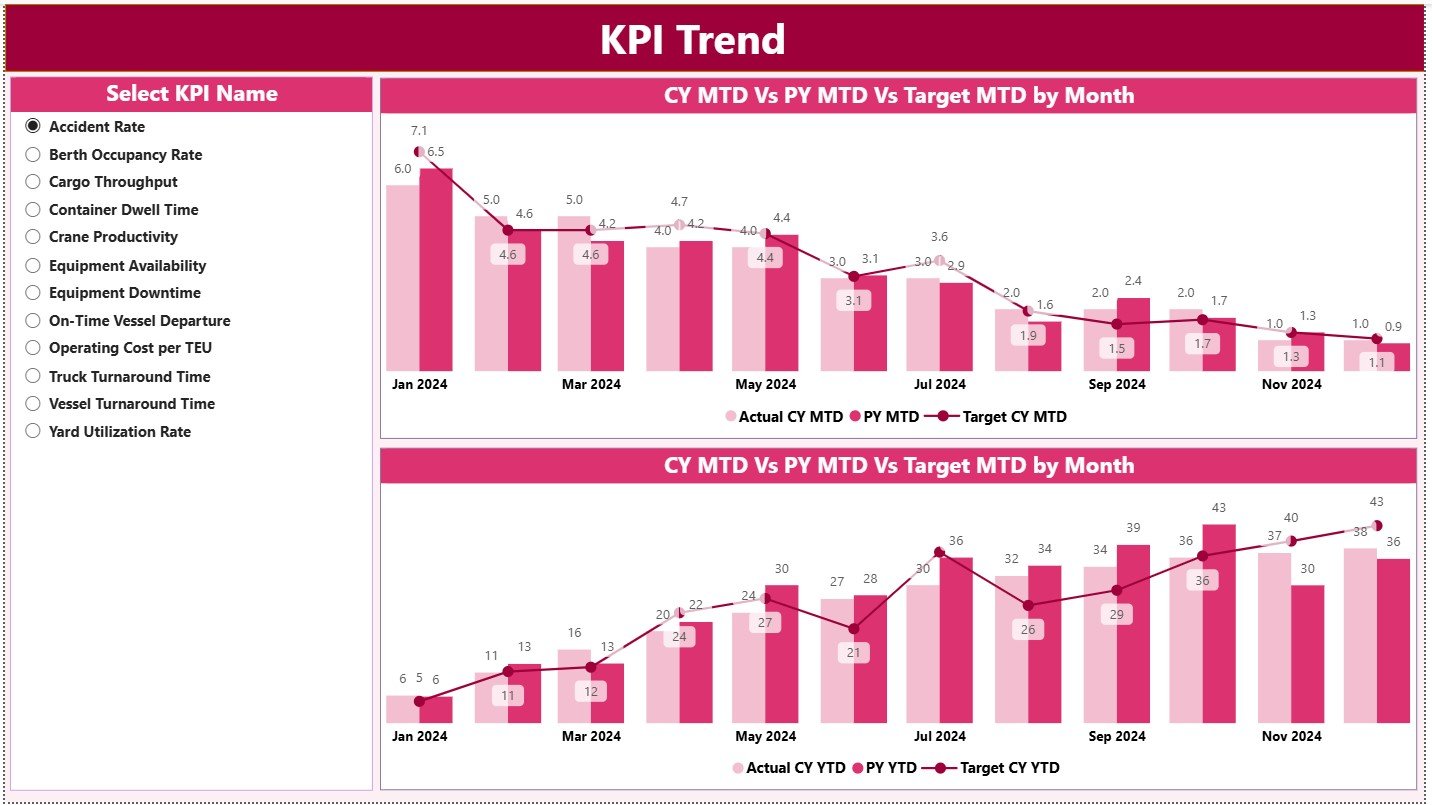
📌 KPI Trend Page
-
MTD trend combo chart
-
YTD trend combo chart
-
KPI selector to analyze individual KPI performance over time
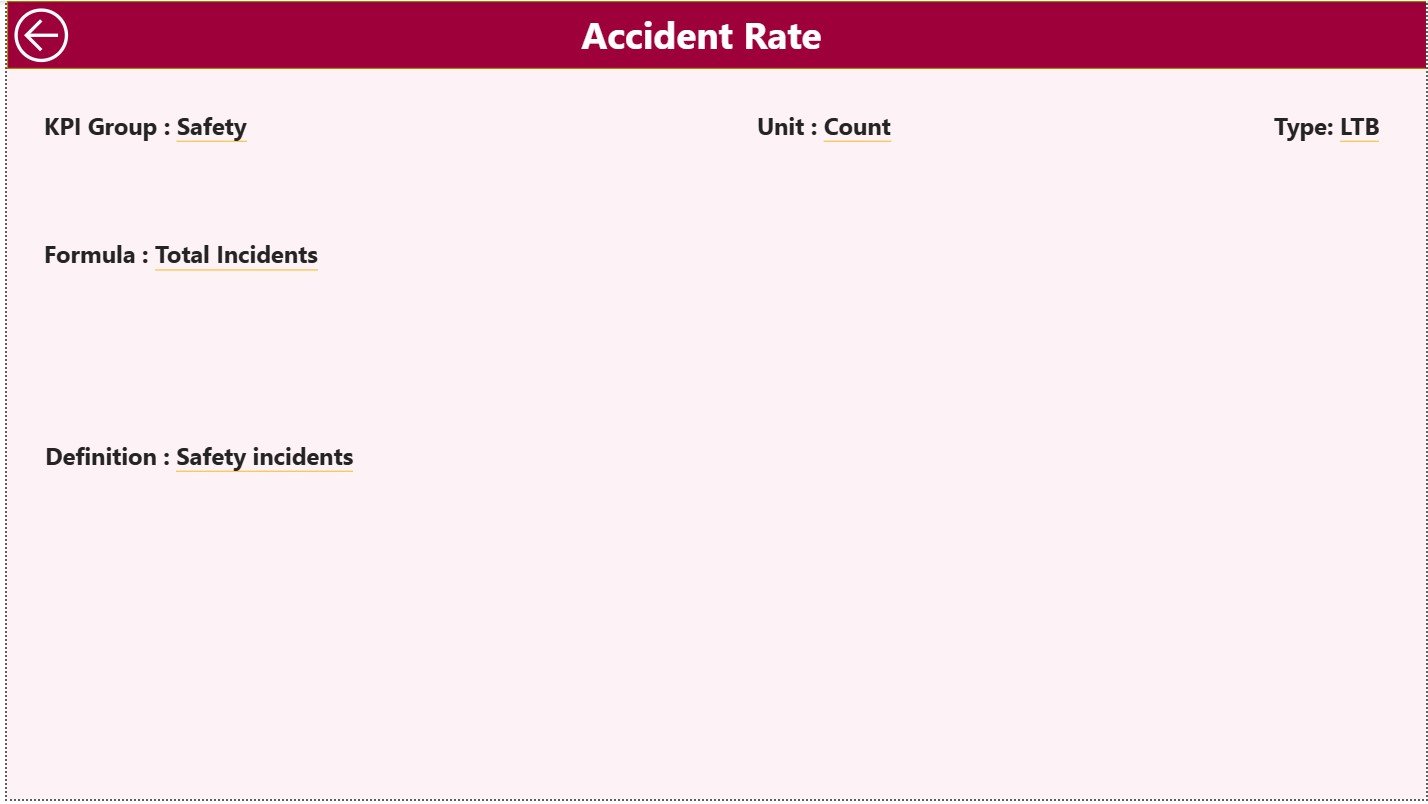
📌 KPI Definition (Drill-Through) Page
-
KPI Formula
-
KPI Definition
-
KPI Type (LTB / UTB)
-
Ensures transparency and governance
🔹 Excel Data Source Sheets
📊 Input Actual Sheet – Actual MTD & YTD performance
🎯 Input Target Sheet – Target MTD & YTD values
📘 KPI Definition Sheet – KPI number, group, unit, formula, and type
🧭 How to Use the Port Operations KPI Dashboard in Power BI
Using this dashboard is simple and efficient:
1️⃣ Enter actual performance data in the Input Actual Excel sheet
2️⃣ Update target values in the Input Target sheet
3️⃣ Define or modify KPIs in the KPI Definition sheet
4️⃣ Refresh the Power BI file
5️⃣ Analyze performance using slicers, tables, cards, and charts
No advanced Power BI skills required. If you know basic Excel, you can use this dashboard confidently.
👥 Who Can Benefit from This Port Operations KPI Dashboard in Power BI
🚢 Port Authorities – Monitor overall operational efficiency
⚓ Terminal Operations Managers – Track productivity and turnaround KPIs
📦 Logistics & Supply Chain Teams – Identify bottlenecks and delays
📈 Operations Analysts – Analyze trends and performance gaps
🏢 Senior Management & Executives – Make fast, data-driven decisions
Whether you manage a small terminal or a large port operation, this dashboard scales effortlessly.
📖 Click here to read the Detailed Blog Post
📺 Visit our YouTube channel to learn step-by-step video tutorials


Reviews
There are no reviews yet.