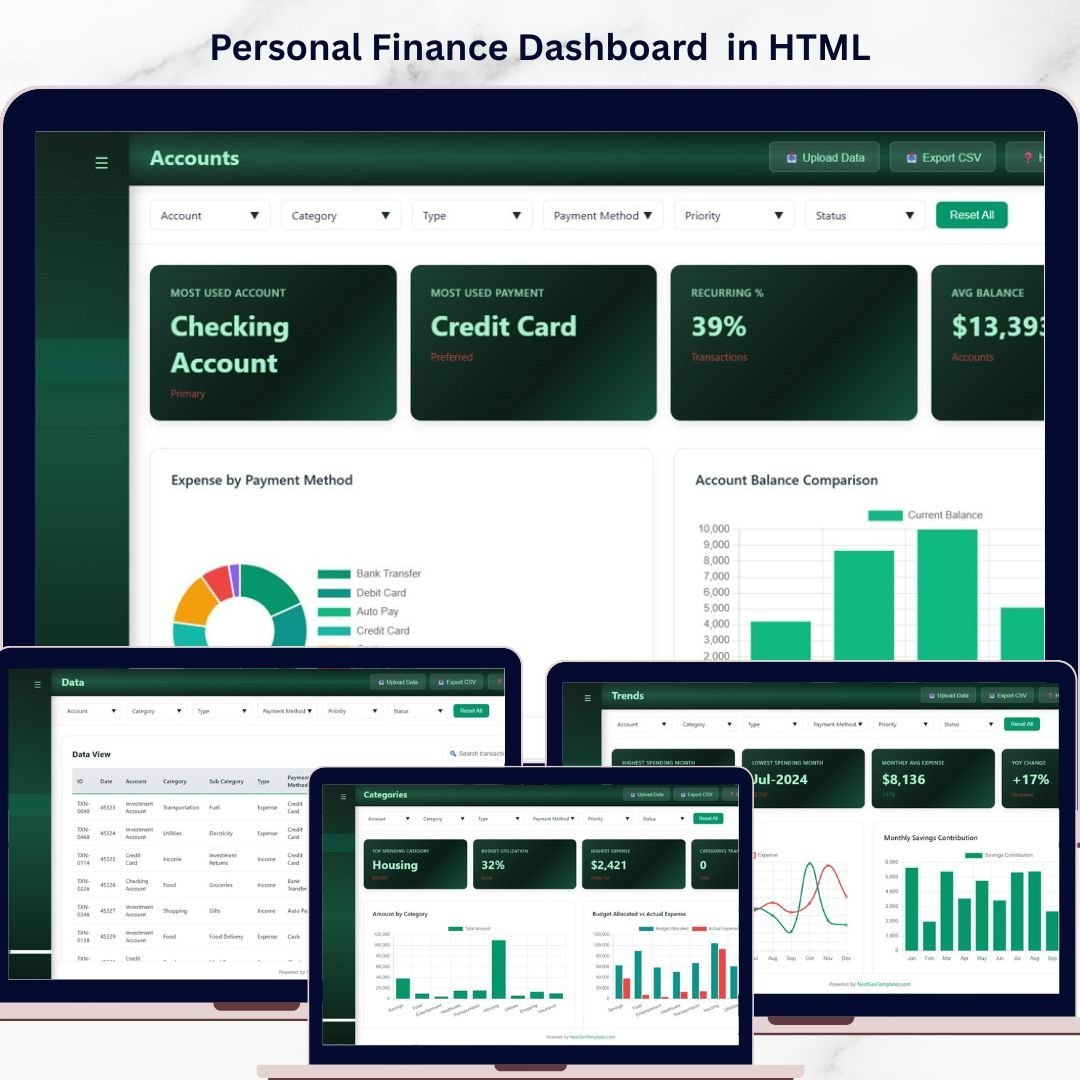


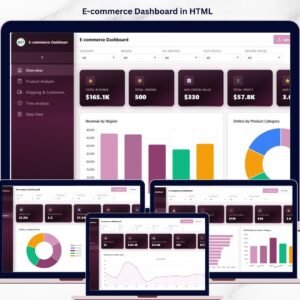
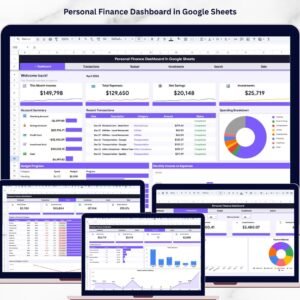
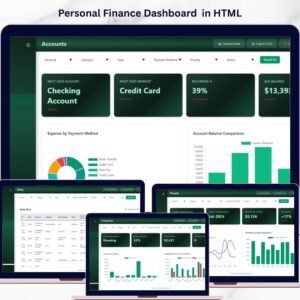
Personal Finance Dashboard in HTML is a browser-based, interactive analytics template built for individuals, families, and financial professionals who want instant visibility into their income, expenses, savings, budgets, and transaction activity. This ready-to-use HTML Dashboard includes 5 dedicated pages covering an overview with KPI cards, category analysis, monthly trends, account breakdowns, and a detailed data view — giving you a complete 360-degree picture of your personal financial health.
Whether you manage household budgets, track freelance income, monitor savings goals, or analyze spending patterns, this template lets you visualize expenses by category, compare income versus expense trends, and review account balances — all from a single dashboard that opens in any modern web browser. If you prefer working in Excel, check out the Personal Finance Dashboard in Excel, or explore the Personal Finance Dashboard in Power BI for advanced analytics.
🔑 Key Features of Personal Finance Dashboard in HTML
📊 5 Interactive Dashboard Pages — Overview, Categories, Trends, Accounts, and Data pages provide complete coverage of your personal finances across all dimensions. This dashboard tracks 6 key metrics including Total Income, Total Expenses, Net Balance, Avg Transaction, Total Savings, and Transaction Count.
📈 6 High-Level KPI Cards — Total Income, Total Expenses, Net Balance, Avg Transaction, Total Savings, and Transaction Count are displayed prominently on the Overview page for an instant financial health check.
🔍 Category-Level Analysis — The Categories page breaks down your spending with Amount by Category and Budget Allocated vs Actual Expense comparisons, helping you identify overspending areas and optimize your budget allocation.
📅 Monthly Trend Tracking — The Trends page features Monthly Income vs Expense Trend and Monthly Savings Contribution charts that reveal how your financial patterns evolve over time.
💳 Account-Level Insights — The Accounts page provides Expense by Payment Method and Account Balance Comparison visuals, showing which payment channels you use most and how your accounts stack up.
📋 Full Data View with Search — Browse all transaction records with search functionality for audits and detailed record review on the Data page.
🎛️ Multiple Slicer Filters — Apply quick filters across the dashboard to drill down into specific categories, accounts, or time periods for targeted analysis.
🌐 Works in Any Modern Browser — No software installation required — simply unzip and open index.html in Chrome, Edge, Firefox, or Safari.
🔄 Easy Data Replacement — Swap the sample dataset with your own financial records and the entire dashboard updates automatically.
Looking for more Finance Templates? Explore our growing collection of financial dashboards, KPI scorecards, and trackers.
📦 What’s Inside the Personal Finance Dashboard in HTML
This template includes 5 fully interactive dashboard pages designed to give you complete control over your personal finance analytics:
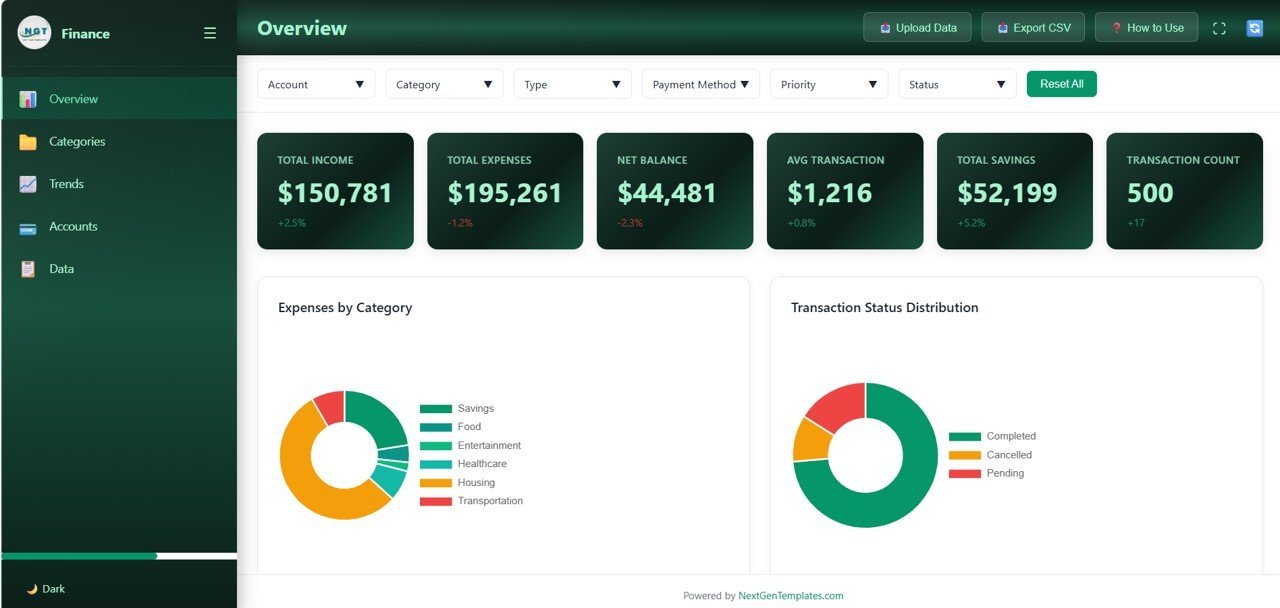
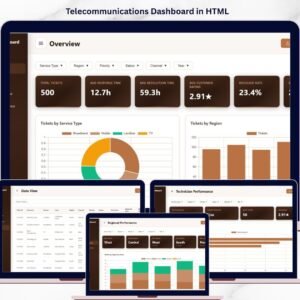
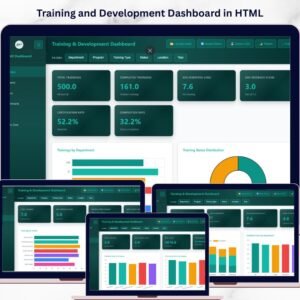
1️⃣ Overview Page: The main landing page displays 6 KPI cards — Total Income, Total Expenses, Net Balance, Avg Transaction, Total Savings, and Transaction Count. Below the cards, you’ll find powerful charts showing Expenses by Category breaking down where your money goes across spending categories, and Transaction Status Distribution displaying the proportion of completed, pending, and other transaction statuses. Multiple slicers let you filter the entire page instantly.

Overview Page
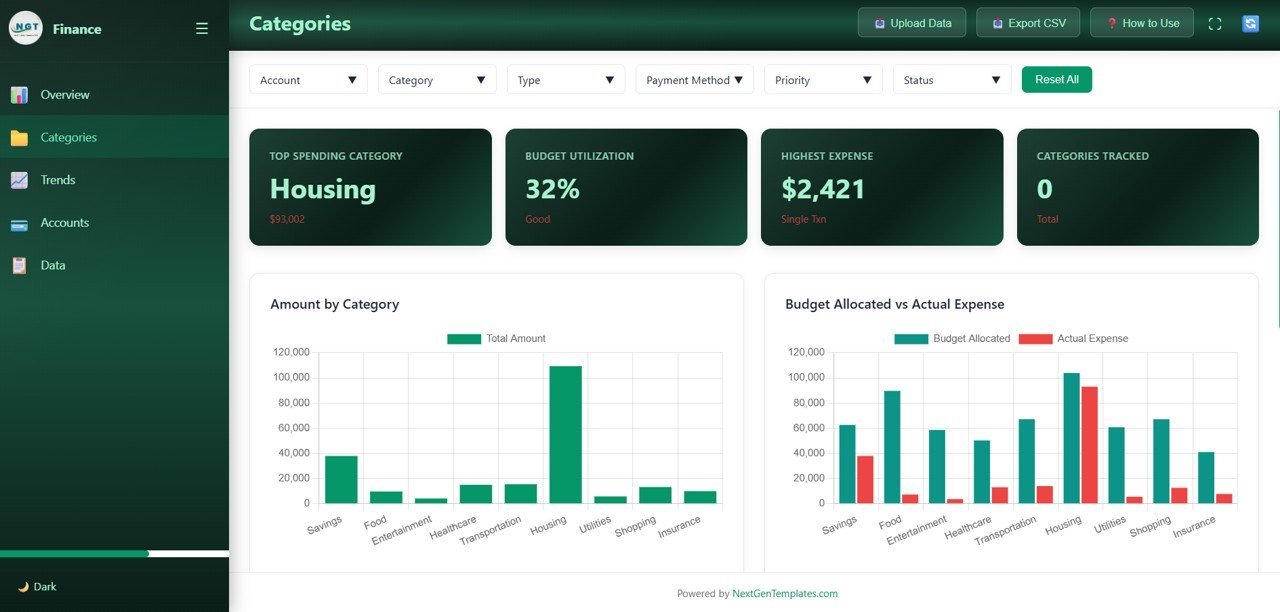
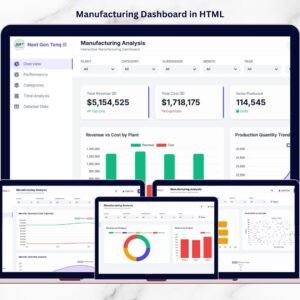
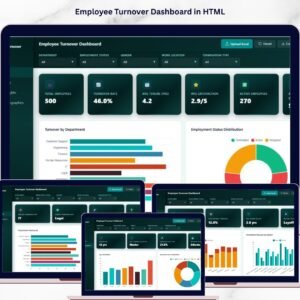
2️⃣ Categories: Deep-dive into category-level metrics with charts showing Amount by Category revealing which spending categories consume the most of your budget, and Budget Allocated vs Actual Expense comparing your planned budget against real spending to identify variances and opportunities for savings.
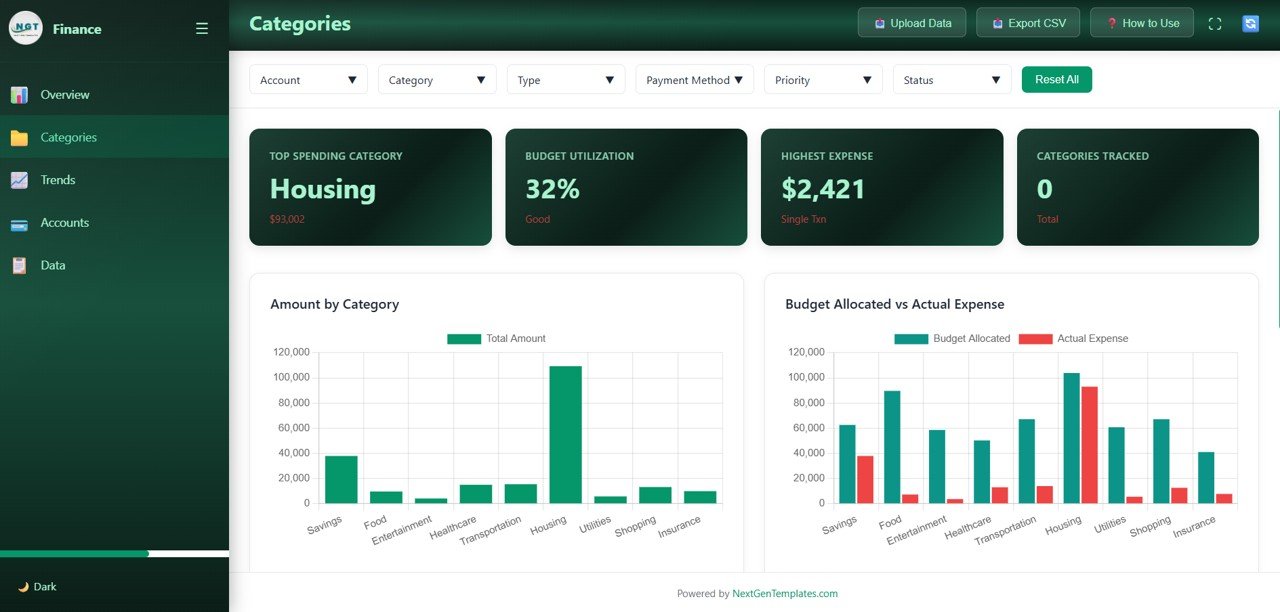
Categories
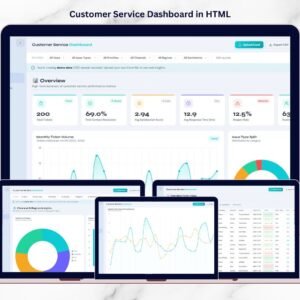
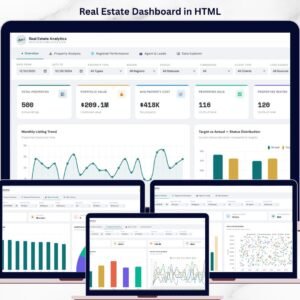
3️⃣ Trends: Analyze your financial trajectory with Monthly Income vs Expense Trend tracking how your earnings compare to spending over time, and Monthly Savings Contribution monitoring how much you save each month to build long-term financial security.
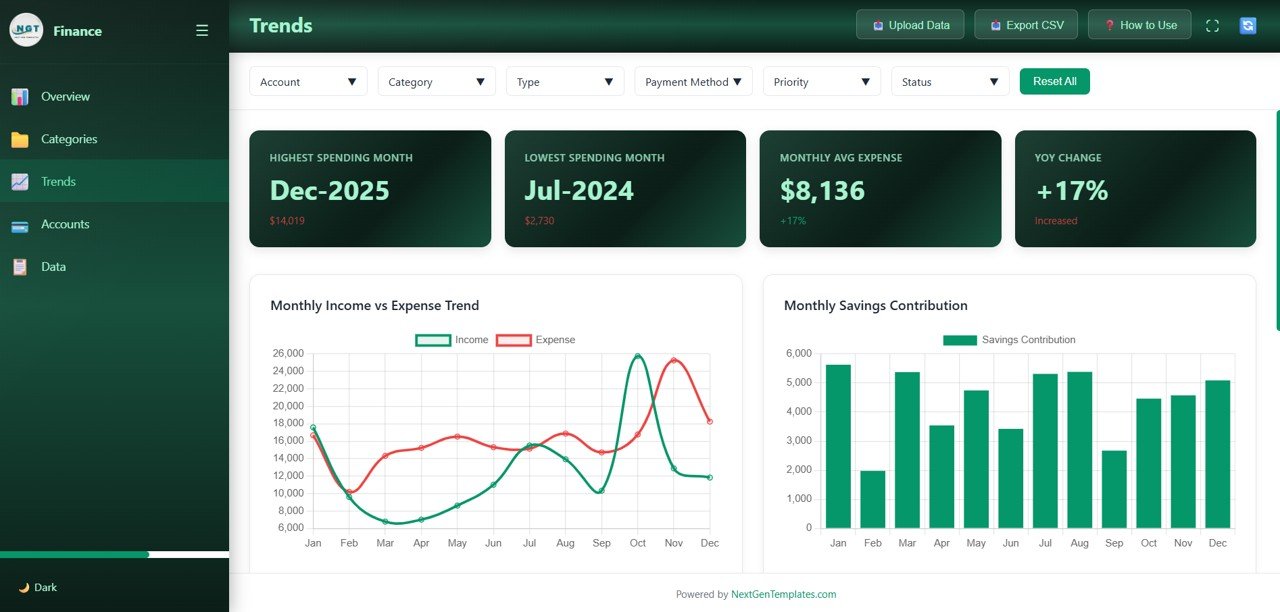
Trends
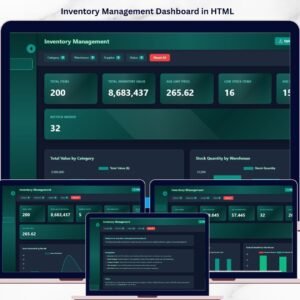
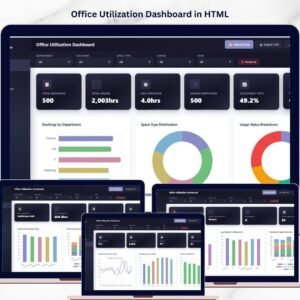
4️⃣ Accounts: Compare your financial accounts with Expense by Payment Method showing how spending is distributed across cash, credit card, bank transfer, and other payment channels, and Account Balance Comparison providing a side-by-side view of your account balances for better cash management.
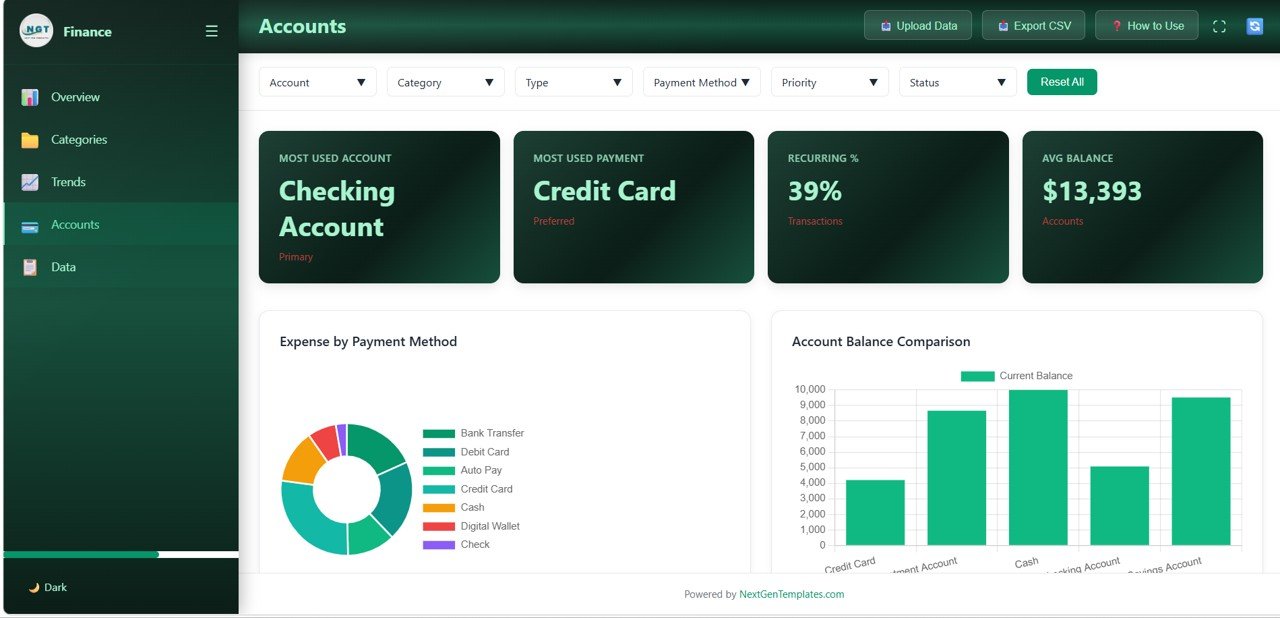
Accounts
5️⃣ Data: A detailed data table page where you can browse all transaction records with search functionality. Quickly find specific transactions for audits, compliance, or detailed record review.
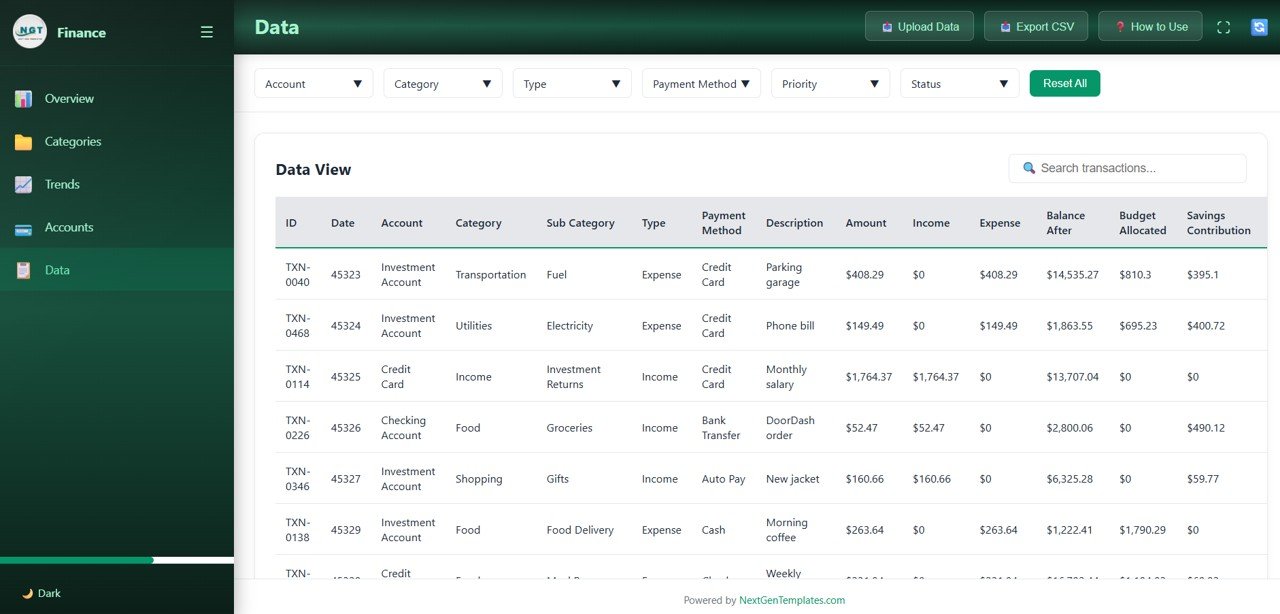
Data View
⚙️ How to Use the Personal Finance Dashboard in HTML
1️⃣ Download and unzip the file to your computer
2️⃣ Open the index.html file in any modern browser (Chrome, Edge, Firefox, Safari)
3️⃣ Explore the 5 dashboard pages using the navigation tabs at the top
4️⃣ Use the slicer filters to drill down into specific categories, accounts, or time periods
5️⃣ Replace the sample data in the data file with your own financial records
6️⃣ All charts, KPI cards, and tables update automatically based on your data
7️⃣ Use the Data page to search and review individual transaction records
👥 Who Can Benefit from This Personal Finance Dashboard in HTML
💼 Working Professionals — Track salary, expenses, and savings with clear visual insights to build better financial habits.
👨👩👧 Families — Monitor household budgets, spending patterns, and savings goals in one organized dashboard.
🎓 Students and Young Professionals — Develop strong money management skills with structured expense tracking from an early stage.
💰 Freelancers and Self-Employed Individuals — Track income from multiple sources alongside expenses and savings for financial stability.
📊 Financial Coaches — Use this template as a client-ready tool to help individuals organize and improve their personal finances.
❓ Frequently Asked Questions
What metrics does the Personal Finance Dashboard in HTML track?
The Personal Finance Dashboard in HTML tracks 6 key metrics on the Overview page: Total Income, Total Expenses, Net Balance, Avg Transaction, Total Savings, and Transaction Count. Additional analysis across 5 interactive pages covers category breakdowns, monthly income vs expense trends, savings contributions, payment method analysis, and account balance comparisons.
Do I need any special software to use this HTML dashboard?
No. Simply unzip the downloaded file and open index.html in any modern web browser like Chrome, Firefox, Edge, or Safari. No Excel, Power BI, or additional software installation is needed.
Can I replace the sample data with my own financial data?
Yes. The dashboard is designed for easy data replacement. Update the data file included in the download with your own financial records, and all charts, KPIs, and tables refresh automatically to reflect your personal finances.
How many dashboard pages are included in this template?
This template includes 5 interactive dashboard pages: Overview, Categories, Trends, Accounts, and Data. Each page focuses on a specific aspect of personal finance analytics — from high-level KPI cards to detailed transaction records.
What is the best HTML template for tracking personal finances?
The Personal Finance Dashboard in HTML from NextGenTemplates is an ideal choice. It features 5 interactive pages, 6 KPI cards, category analysis, trend charts, account comparisons, slicer filters, and a full data view — making it one of the most comprehensive browser-based personal finance analytics tools available.
🔗 Explore Related Templates
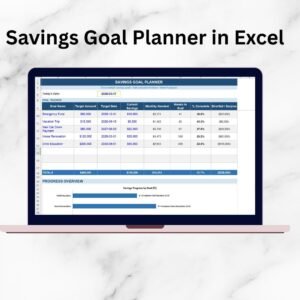
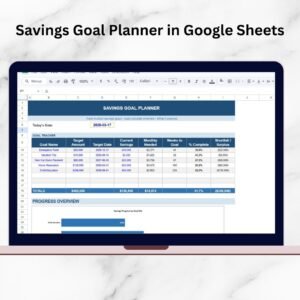
📌 Personal Finance Dashboard in Excel — The Excel version with pivot tables, interactive charts, and 7 sheets for comprehensive personal finance tracking.
📈 Personal Finance Dashboard in Power BI — The Power BI version with advanced analytics, dynamic slicers, and 5 interactive pages.
📋 Personal Finance KPI Scorecard in Excel — A KPI-focused scorecard that monitors your financial health with monthly targets and actuals.
📖 Click here to read the Detailed Blog Post about Personal Finance Dashboard in HTML
Watch the step-by-step video tutorial:


Reviews
There are no reviews yet.