
Running a modern pathology lab is no longer limited to processing samples and issuing reports. Today, lab owners and managers must constantly monitor pending tests, turnaround time, delayed reports, revenue trends, test costs, and city-wise performance. However, when this data is spread across multiple Excel files or manual reports, visibility reduces and decisions slow down.
That is exactly where the Pathology Labs Dashboard in Excel becomes a powerful operational intelligence tool 🚀.
The Pathology Labs Dashboard in Excel is a ready-to-use, interactive Excel dashboard that converts raw pathology data into clear KPIs, automated charts, and real-time insights. Instead of compiling daily MIS reports, lab teams can instantly analyze performance with a few clicks.
Because this solution is built entirely in Microsoft Excel, it offers professional analytics without expensive BI tools or technical complexity. Lab owners gain full control over operations while saving time, reducing errors, and improving reporting accuracy.
✅ Key Features of Pathology Labs Dashboard in Excel
🧪 Pending & Delayed Test Monitoring – Identify bottlenecks instantly
⏱️ Turnaround Time Analysis – Track lab-wise efficiency
💰 Revenue & Cost Tracking – Monitor financial performance
🏙️ City-Wise Performance Insights – Compare geographic results
📅 Monthly Trends Analysis – Identify seasonal and growth patterns
📊 KPI Cards for Instant Visibility – Performance at a glance
🔍 Interactive Slicers – Filter data dynamically
📁 100% Excel-Based & Customizable – No coding required
📦 What’s Inside the Pathology Labs Dashboard in Excel
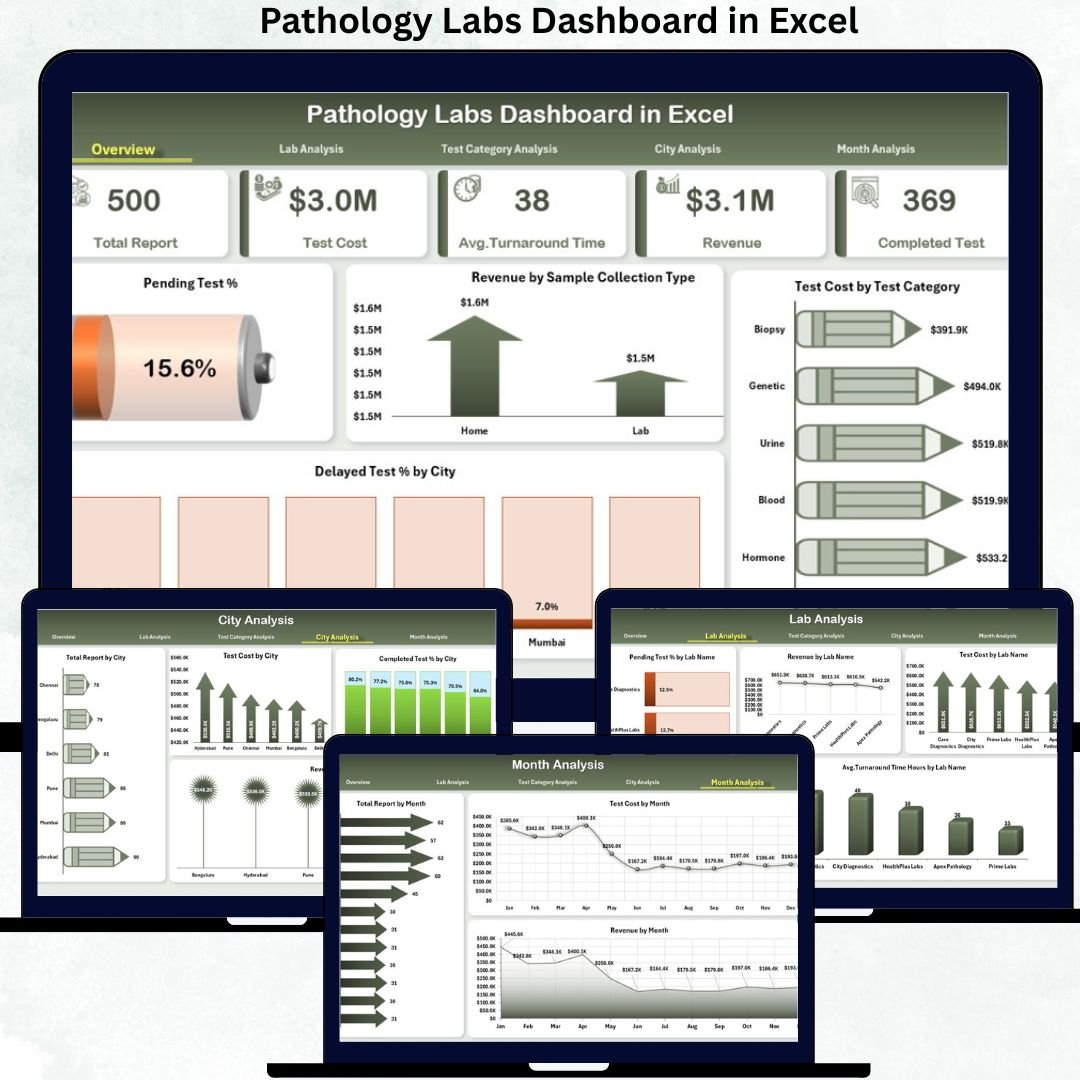
✅ Overview Page – Executive Performance Snapshot
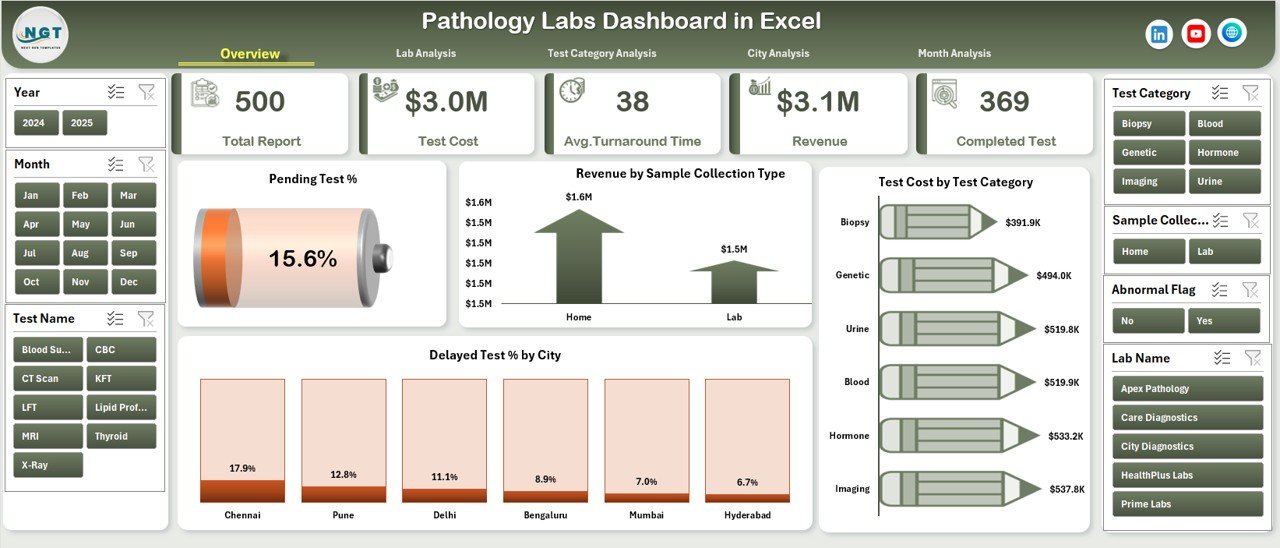
This is the intelligence hub of the dashboard.
Highlights
-
Right-side slicers for instant filtering
-
5 KPI cards for quick decision-making
-
4 high-impact analytical charts
Charts Included
-
📉 Pending Test %
-
💵 Revenue by Sample Collection Type
-
🧾 Test Cost by Test Category
-
🌍 Delayed Test % by City
➡️ This page allows management to detect operational risks and revenue patterns within seconds.
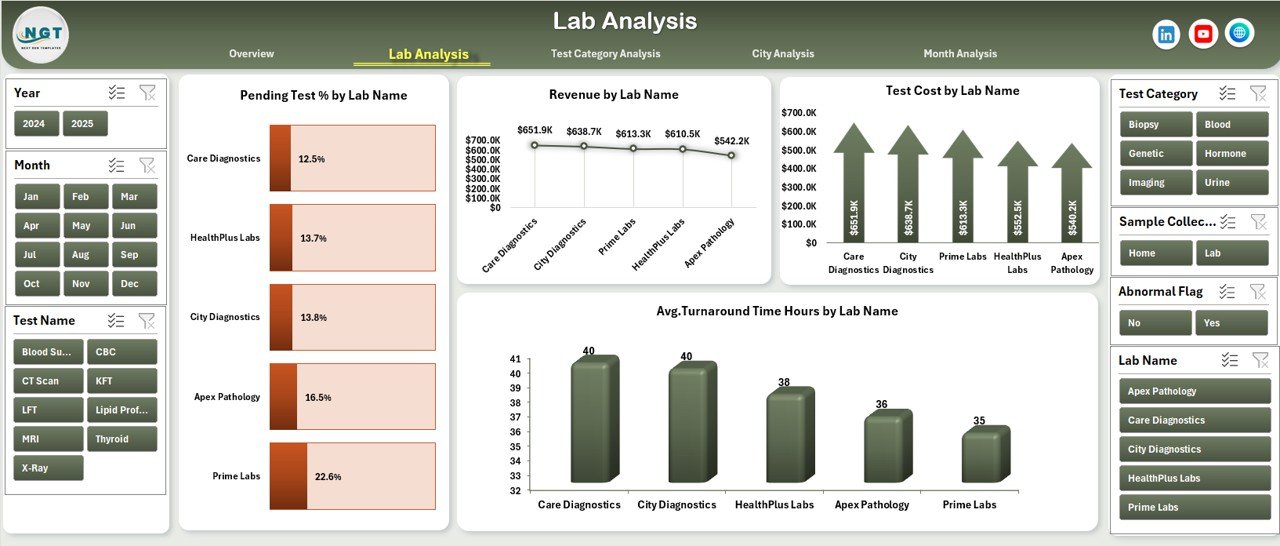
✅ Lab Analysis Page
Compares performance across different labs.
Charts Included
-
Pending Test % by Lab Name
-
Revenue by Lab Name
-
Test Cost by Lab Name
-
Average Turnaround Hours by Lab Name
Business Value
✅ Identify inefficient labs
✅ Improve turnaround time
✅ Optimize resource allocation
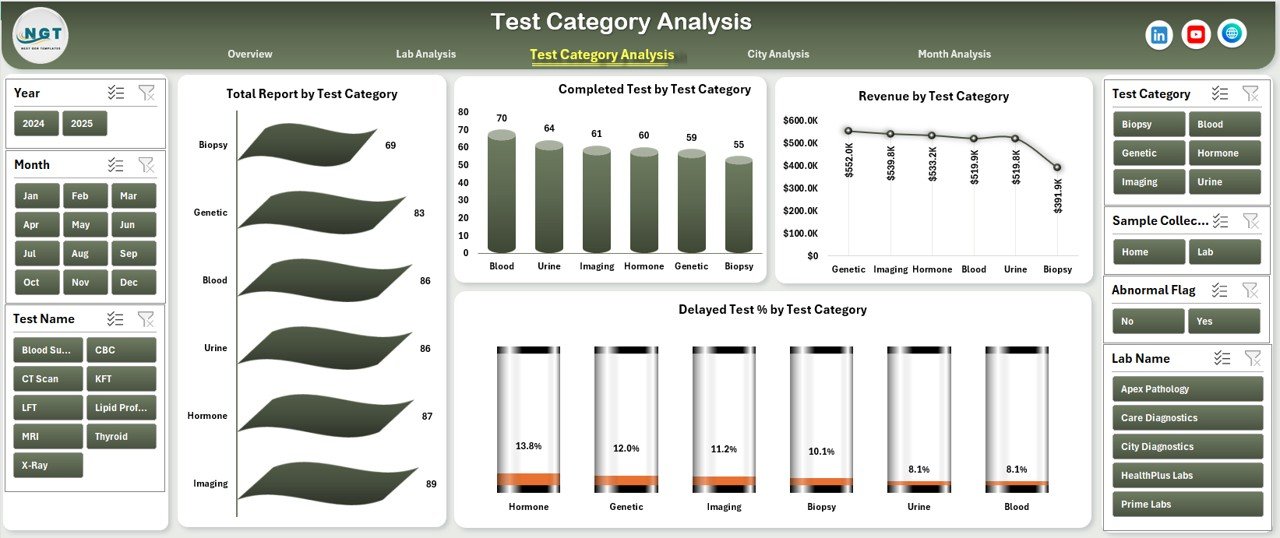
✅ Test Category Analysis Page
Provides test-wise operational and financial insights.
Charts Included
-
Total Reports by Test Category
-
Completed Tests by Test Category
-
Revenue by Test Category
-
Delayed Test % by Test Category
✅ Optimize test pricing
✅ Improve lab workflow planning
✅ Balance cost vs volume
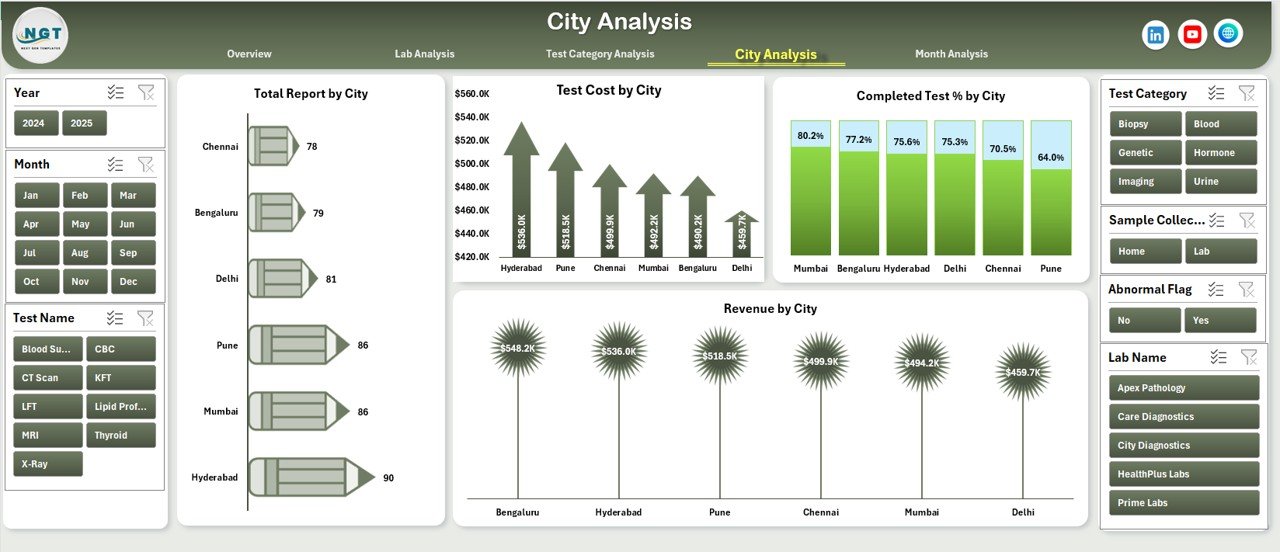
✅ City Analysis Page
Tracks city-level demand, cost, and completion rates.
Charts Included
-
Total Reports by City
-
Test Cost by City
-
Revenue by City
-
Completed Test % by City
✅ Supports city expansion strategy
✅ Improves regional staffing decisions
✅ Month Analysis Page
Helps understand demand cycles and financial trends.
Charts Included
-
Total Reports by Month
-
Test Cost by Month
-
Revenue by Month
✅ Supports demand forecasting
✅ Improves budget planning
🛠️ How to Use the Pathology Labs Dashboard
1️⃣ Enter lab data in the structured Data Sheet
2️⃣ Refresh pivot tables
3️⃣ Use slicers to filter by lab, test category, city, or month
4️⃣ Track pending tests, delays, revenue, and cost
5️⃣ Share insights with operations and finance teams
✔ No VBA
✔ No advanced Excel skills required
👥 Who Can Benefit from This Dashboard
🏥 Pathology Lab Owners
📊 Lab Operations Managers
💼 Finance & Billing Teams
🧪 Quality & Compliance Teams
🌍 Regional Lab Managers
If you manage diagnostic lab operations, this dashboard becomes your daily decision-making companion.
🚀 Why This Dashboard Is a Smart Investment
✅ Eliminates manual reporting
✅ Improves turnaround visibility
✅ Identifies delayed tests early
✅ Strengthens revenue tracking
✅ Saves time and effort
✅ Works with existing Excel workflows
This dashboard turns raw pathology data into actionable lab intelligence.
📘 Click here to read the Detailed blog post
🎥 Visit our YouTube channel to learn step-by-step video tutorials
👉 https://youtube.com/@PKAnExcelExpert


Reviews
There are no reviews yet.