
Managing a paediatrics clinic is not just about patient care—it’s about making the right decisions at the right time. However, when your data is scattered across multiple sheets, reports become slow, and insights get lost. That’s exactly why you need the Paediatrics Clinics KPI Dashboard in Power BI 🚀
This powerful and ready-to-use dashboard helps you track clinic performance, monitor patient care quality, and make data-driven decisions instantly. Instead of wasting time on manual reports, you get a centralized and interactive view of all your key performance indicators (KPIs).
With real-time analytics and dynamic visuals, this dashboard transforms your clinic data into actionable insights. As a result, you can improve efficiency, reduce errors, and enhance patient outcomes.
🚀 Key Features of Paediatrics Clinics KPI Dashboard in Power BI
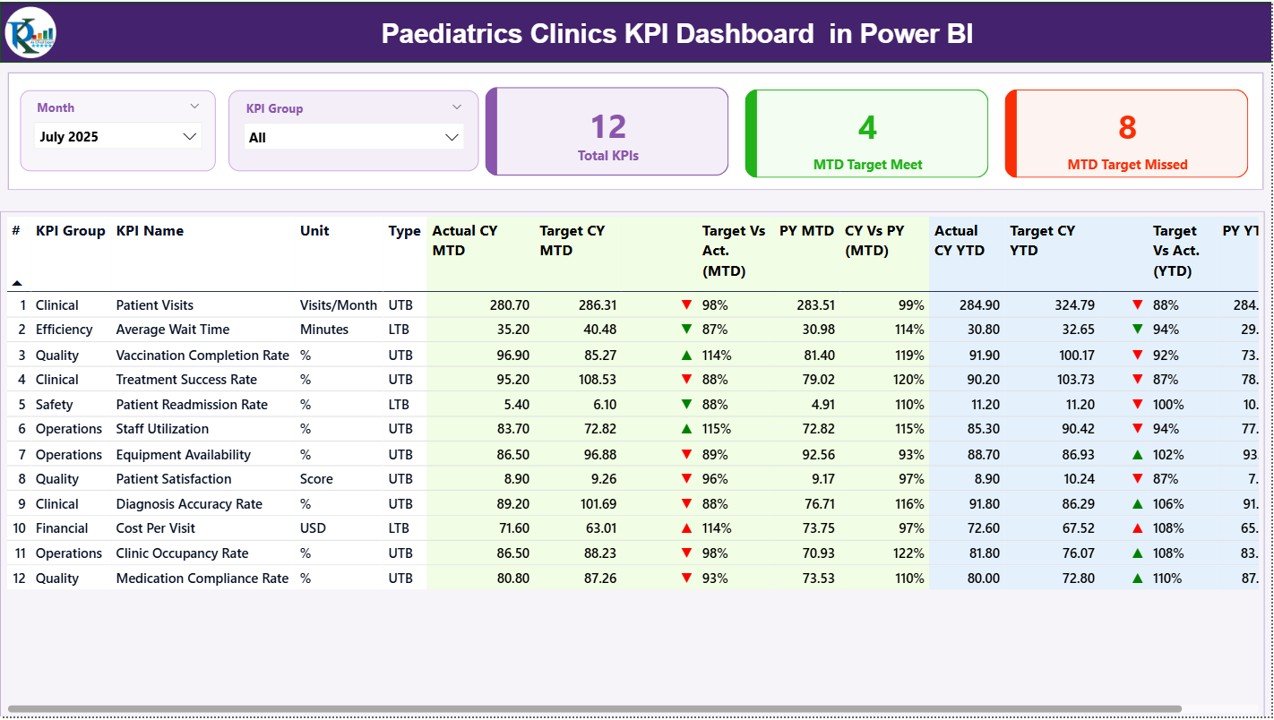
✨ Interactive Summary Dashboard – Get a complete overview of KPIs in one place with dynamic slicers and KPI cards.
📊 MTD & YTD Performance Tracking – Compare actual vs target and previous year data effortlessly.
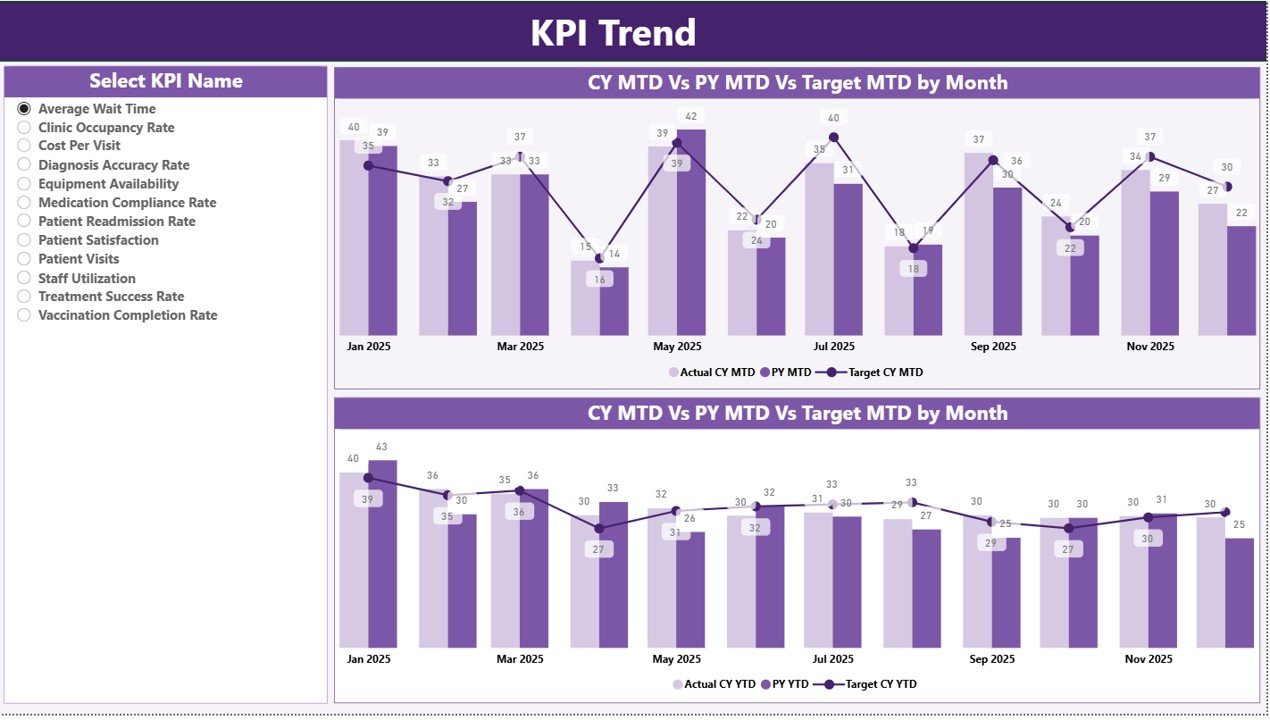
📈 Trend Analysis Page – Visualize KPI performance trends using powerful combo charts.
🎯 KPI Selection Slicer – Focus on specific KPIs and analyze detailed performance instantly.
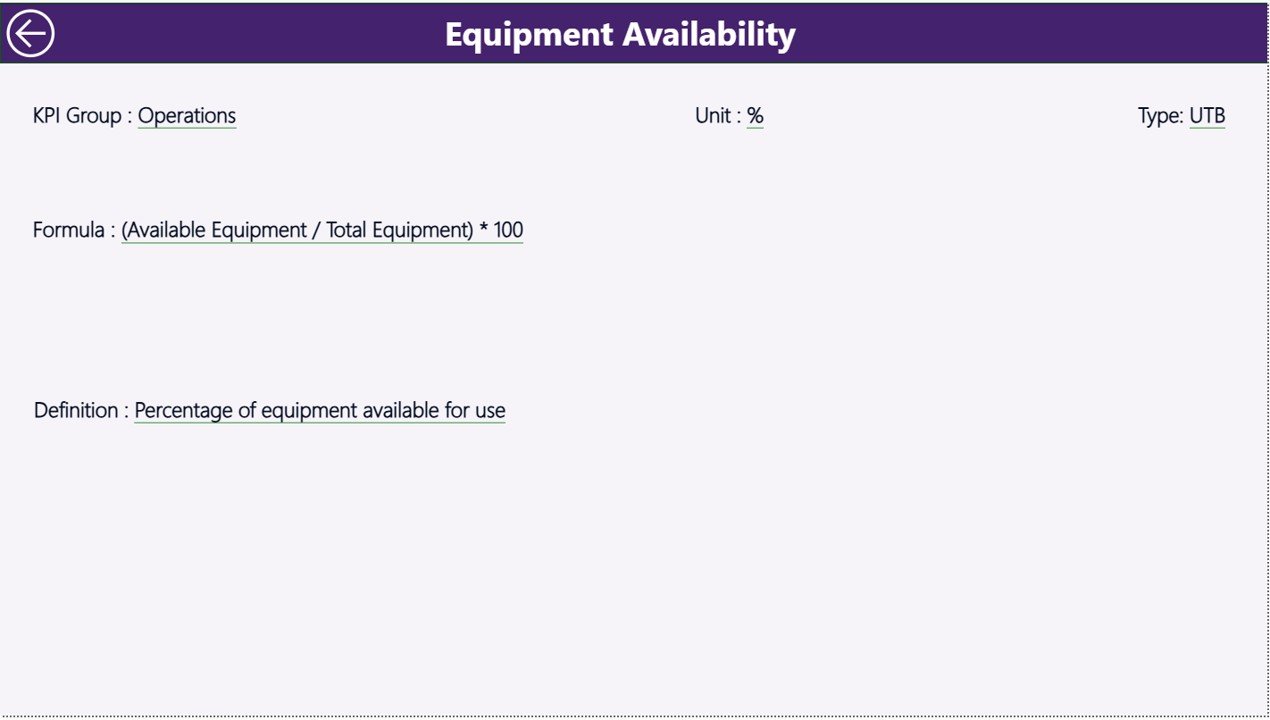
📌 Drill-Through KPI Definition Page – Understand KPI formulas, logic, and definitions clearly.
🔄 Real-Time Data Updates – Refresh data easily and view updated insights instantly.
📉 Performance Indicators (▲▼) – Identify good and poor performance quickly with visual indicators.
📊 Excel-Based Data Integration – Easily manage data using structured Excel sheets.
⚡ User-Friendly Interface – Designed for healthcare professionals with simple navigation.
📦 What’s Inside the Paediatrics Clinics KPI Dashboard in Power BI
📁 Fully designed Power BI Dashboard File (.pbix)
📊 pre-built 3 Interactive Pages:
-
Summary Dashboard
-
KPI Trend Analysis
-
KPI Definition (Drill-through)
📑 Structured Excel Data Templates:
-
Input Actual Data Sheet
-
Input Target Data Sheet
-
KPI Definition Sheet
📘 Ready-to-use KPI Framework for Paediatrics Clinics
🎯 Pre-configured Charts, KPIs, and Slicers
⚙️ How to Use the Paediatrics Clinics KPI Dashboard in Power BI
Using this dashboard is simple and efficient 👇
1️⃣ Enter your data in the Excel input sheets (Actual, Target, KPI Definition)
2️⃣ Load the data into Power BI
3️⃣ Refresh the dashboard
4️⃣ Use slicers to filter by Month or KPI Group
5️⃣ Analyze KPI performance (MTD & YTD)
6️⃣ Review trend charts for insights
7️⃣ Drill through for detailed KPI understanding
8️⃣ Take data-driven actions to improve clinic performance
Because of its simple workflow, anyone can start using it quickly—even without advanced technical skills.
👨⚕️ Who Can Benefit from This Paediatrics Clinics KPI Dashboard in Power BI
🏥 Paediatrics Clinics & Hospitals
👩⚕️ Healthcare Administrators
📊 Clinic Managers & Operations Teams
📈 Healthcare Analysts
💼 Medical Consultants
This dashboard is perfect for anyone who wants to improve clinic performance, track KPIs effectively, and deliver better patient care.
📖 Click here to read the Detailed blog post
🎥 Visit our YouTube channel to learn step-by-step video tutorials
👉 https://youtube.com/@PKAnExcelExpert


