Managing outsourced accounting operations requires constant monitoring of performance, productivity, deadlines, and financial accuracy. Accounting outsourcing firms handle multiple tasks such as accounts payable, accounts receivable, payroll processing, bookkeeping, financial reporting, tax preparation, and compliance monitoring. When these operations generate large volumes of financial data, it becomes difficult for managers to track performance using traditional spreadsheets or manual reports.
This is where the Outsourced Accounting KPI Dashboard in Excel becomes an extremely valuable analytical solution.
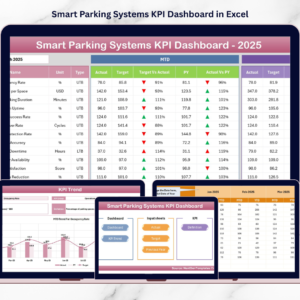
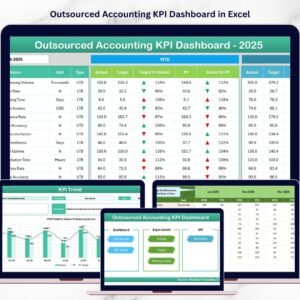
The Outsourced Accounting KPI Dashboard in Excel is a ready-to-use performance monitoring tool designed to help finance leaders, accounting outsourcing companies, and CFOs track operational efficiency and service quality. It converts complex accounting data into clear visual insights that help organizations evaluate productivity, monitor accuracy, and ensure compliance with financial processes.
Because Excel provides powerful tools such as pivot tables, charts, slicers, formulas, and automated comparisons, organizations can easily transform raw accounting data into interactive KPI dashboards. As a result, managers gain full visibility into outsourced accounting operations and make faster data-driven decisions.
📊 Key Feature of Outsourced Accounting KPI Dashboard in Excel
This dashboard includes powerful features designed to monitor outsourced accounting performance effectively.
📈 Centralized KPI Monitoring – Track all accounting performance indicators in one interactive dashboard.
📊 Month-to-Date (MTD) and Year-to-Date (YTD) Tracking – Compare current performance with targets and previous year results.
📉 Target vs Actual Performance Analysis – Evaluate whether accounting teams achieve defined KPI targets.
📅 Monthly Performance Monitoring – Analyze accounting performance month by month using drop-down selection.
📊 KPI Trend Analysis – Track historical trends of each KPI using interactive charts.
⚙️ Automated Conditional Formatting Indicators – Up and down arrows highlight performance improvements or declines.
📂 Structured KPI Documentation – Store KPI definitions, formulas, and measurement units in a dedicated sheet.
🔎 Interactive Excel Analytics – Use filters, slicers, and pivot charts to explore accounting performance.
📊 Historical Performance Comparison – Compare current results with previous year benchmarks.
⚡ Automatic Dashboard Updates – Refresh data to instantly update charts and KPI indicators.
Because of these features, finance teams can quickly identify operational issues, track team productivity, and improve accounting service quality.
📦 What’s Inside the Outsourced Accounting KPI Dashboard in Excel
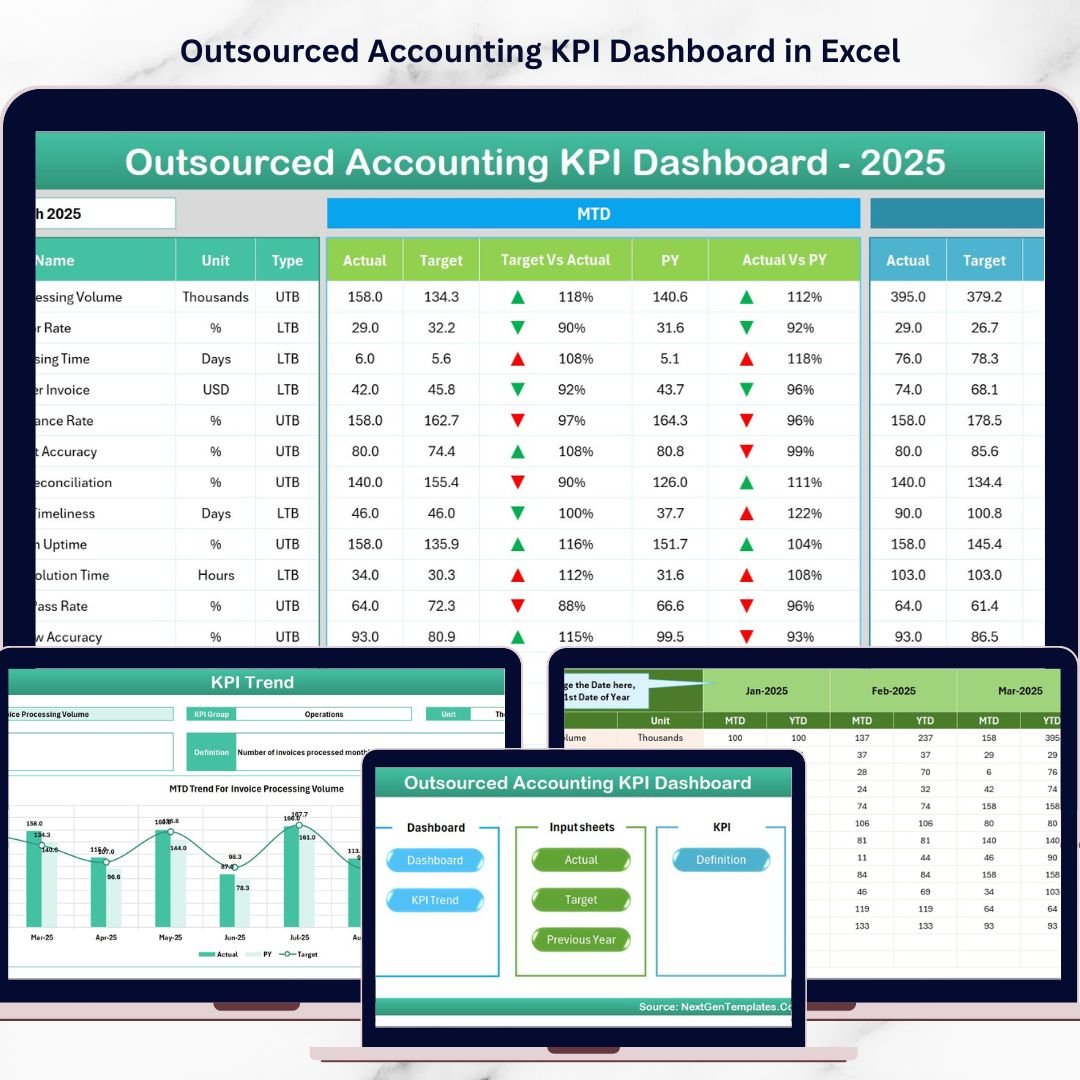
This dashboard contains seven structured worksheets that organize data, calculations, and performance analysis.
Home Sheet
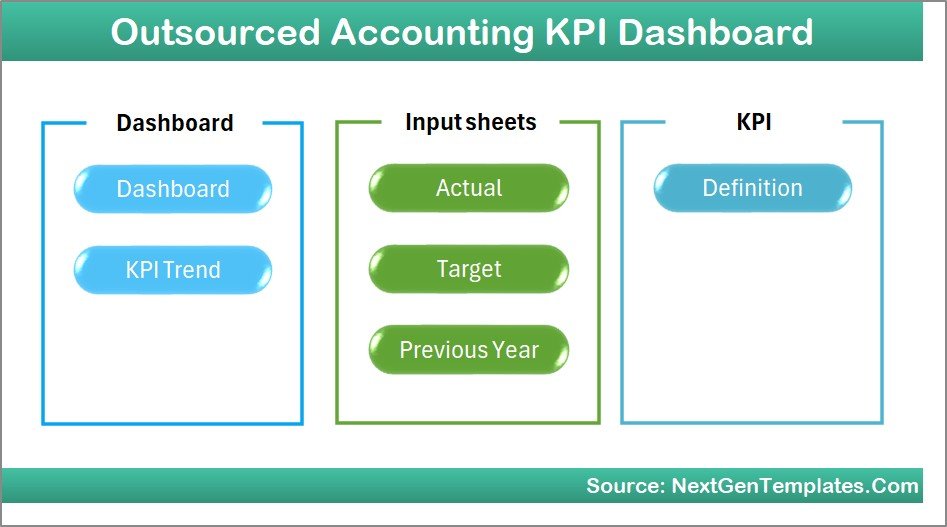
The Home Sheet acts as the navigation hub of the dashboard.
Key highlights include:
• Simple dashboard index
• Six navigation buttons
• One-click access to different sheets
This structure makes the dashboard easy to use and improves navigation efficiency.
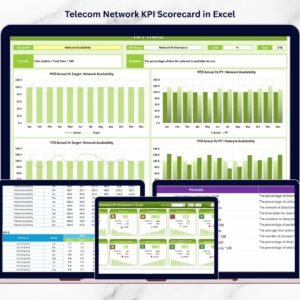
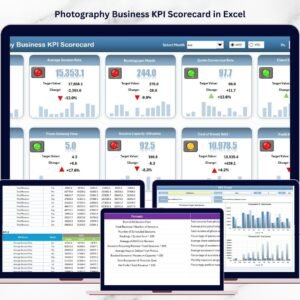
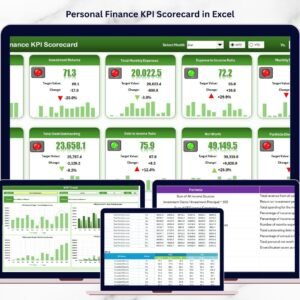
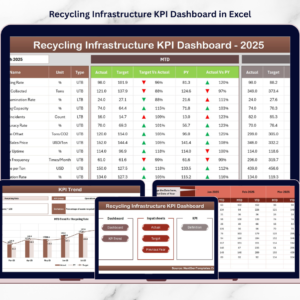
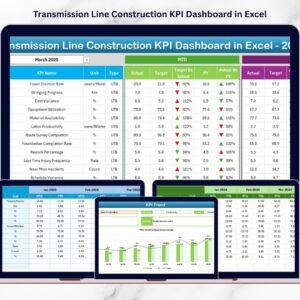
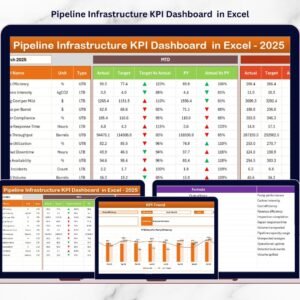
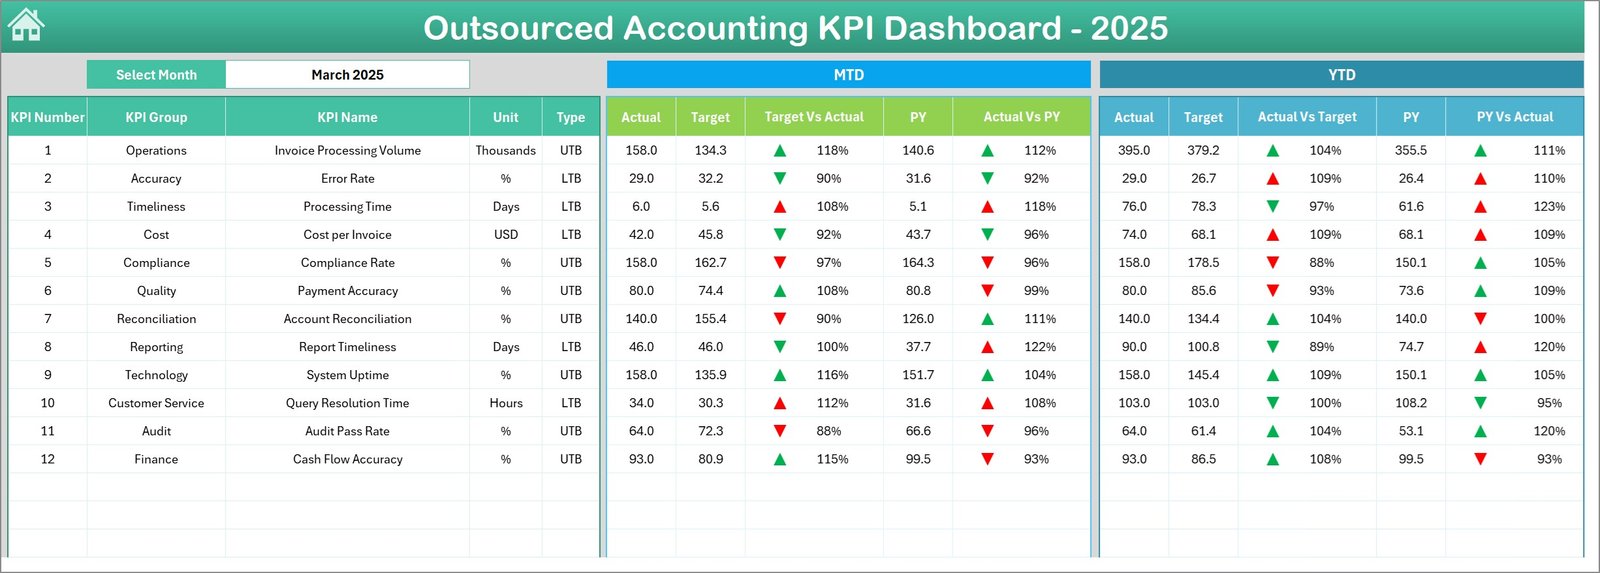
Dashboard Sheet – Main KPI Monitoring Page
The Dashboard Sheet is the core page where all accounting KPIs are displayed.
Users can select a specific month from the dropdown menu in cell D3. Once the month changes, the entire dashboard updates automatically.
Performance Metrics Displayed
The dashboard tracks two major performance sections:
MTD (Month-to-Date) Metrics
• Actual Performance
• Target Values
• Previous Year Numbers
• Target vs Actual Comparison
• Previous Year vs Actual Comparison
YTD (Year-to-Date) Metrics
• Actual Values
• Target Numbers
• Previous Year Data
• Target vs Actual Variance
• Previous Year vs Actual Variance
Performance Indicators
Conditional formatting arrows highlight performance direction:
📈 Up Arrow – Performance improvement
📉 Down Arrow – Performance decline
These visual indicators help managers instantly detect performance issues.
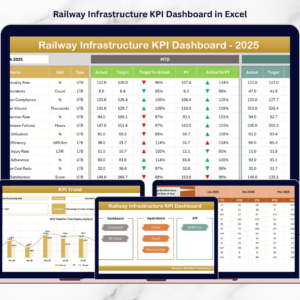
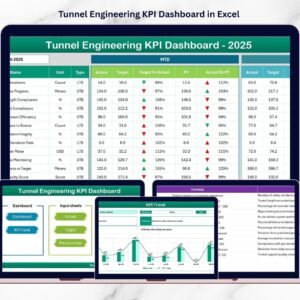
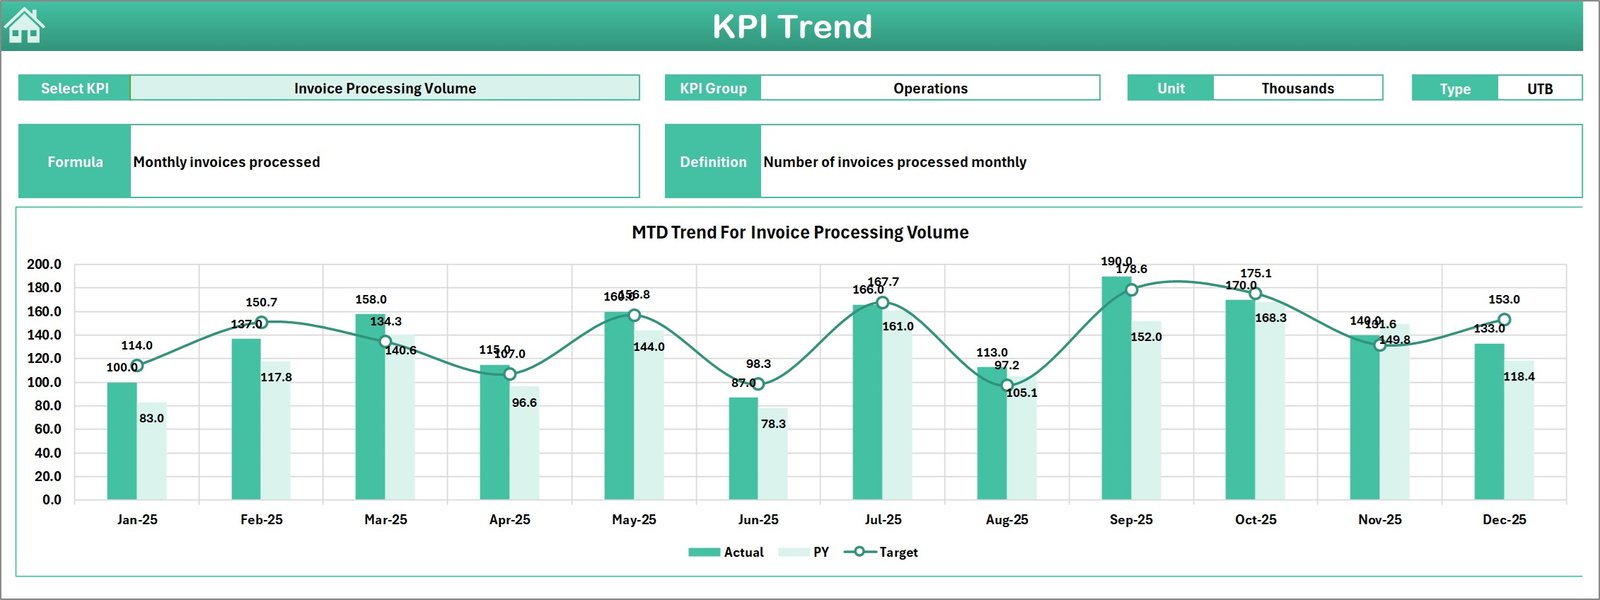
KPI Trend Sheet – KPI Performance Analysis
The KPI Trend Sheet helps managers analyze the historical trend of individual KPIs.
Users select a KPI from the dropdown in cell C3, and the sheet displays:
• KPI Group
• Unit of Measurement
• KPI Type (Higher is Better / Lower is Better)
• KPI Formula
• KPI Definition
Two charts display KPI trends:
• MTD Trend Chart
• YTD Trend Chart
These charts compare Actual vs Target vs Previous Year values.
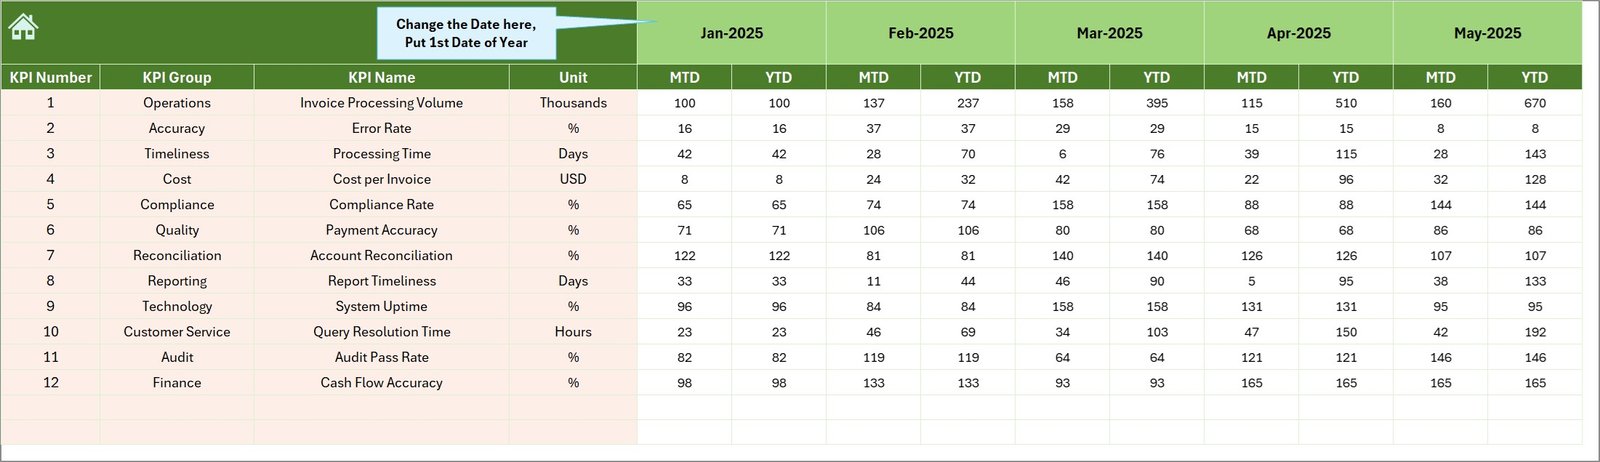
Actual Numbers Input Sheet
This sheet stores the current year performance data.
Users enter:
• Monthly actual performance values
• Year-to-date numbers
The first month of the year is defined in cell E1, ensuring consistent monthly tracking.
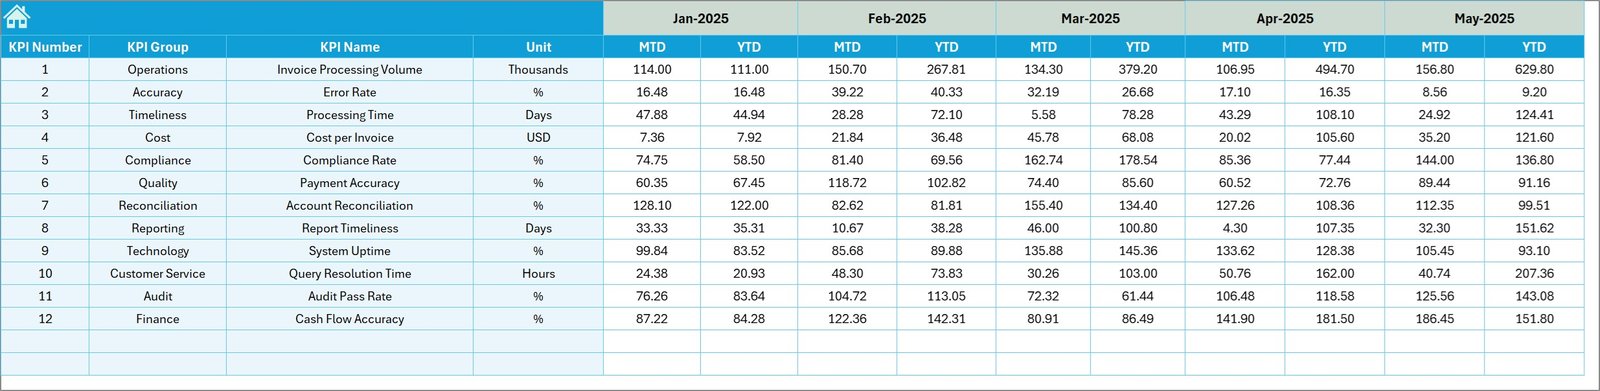
Target Sheet
The Target Sheet stores KPI goals.
Users enter:
• Monthly targets
• YTD targets
These targets allow managers to evaluate team performance.
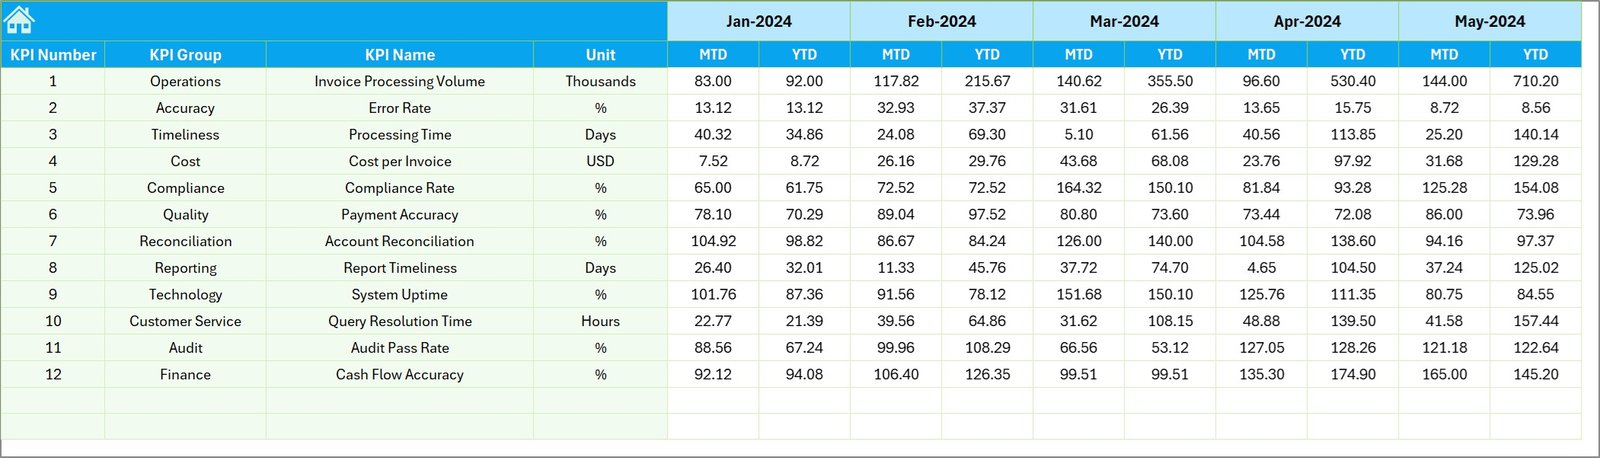
Previous Year Numbers Sheet
This sheet stores historical accounting data.
Benefits include:
• Year-over-year performance comparison
• Trend analysis
• Benchmarking improvements
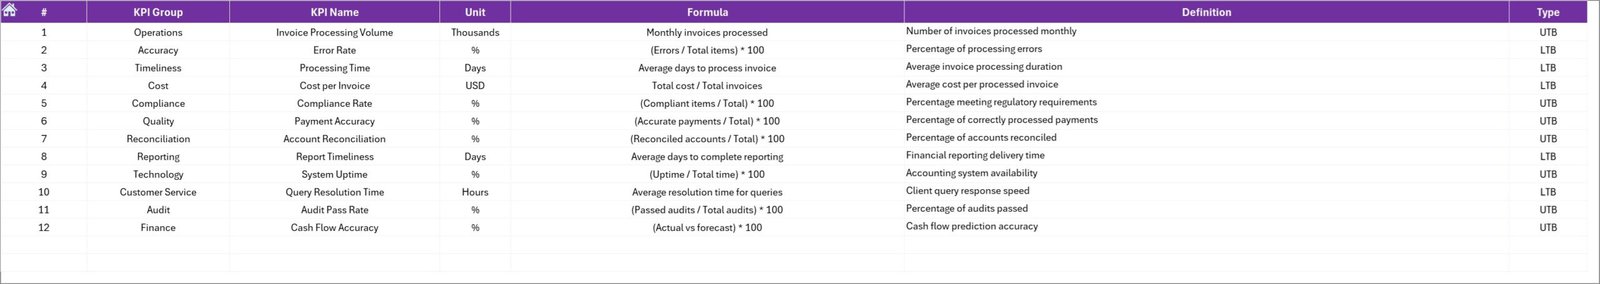
KPI Definition Sheet
The KPI Definition Sheet acts as a knowledge base for the dashboard.
Each KPI includes:
• KPI Name
• KPI Group
• Unit of Measurement
• KPI Formula
• KPI Definition
This documentation ensures KPI transparency and clarity.
⚙️ How to Use the Outsourced Accounting KPI Dashboard
Using the dashboard is simple and efficient.
1️⃣ Enter accounting performance data in the Actual Numbers Input Sheet.
2️⃣ Define KPI targets in the Target Sheet.
3️⃣ Enter historical performance in the Previous Year Numbers Sheet.
4️⃣ Refresh pivot tables to update the dashboard.
5️⃣ Use the month selector to analyze performance trends.
Once data updates, all dashboard charts automatically refresh.
👥 Who Can Benefit from This Dashboard
This dashboard is designed for professionals working in accounting and finance operations.
It is particularly useful for:
📊 Accounting Outsourcing Firms
💼 Finance Managers
📈 CFOs
🏢 Business Owners
📊 Financial Analysts
📑 Bookkeeping Service Providers
Because the dashboard provides operational and financial insights, multiple teams can use it effectively.
💡 Advantages of Outsourced Accounting KPI Dashboard in Excel
Organizations gain several benefits from implementing this dashboard.
✔ Centralized accounting performance monitoring
✔ Improved financial visibility and transparency
✔ Faster operational decision-making
✔ Better productivity and accuracy tracking
✔ Enhanced SLA and compliance monitoring
✔ Easy analysis of financial service performance
✔ Cost-effective analytics solution using Excel
Instead of relying on manual reports, organizations can use interactive Excel dashboards to monitor outsourced accounting performance efficiently.
This dashboard converts complex financial operations into clear insights that improve productivity, accountability, and service quality.
### Click here to read the Detailed blog post
Visit our YouTube channel to learn step-by-step video tutorials
https://youtube.com/@PKAnExcelExpert