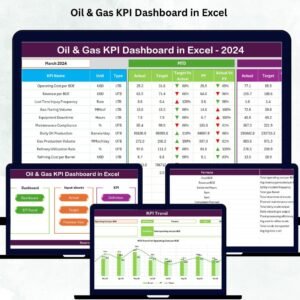
The oil & gas industry runs on speed, precision, and accurate insights. Every day, field operations shift, production numbers change, equipment conditions fluctuate, and safety metrics evolve. Without a strong reporting system, teams struggle with delays, errors, and incomplete visibility. That’s exactly why we created the Oil & Gas KPI Dashboard in Excel — a complete performance management tool designed to simplify reporting, boost clarity, and support faster decision-making across all departments.
This professionally designed dashboard helps you track production, refining, safety, financial, transport, and compliance KPIs in a clean, automated, and interactive Excel format. Whether you are managing upstream assets, refinery performance, logistics, or field safety, this dashboard gives you the power to monitor every key metric in seconds.
⭐ Key Features of the Oil & Gas KPI Dashboard in Excel
💠 1. Smart Navigation with Summary Page
Move across all sheets instantly using quick-action buttons. Zero confusion, zero complexity — just a clean, user-friendly navigation panel.
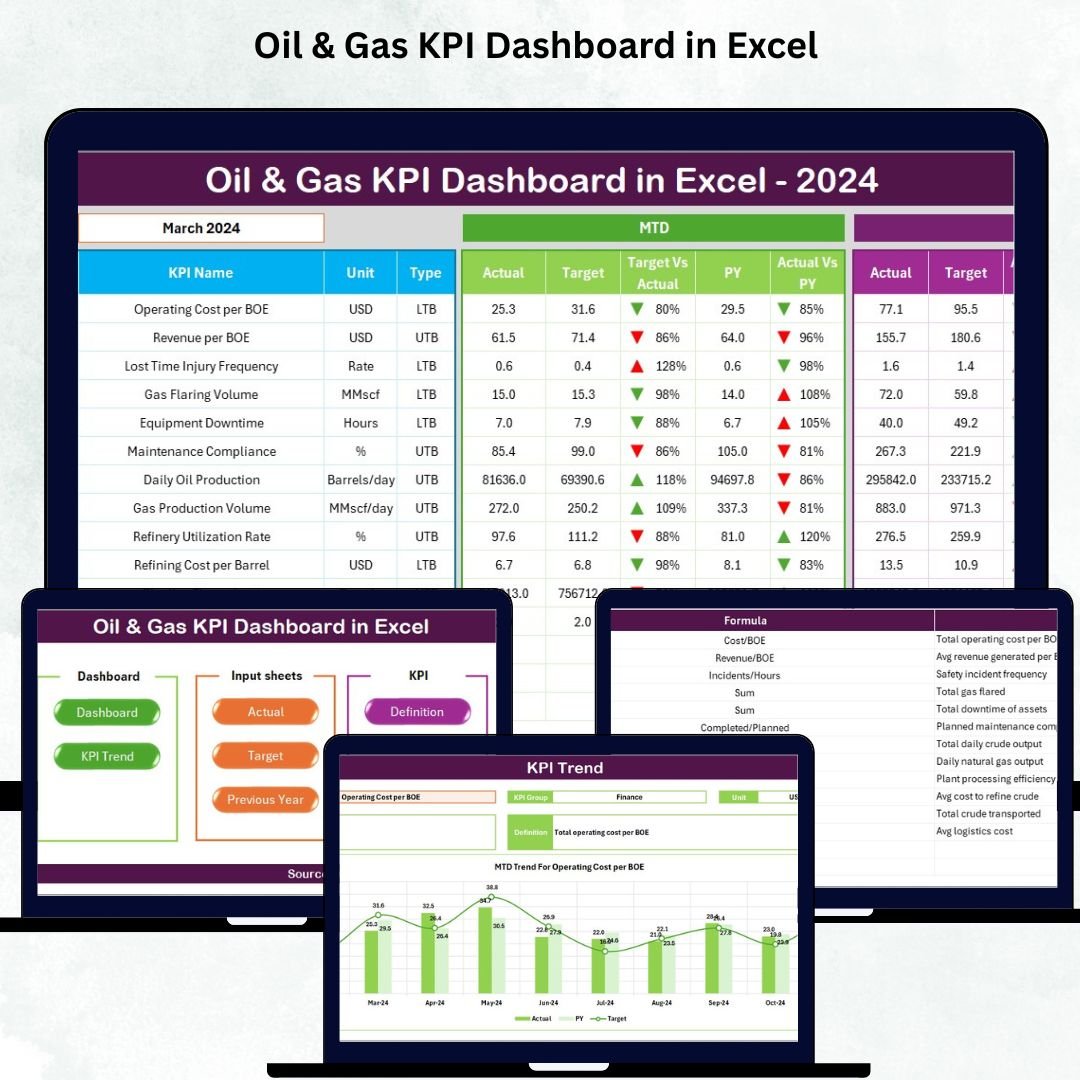
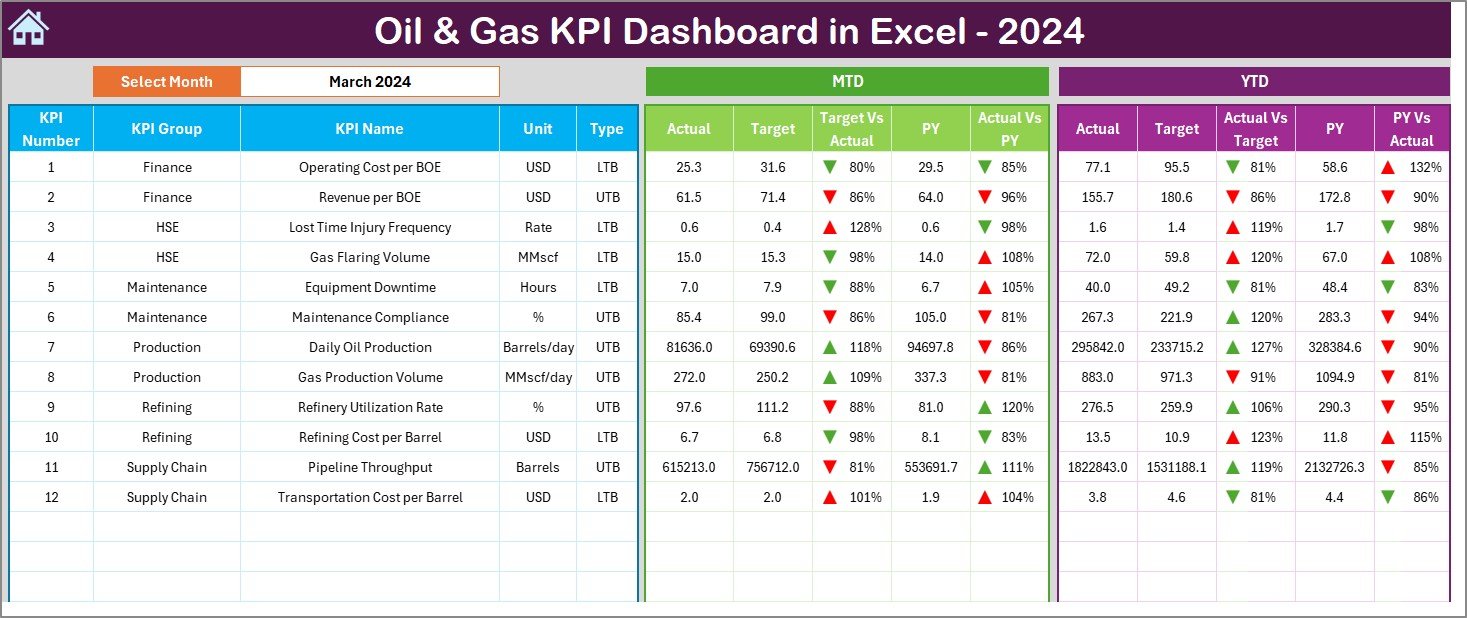
📊 2. Fully Automated KPI Dashboard Page
Select any month from the dropdown and watch the dashboard auto-update.
You get:
-
MTD Actual vs Target
-
MTD Actual vs PY
-
YTD Actual vs Target
-
YTD Actual vs PY
-
Conditional formatting with up/down arrows
This page gives managers complete performance clarity in seconds.
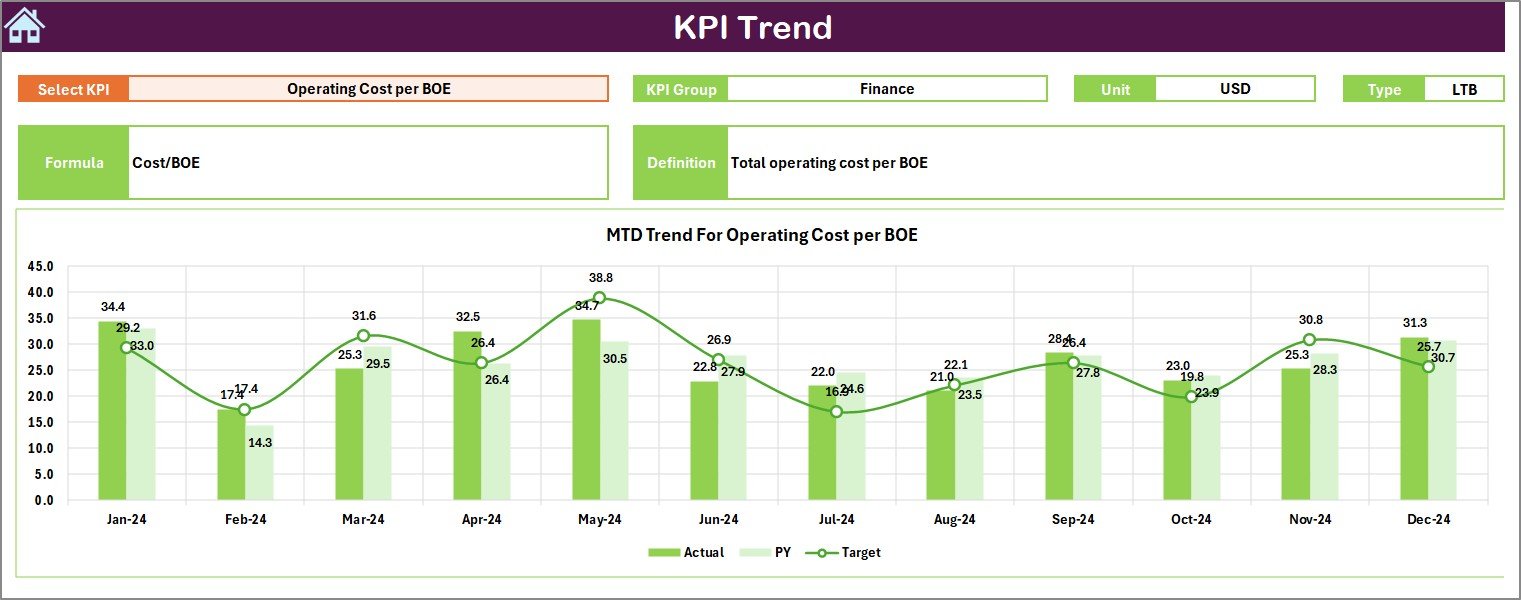
📈 3. Trend Analysis Sheets for Deep Insights
Pick any KPI and view:
-
KPI Unit
-
KPI Type (UTB or LTB)
-
KPI Definition
-
KPI Formula
-
Trend charts (MTD & YTD)
Perfect for forecasting and long-term evaluation.
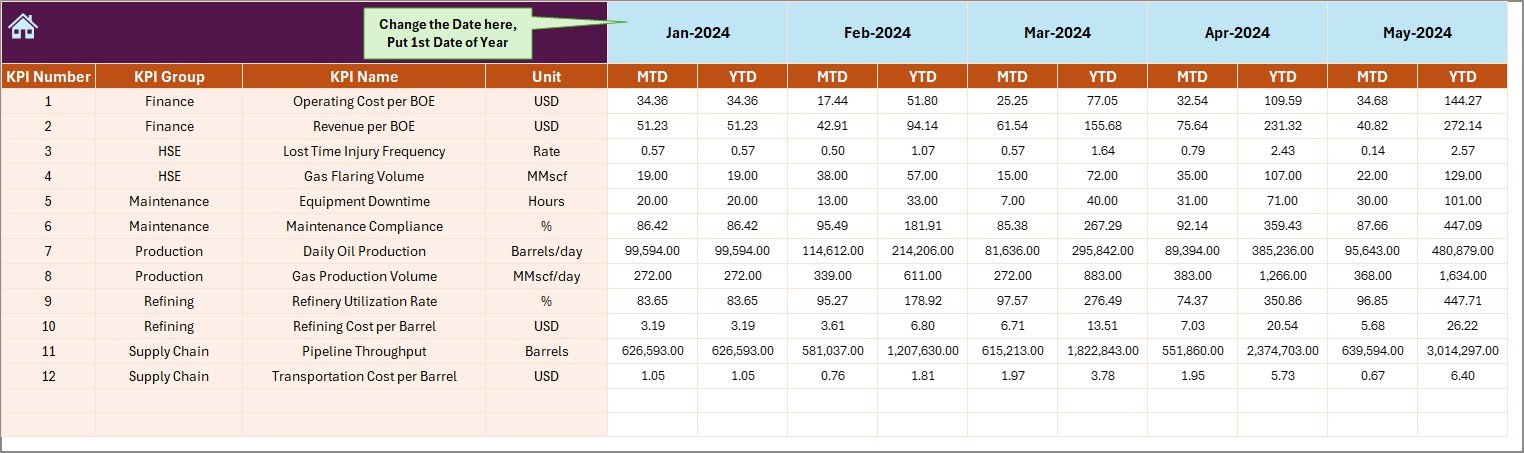
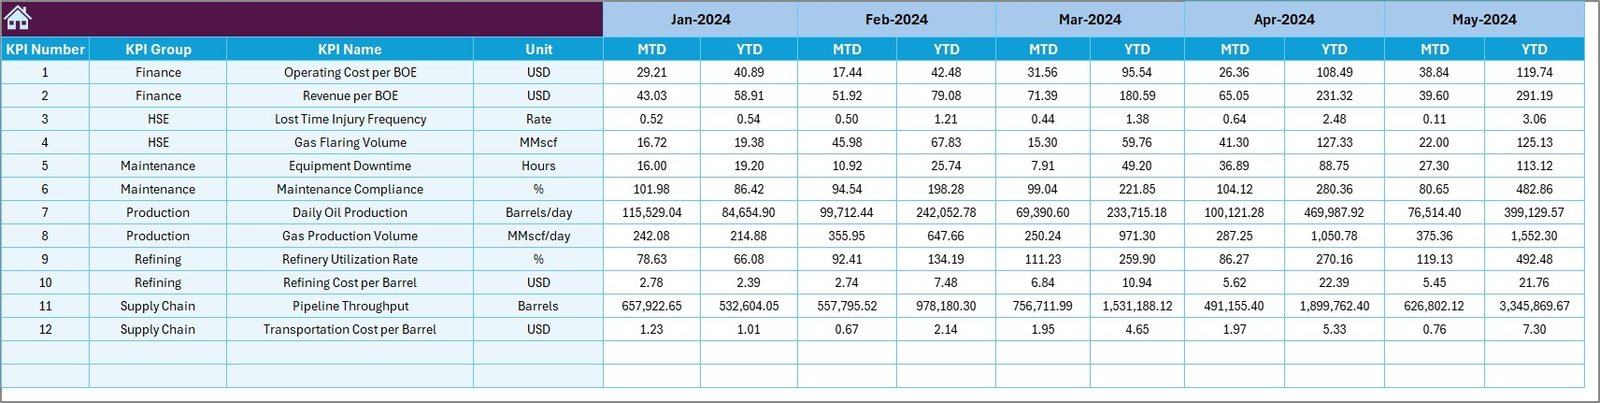
📝 4. Structured Input Sheets
Simply update:
-
Actual values
-
Targets
-
Previous year numbers
The dashboard updates everything automatically. No formulas required, no manual calculations — it’s plug and play.
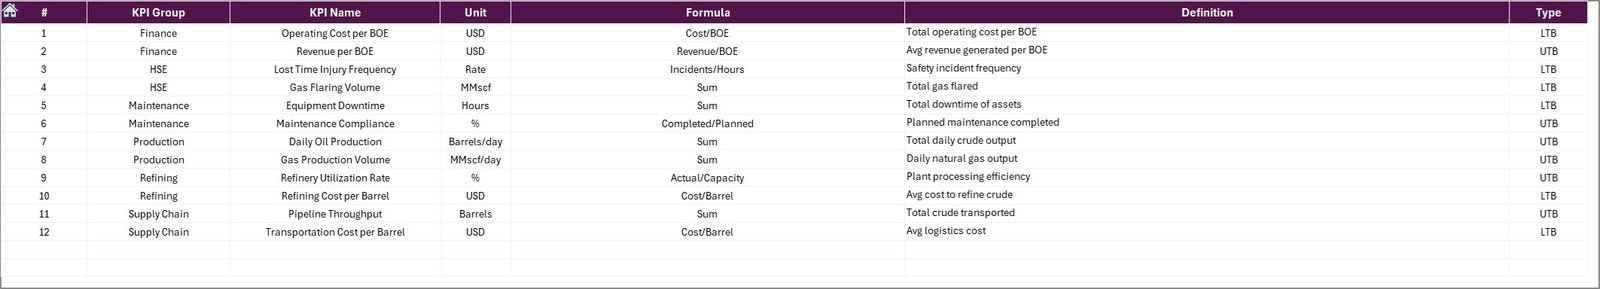
🔍 5. KPI Definition Sheet for Full Clarity
Each KPI includes:
-
Name
-
Group
-
Unit
-
Type
-
Formula
-
Definition
This keeps all teams aligned on measurement standards.
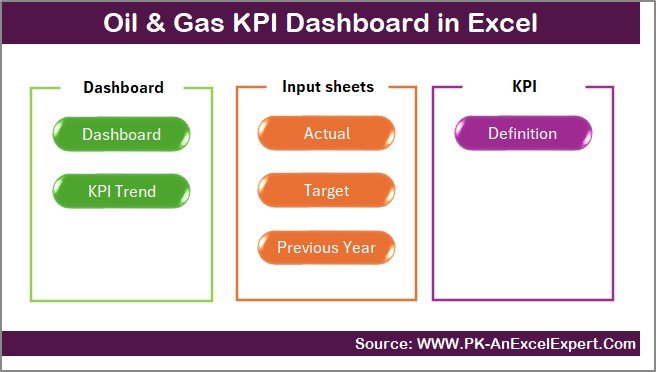
📦 What’s Inside the Oil & Gas KPI Dashboard in Excel
-
Dashboard Page (Auto-updating KPI visuals)
-
Summary Page (Navigation buttons)
-
Trend Sheet (MTD/YTD charts)
-
Actual Input Sheet
-
Target Sheet
-
Previous Year Sheet
-
KPI Definition Sheet
-
Structured formulas, clean formatting & easy workflows
Everything is ready to use — just add your numbers and start analyzing.
🛠 How to Use the Oil & Gas KPI Dashboard in Excel
1️⃣ Enter monthly actual data in the Actual Numbers Input sheet.
2️⃣ Update targets for MTD and YTD in the Target Sheet.
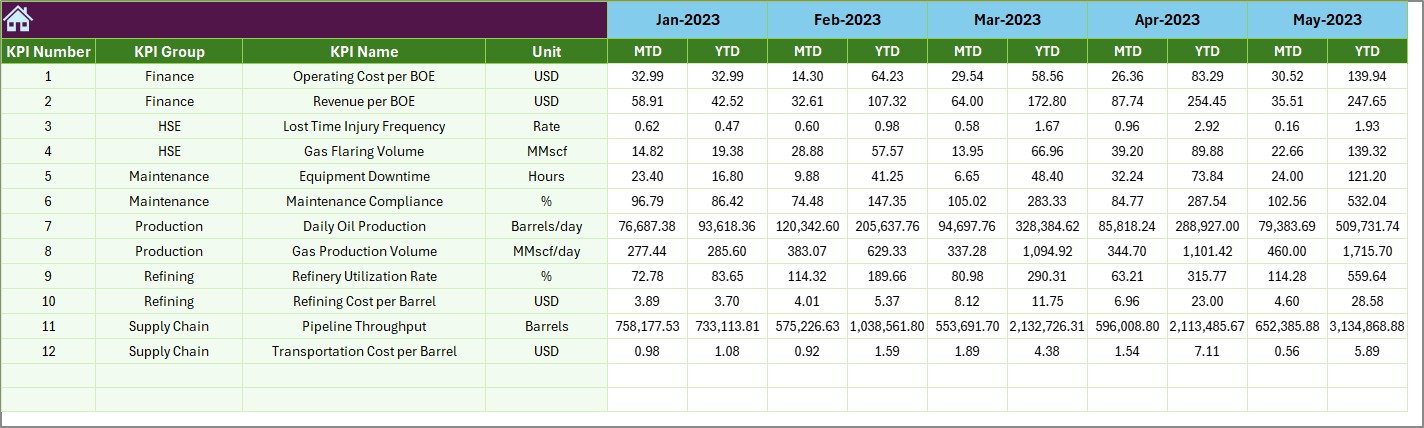
3️⃣ Add previous year’s data for YoY comparison.
4️⃣ Review trends using the Trend Sheet.
5️⃣ Open the Dashboard Page and choose the month from the dropdown.
6️⃣ View insights instantly — all calculations and visuals update automatically.
You don’t need advanced Excel skills — everything is formula-driven and fully automated.
👨💼 Who Can Benefit from This Oil & Gas KPI Dashboard?
🏭 Upstream Teams (Exploration & Drilling)
Track production rate, well efficiency, downtime, and cost KPIs effortlessly.
🏭 Midstream Operations (Transport & Storage)
Monitor pipeline integrity, transport time, delivery accuracy, and safety KPIs.
🏭 Downstream Teams (Refining & Distribution)
Analyze refinery utilization, production costs, safety compliance & logistics KPIs.
💼 Finance & Strategy Teams
Perform cost vs revenue tracking, compare targets, and analyze YoY performance.
👷 Safety & Compliance Teams
Track incidents, LTIFR, hazard reporting, and compliance scores all in one place.
📊 Leadership & Decision-Makers
Get a visual performance summary for faster, smarter decisions.
### Click here to read the Detailed blog post
Watch the step-by-step video tutorial:
### Visit our YouTube channel to learn step-by-step video tutorials


Reviews
There are no reviews yet.