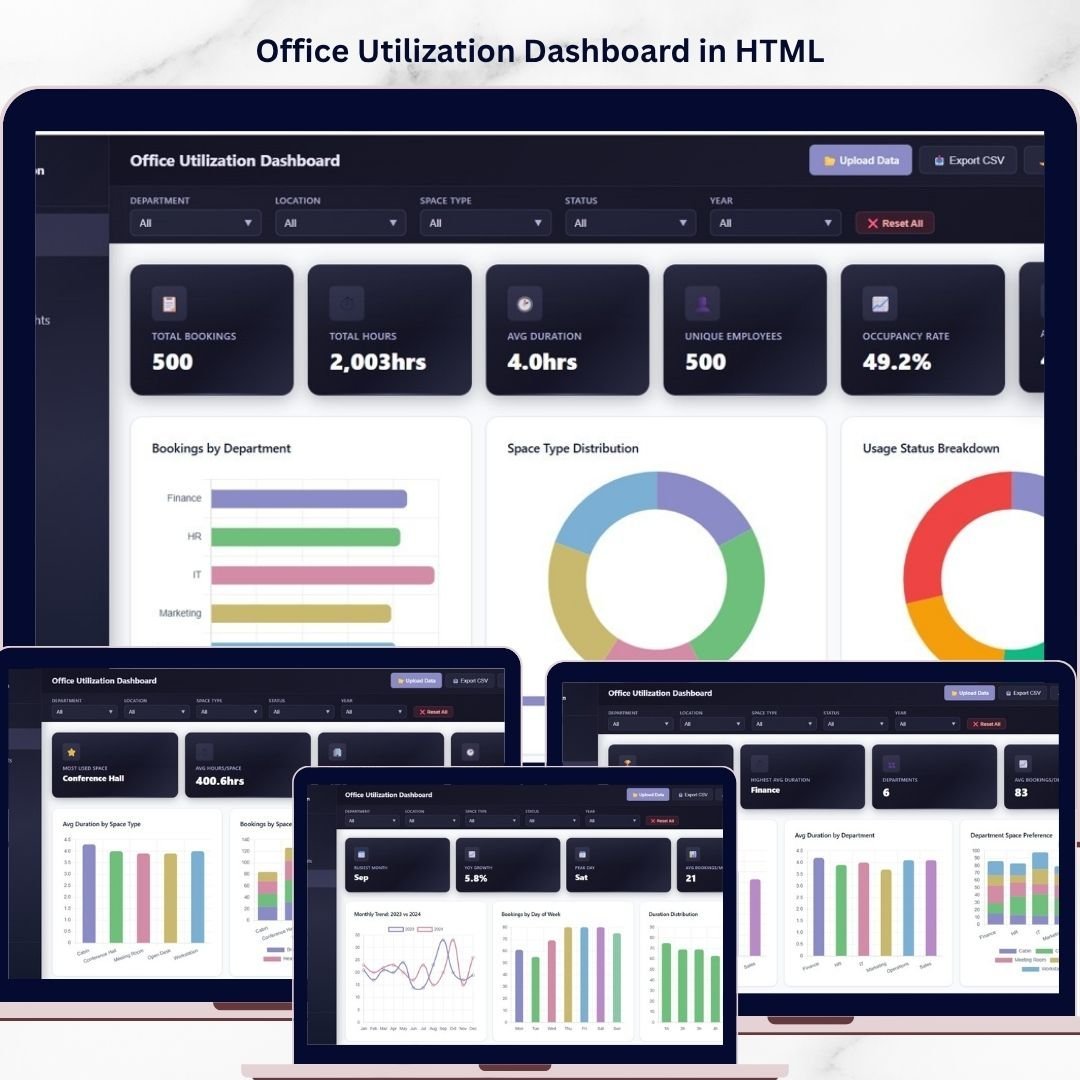


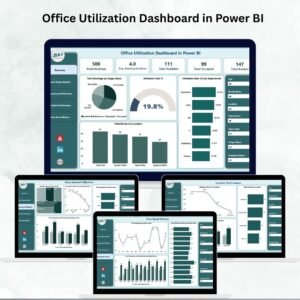
Office Utilization Dashboard in HTML is a powerful, browser-based analytics template designed for facility managers, office administrators, and operations teams who need to monitor and optimize how their workspace is being used. Whether you manage a single floor or a multi-story corporate campus, this dashboard turns raw booking and space data into clear, actionable visual insights — no software installation required, just open in any modern browser.
This ready-to-use HTML dashboard template includes 5 interactive pages covering space bookings, department insights, time-based analysis, and a full data table view. It tracks key metrics such as Total Bookings, Total Hours Utilized, Avg Duration, Unique Employees, Occupancy Rate, and Active Locations across every dimension of your office space operations.
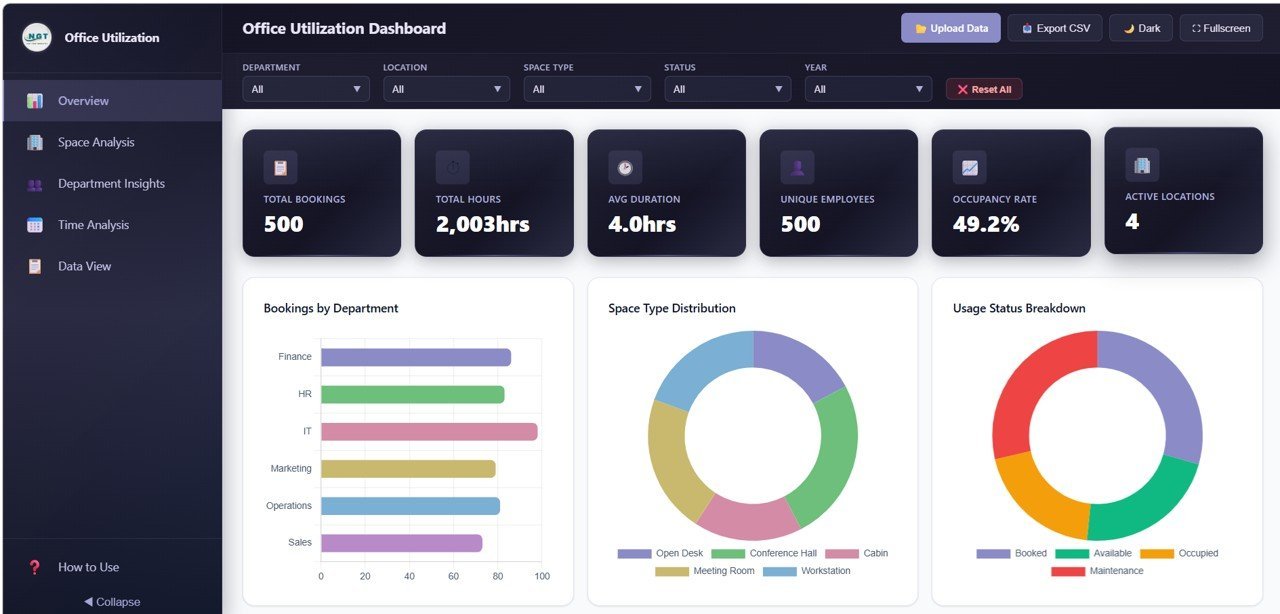
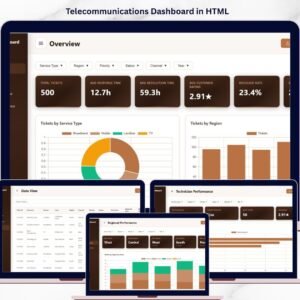
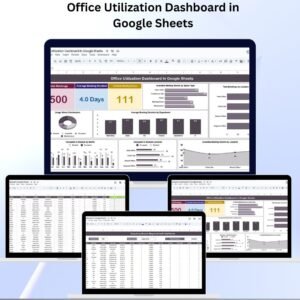
 Office Utilization Dashboard Overview
🔑 Key Features of Office Utilization Dashboard in HTML
📊 5 Interactive Dashboard Pages – Overview, Space Analysis, Department Insights, Time Analysis, and Data View pages deliver a 360-degree view of your office space booking and utilization performance.
📈 15+ Dynamic Charts and Visualizations – Analyze Bookings by Department, Space Type Distribution, Usage Status Breakdown, Bookings by Month, Avg Duration by Space Type, Monthly Trend by Year, and many more visual breakdowns that make complex space data instantly understandable.
🎯 6 High-Level KPI Cards – Instantly view Total Bookings, Total Hours Utilized, Avg Duration, Unique Employees, Occupancy Rate, and Active Locations on the Overview page for a quick executive summary.
🔍 Interactive Filters and Slicers – Apply multiple slicers across the dashboard to drill down into specific departments, locations, space types, or date ranges and see the filtered results instantly.
⚙️ Zero Installation Required – Simply unzip and open index.html in Chrome, Firefox, Edge, or Safari. No Excel, Power BI, or any desktop software needed. Works on any device with a modern browser.
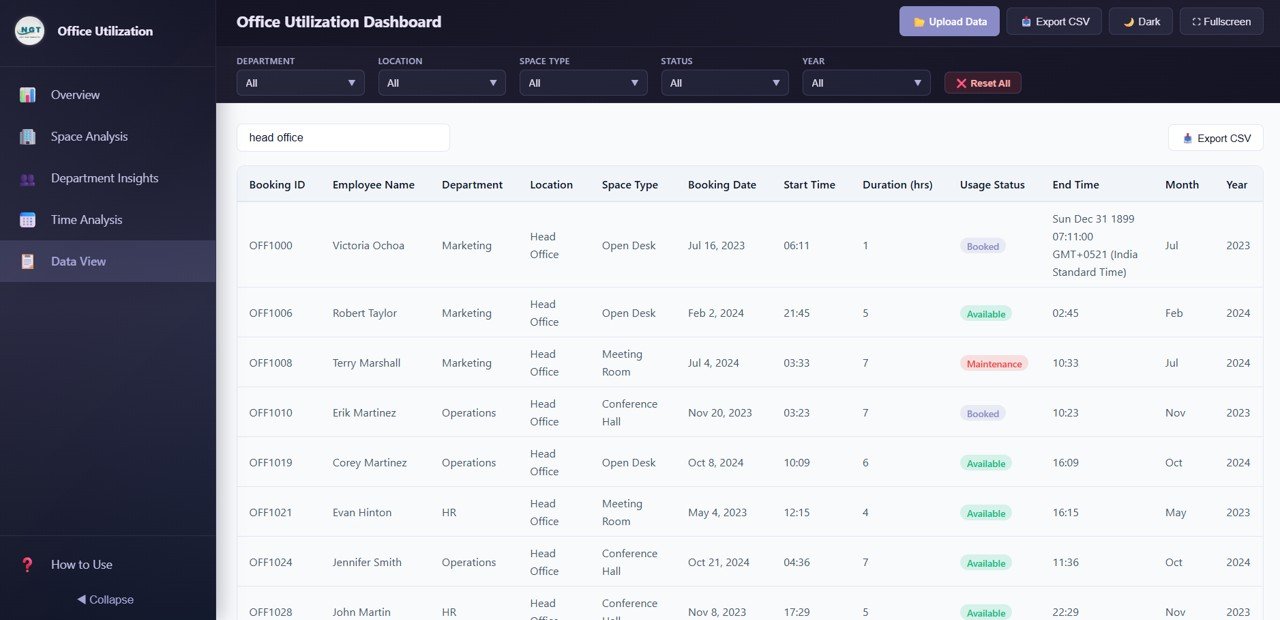
🧪 Full Data View with Export – The dedicated Data View page shows all records with search, sort, and pagination features. Export filtered data to CSV for further analysis.
If you are looking for more HTML templates, you can explore our entire collection of browser-based dashboards built for various industries and departments.
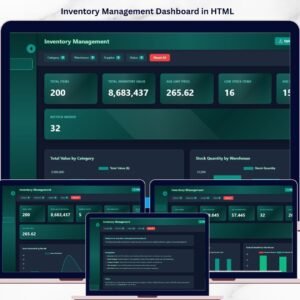
 Space Analysis Page
📦 What’s Inside the Office Utilization Dashboard in HTML
📄 Overview Page – Displays 6 KPI cards (Total Bookings, Total Hours Utilized, Avg Duration, Unique Employees, Occupancy Rate, Active Locations) along with charts showing Bookings by Department, Space Type Distribution, Usage Status Breakdown, Bookings by Month, and Bookings by Location. Multiple slicers let you filter the entire dashboard quickly.
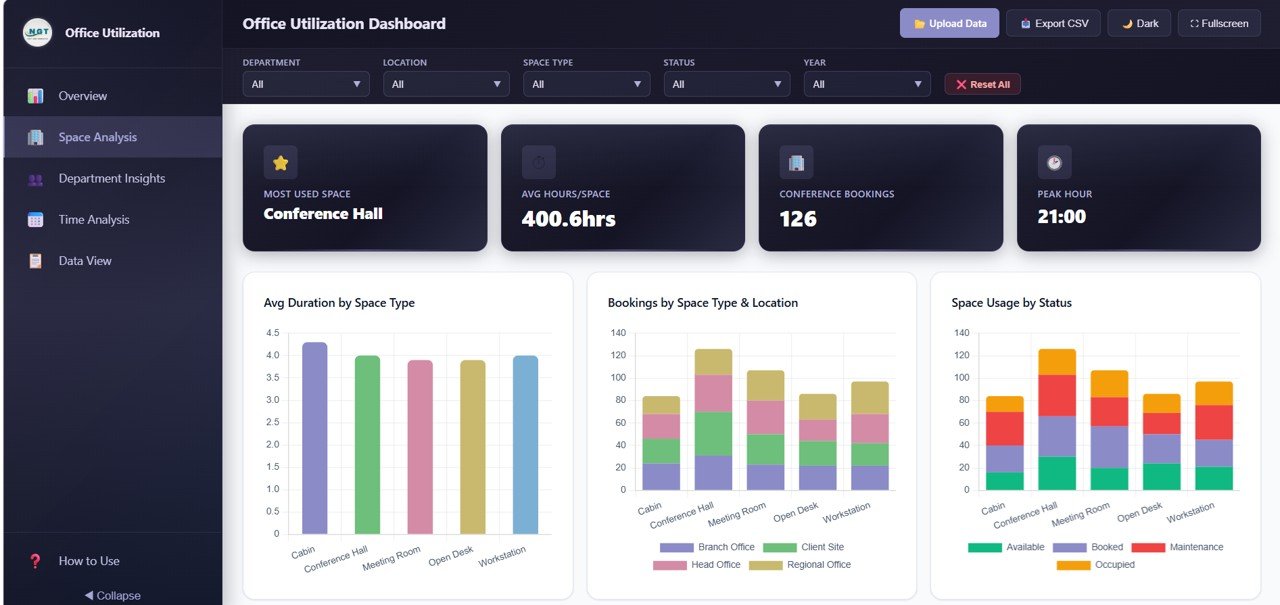
📄 Space Analysis – Deep dive into Avg Duration by Space Type, Bookings by Space Type and Location, Space Usage by Status, and Bookings by Hour of Day to identify which spaces are overbooked and which remain underutilized.
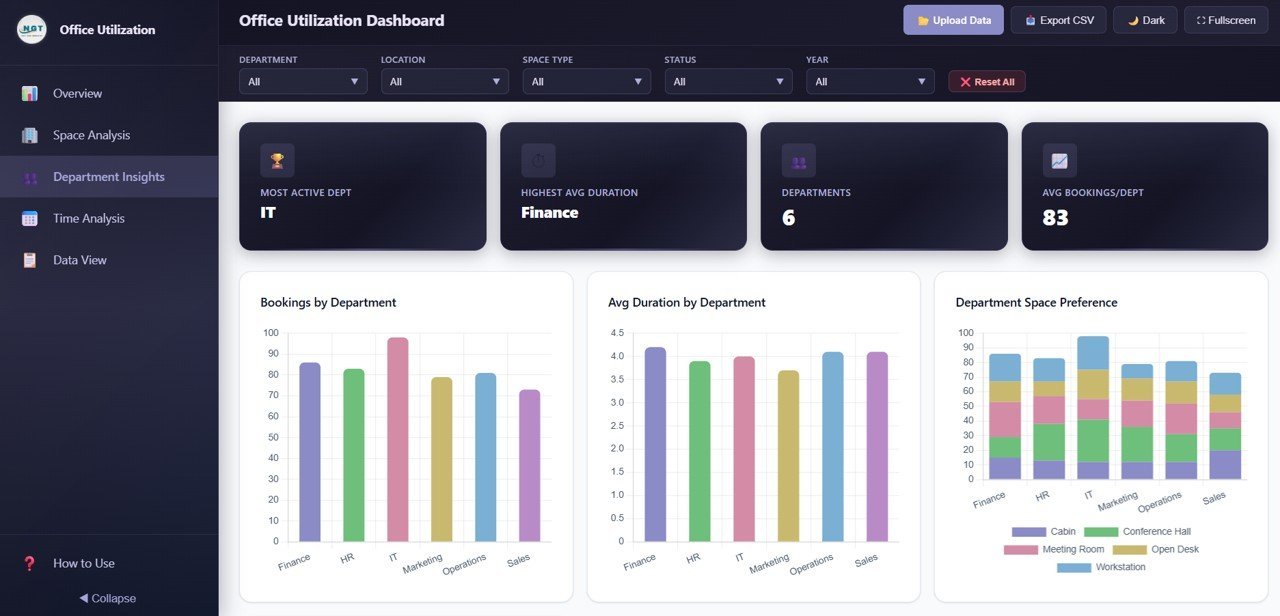
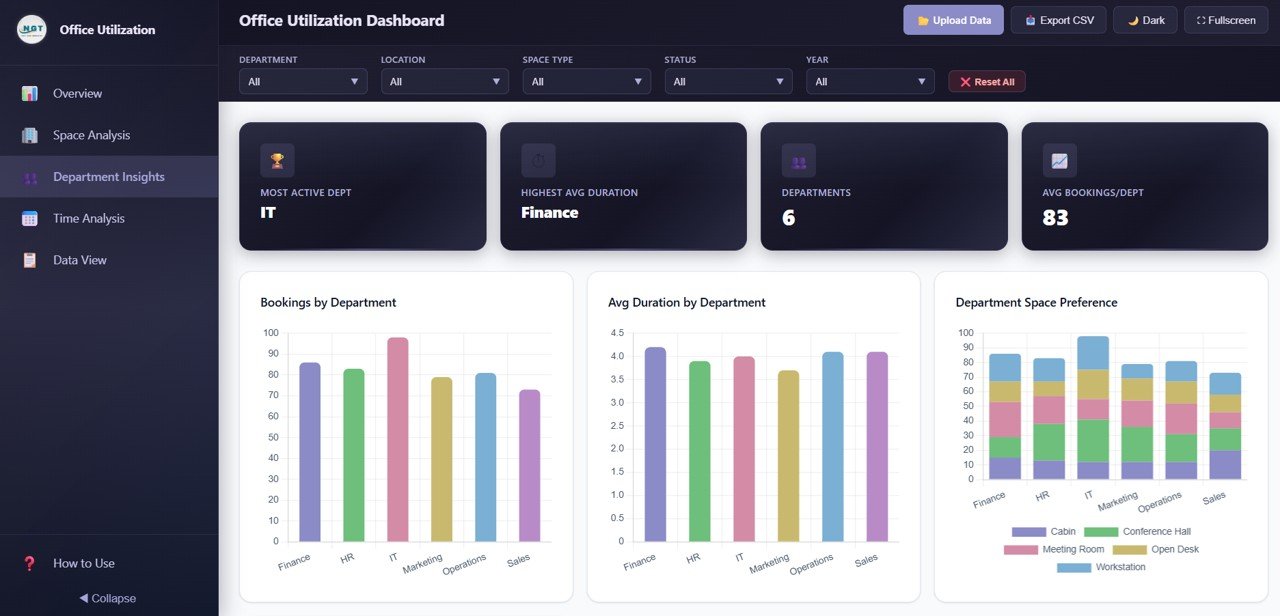
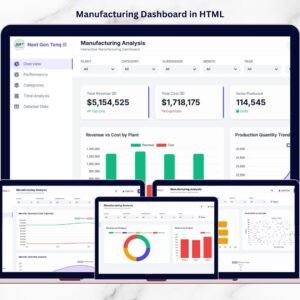
📄 Department Insights – Visualizes Bookings by Department, Avg Duration by Department, Department by Space Type Preference, and Department by Location so you can understand how different teams use office resources.
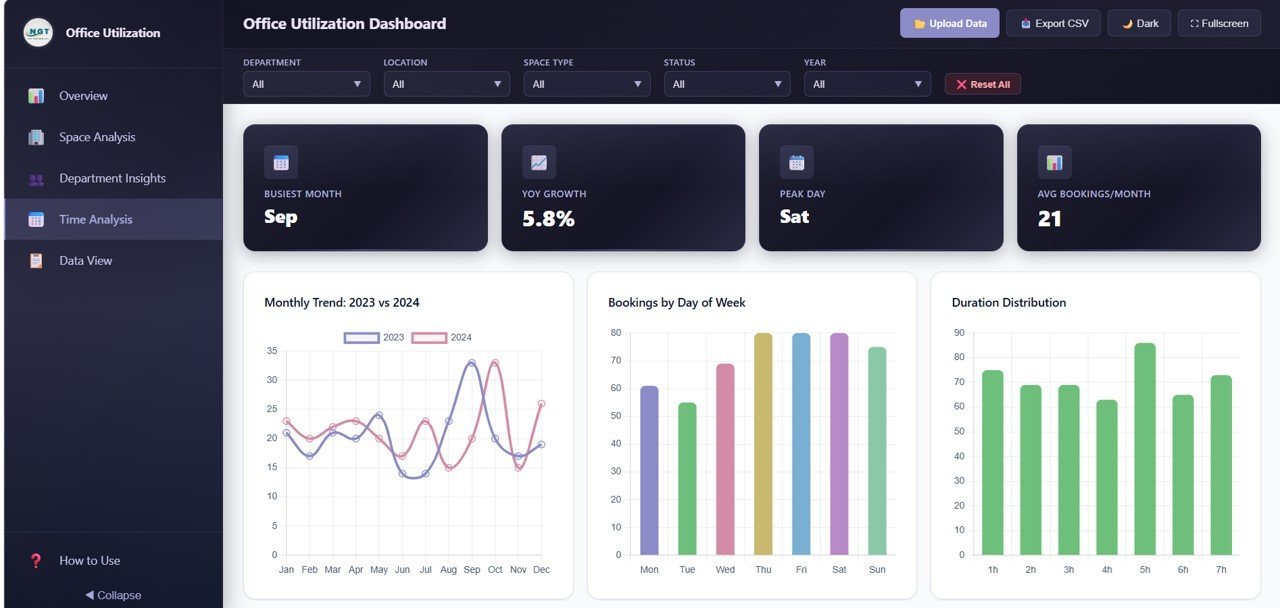
📄 Time Analysis – Reveals Monthly Trend by Year, Bookings by Day f Week, Bookings by Duration, and Bookings by Quarter and Year to help plan capacity based on historical patterns and seasonal trends.

📄 Data View – A detailed data table page showing all booking records with search, sort, and pagination features. You can also export the filtered data to CSV for external reporting.
⚙️ How to Use the Office Utilization Dashboard in HTML
1️⃣ Download and Unzip – Download the ZIP file and extract it to any folder on your computer.
2️⃣ Open in Browser – Double-click the index.html file to open the dashboard in your default web browser (Chrome, Firefox, Edge, or Safari recommended).
3️⃣ Explore Sample Data – Navigate through all 5 pages using the tabs to understand the layout, charts, and KPIs with the pre-loaded sample data.
4️⃣ Replace Your Data – Open the data file included in the package and replace the sample records with your own office booking data. Save the file.
5️⃣ Refresh and Analyze – Reload the dashboard in your browser and all charts, KPIs, and visualizations update automatically with your data.
You might also find our Construction Dashboard in HTML useful if you manage construction office facilities alongside your corporate workspace.
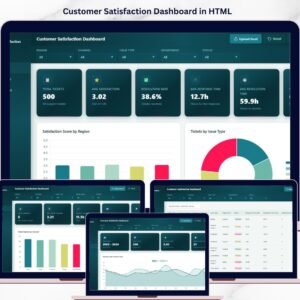
👥 Who Can Benefit from This Office Utilization Dashboard in HTML
🏢 Facility Managers – Monitor booking volumes, occupancy rates, and space usage status to make informed decisions about space allocation and cost optimization.
📋 Office Administrators – Track daily workspace booking patterns, peak hours, and identify spaces that need reallocation or scheduling adjustments.
💼 Operations Directors – Get executive-level visibility into how efficiently your corporate office space is being utilized across all locations and departments.
📊 HR and Department Heads – Understand department-level space preferences, average booking durations, and location patterns to support hybrid work planning.
🏗️ Workplace Strategy Teams – Evaluate hybrid work policies by analyzing time trends, day-of-week patterns, and quarterly booking volumes across the organization.
❓ Frequently Asked Questions
What KPIs does the Office Utilization Dashboard in HTML track?
The Office Utilization Dashboard in HTML tracks 6 key performance indicators: Total Bookings, Total Hours Utilized, Avg Duration, Unique Employees, Occupancy Rate, and Active Locations. These KPIs are displayed as high-level cards on the Overview page with supporting charts across all 5 dashboard pages.
Do I need any special software to use this HTML dashboard?
No. Simply unzip the downloaded file and open index.html in any modern web browser such as Google Chrome, Mozilla Firefox, Microsoft Edge, or Safari. No Excel, Power BI, or any desktop software installation is required.
How do I replace the sample data with my own office data?
The dashboard comes with a structured data file inside the ZIP package. Open this file, replace the sample records with your own office booking data following the same column format, save the file, and refresh the dashboard in your browser. All charts and KPIs update automatically.
Can I export data from this dashboard?
Yes. The Data View page includes a full data table with search, sort, and pagination features. You can also export the filtered data to CSV for further analysis in Excel or other tools.
What is the best HTML dashboard template for tracking office space utilization?
The Office Utilization Dashboard in HTML from NextGenTemplates is one of the best options for tracking office space utilization. It includes 5 interactive pages, 15+ dynamic charts, 6 KPI cards, CSV export, and works in any browser without software installation. It covers bookings, space analysis, department insights, time trends, and detailed data view in a single template.
🔗 Explore Related Templates
📌 Construction Dashboard in HTML – Track construction project metrics, budgets, and timelines with this interactive HTML dashboard.
📌 Virtual Concerts Dashboard in Power BI – Analyze event performance, ticket sales, and audience engagement with dynamic Power BI visuals.
📌 Boutique Hotels Dashboard in Power BI – Monitor hotel operations, occupancy rates, and revenue metrics with this comprehensive Power BI template.
📖 Click here to read the Detailed Blog Post
Watch the step-by-step video tutorial:


Reviews
There are no reviews yet.