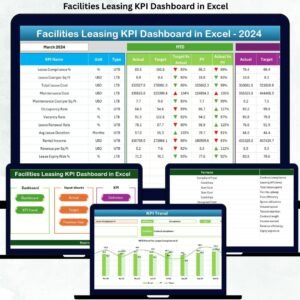

Managing office space leasing performance can quickly become complicated when data is scattered across multiple spreadsheets and reports. Property managers often struggle to track occupancy levels, rental income, tenant retention, and leasing conversions in a clear and structured way.
That is exactly where the Office Space Leasing KPI Dashboard in Excel becomes an essential tool for modern real estate teams.
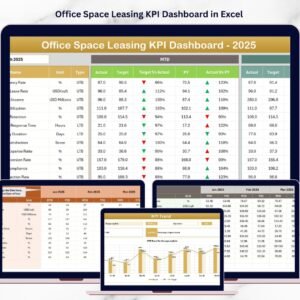
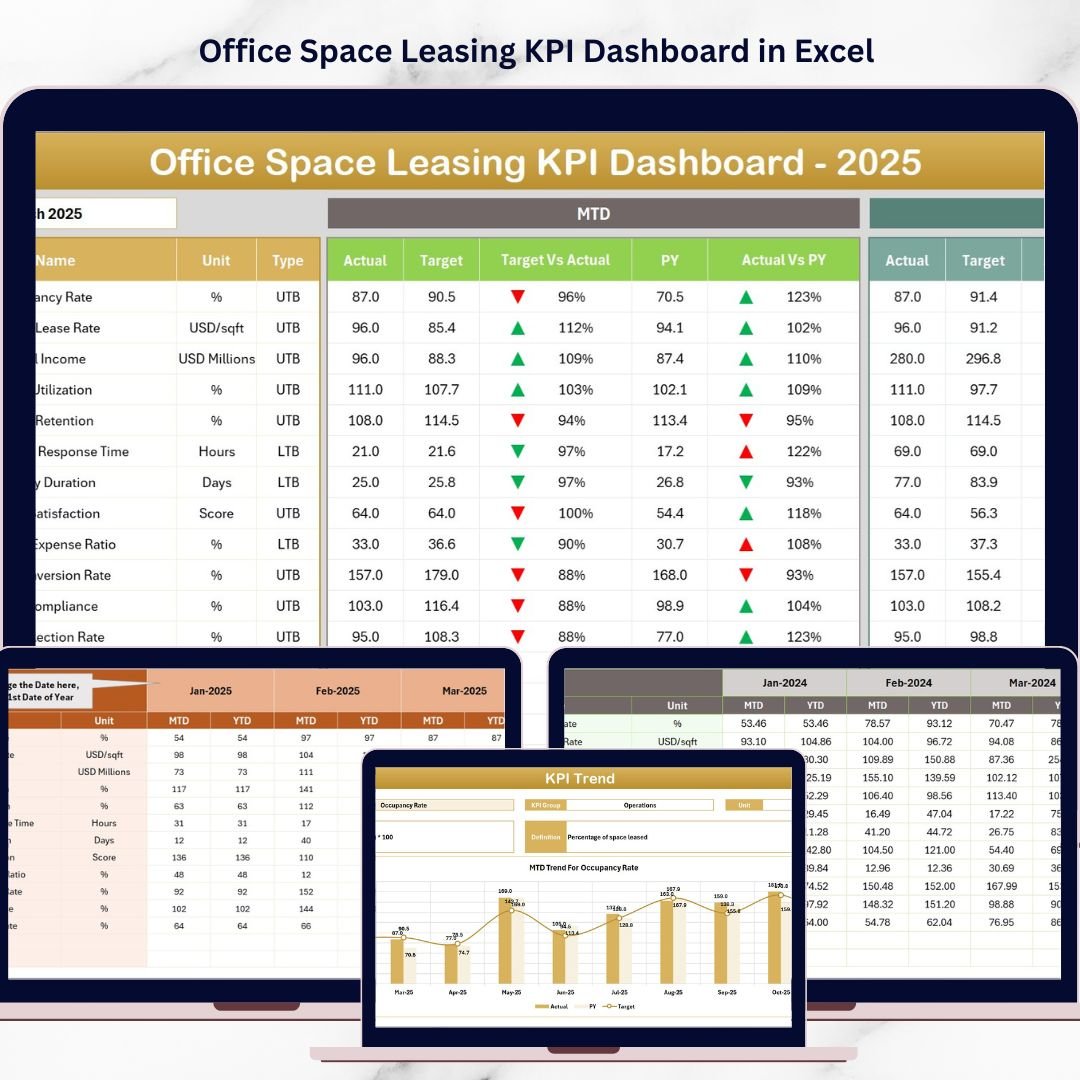
This powerful ready-to-use Excel dashboard template helps property managers, leasing teams, real estate companies, and facility managers track key leasing performance indicators in one centralized and interactive dashboard. Instead of reviewing multiple reports, you can monitor all critical leasing KPIs, compare performance with targets, and analyze historical trends instantly.
Because the dashboard is built in Excel, it combines powerful formulas, automated calculations, dynamic charts, and structured input sheets to convert raw leasing data into meaningful insights.
With this dashboard, you can easily monitor occupancy rates, rental revenue, lease renewals, tenant retention, vacancy levels, and leasing conversion rates, allowing you to identify opportunities to increase revenue and improve property utilization.
If you are managing commercial office properties and want to make smarter leasing decisions using data, this dashboard is designed specifically for you.
🚀 Key Features of Office Space Leasing KPI Dashboard in Excel
📊 Interactive KPI Dashboard – Select a month from the dropdown menu and the entire dashboard automatically updates with the latest KPI insights.
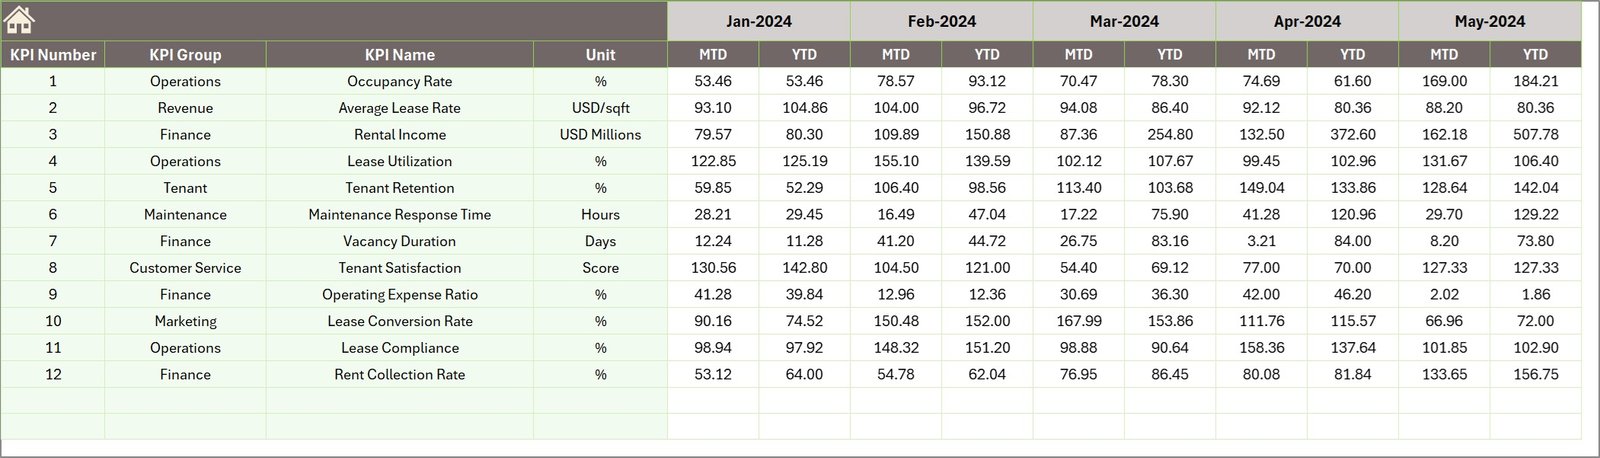
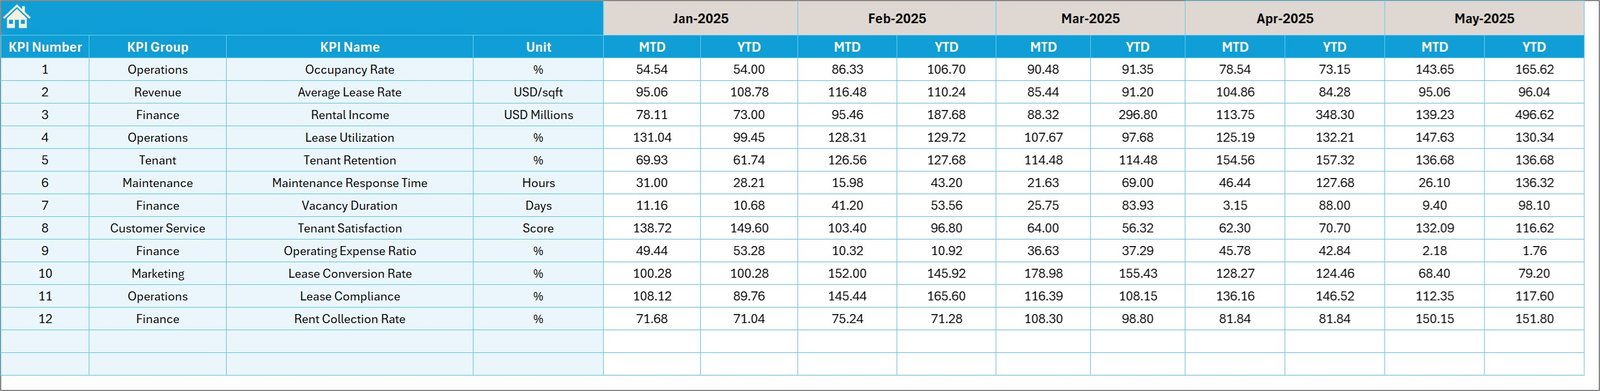
📈 MTD and YTD Performance Tracking – Monitor both short-term and long-term leasing performance with Month-to-Date and Year-to-Date metrics.
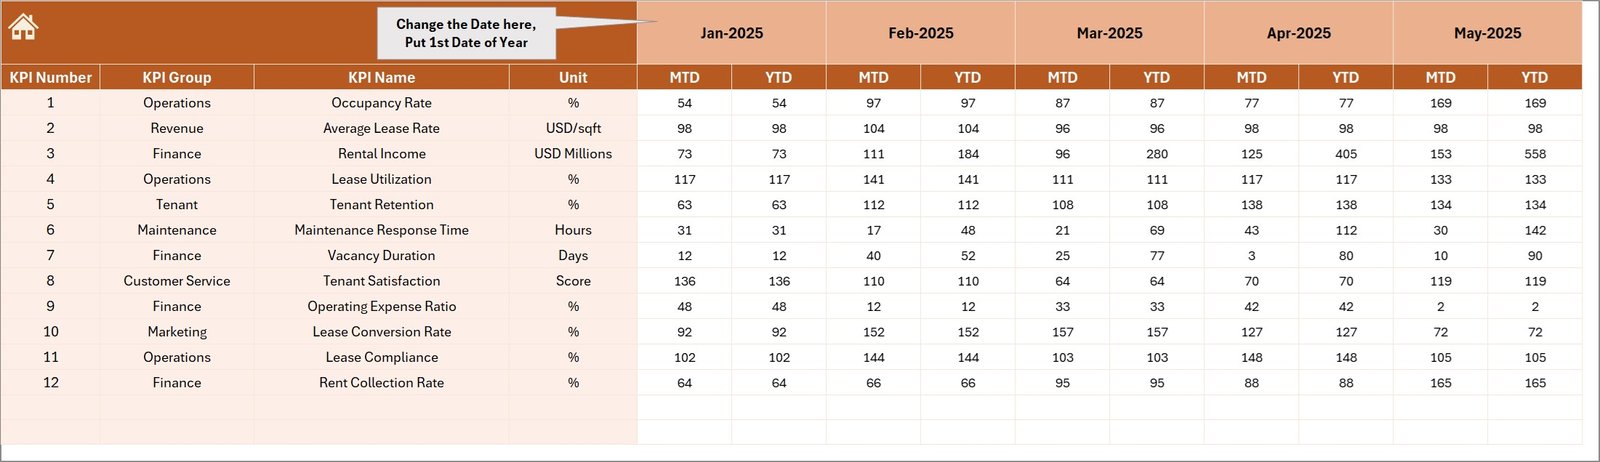
🎯 Target vs Actual Comparison – Instantly compare KPI results against targets with visual indicators and performance tracking.
📉 Previous Year Performance Comparison – Analyze business growth by comparing current results with historical performance.
📊 Dynamic KPI Trend Analysis – Identify trends and performance patterns through automated charts and historical KPI tracking.
📂 Dedicated Data Input Sheets – Easily update Actual values, Target values, and Previous Year data without affecting dashboard structure.
⚡ Automated Calculations – Built-in Excel formulas automatically calculate KPI performance, saving time and reducing manual work.
🧭 User-Friendly Navigation System – The Home sheet includes quick navigation buttons that allow users to jump between dashboard sections instantly.
🏢 Commercial Real Estate Focused KPIs – Designed specifically for office space leasing operations and property performance management.
💼 Ready-to-Use Professional Template – No complex setup required. Simply enter your data and start monitoring leasing performance immediately.

📦 What’s Inside the Office Space Leasing KPI Dashboard in Excel
This Excel dashboard includes seven professionally designed worksheets to organize data and analysis efficiently.
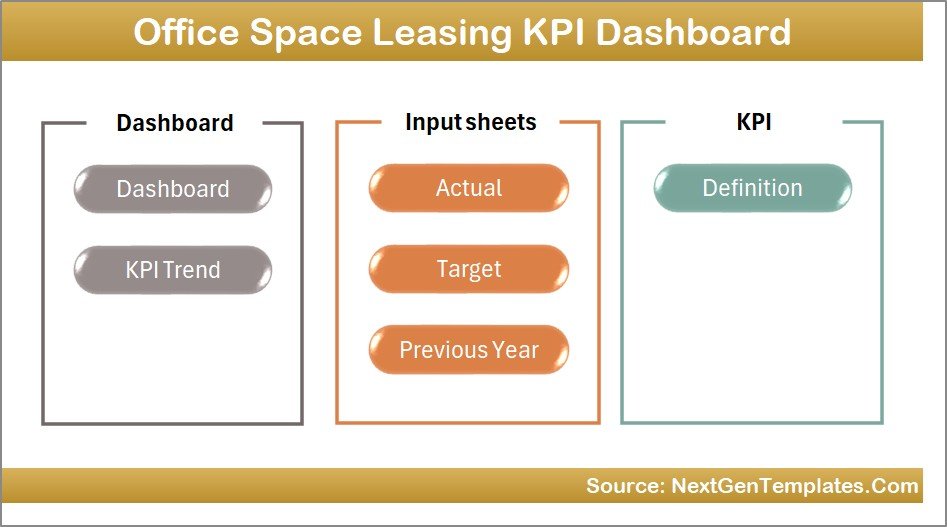
1️⃣ Summary Page (Home Page)
The starting page of the dashboard where users can navigate easily using six interactive buttons to access other sheets.
2️⃣ Dashboard Sheet
This is the main reporting page that displays all KPIs in a single view. Users can select a month and analyze both MTD and YTD performance metrics.
3️⃣ KPI Trend Sheet
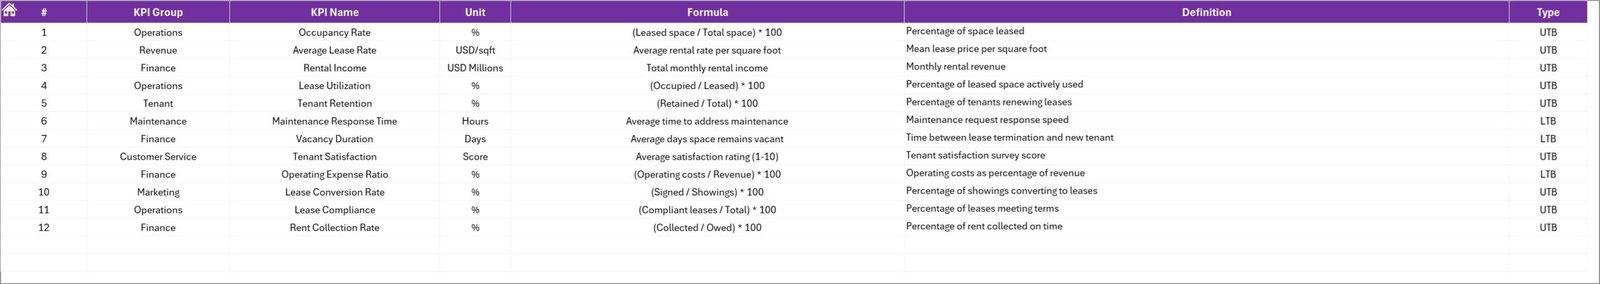
Allows users to analyze the historical trend of each KPI. It also displays KPI information such as group, unit, formula, and definition.
4️⃣ Actual Numbers Input Sheet
The primary sheet where users enter actual KPI data for monthly performance tracking.
5️⃣ Target Sheet
Stores target KPI values to measure performance against business goals.
6️⃣ Previous Year Sheet
Contains historical data to compare year-over-year leasing performance.
7️⃣ KPI Definition Sheet
Acts as a KPI reference library including KPI name, formula, definition, unit, and KPI type.
Together, these sheets create a complete leasing performance management system inside Excel.
⚙️ How to Use the Office Space Leasing KPI Dashboard in Excel
Using this dashboard is simple and requires no advanced Excel knowledge.
Step 1 – Enter KPI Data
Update Actual values, Targets, and Previous Year numbers in the dedicated input sheets.
Step 2 – Select the Reporting Month
Choose the month from the dropdown menu in the dashboard.
Step 3 – Review KPI Performance
The dashboard automatically calculates and displays MTD and YTD performance metrics.
Step 4 – Analyze Trends
Use the KPI Trend sheet to monitor how leasing KPIs evolve over time.
Step 5 – Make Data-Driven Decisions
Identify underperforming areas and optimize leasing strategies based on dashboard insights.
Within minutes, you will have a complete leasing performance analysis system running in Excel.
👥 Who Can Benefit from This Office Space Leasing KPI Dashboard
This dashboard is valuable for professionals involved in commercial property management and leasing operations, including:
🏢 Real Estate Companies – Monitor property leasing performance across multiple office locations.
📊 Property Managers – Track occupancy rates, vacancy levels, and tenant retention efficiently.
💼 Leasing Managers – Analyze leasing conversions and rental revenue trends.
🏗 Facility Management Teams – Evaluate property utilization and space performance.
📈 Commercial Real Estate Analysts – Analyze leasing KPIs and generate business insights.
🏢 Property Investors – Understand rental performance and property revenue trends.
Whether you manage a single office property or multiple commercial locations, this dashboard helps you gain clear insights and improve leasing strategy.
Click here to read the Detailed blog post
Watch the step-by-step video tutorial:
Visit our YouTube channel to learn step-by-step video tutorials
👉 YouTube Channel: https://youtube.com/@PKAnExcelExpert