Managing a neurology hospital is never simple. Every day, teams must track treatment speed, patient care quality, departmental performance, and target achievement across multiple KPIs. However, when this information sits in separate files and manual reports, it becomes difficult to spot performance gaps quickly. As a result, hospitals may face slow decisions, lower efficiency, and missed improvement opportunities. That is exactly why the Neurology Hospitals KPI Dashboard in Power BI is such a valuable solution.
This ready-to-use dashboard helps neurology hospitals monitor, analyze, and improve performance through one powerful and interactive reporting system. Instead of spending hours reviewing disconnected data, you can view KPI performance, compare actual vs target values, track trends, and explore detailed KPI definitions in a single place. Moreover, this dashboard transforms raw hospital data into meaningful visuals and insights that support faster and smarter decisions. If you want to improve patient care, increase transparency, and strengthen hospital operations, this dashboard can become your next game-changing tool.
Key Feature of Neurology Hospitals KPI Dashboard in Power BI
📊 Interactive 3-Page KPI Dashboard
This dashboard includes 3 well-structured pages that give hospitals a complete view of KPI performance, trend analysis, and KPI definitions.
🎯 Track Actual vs Target Performance
Monitor both MTD (Month-to-Date) and YTD (Year-to-Date) values against targets so you can quickly identify which KPIs are performing well and which need attention.
📈 Visual KPI Trend Analysis
Use dynamic combo charts to compare Actual, Target, and Previous Year values for both MTD and YTD performance.
🧾 Detailed KPI Summary Table
Get all important KPI details in one place, including KPI Number, KPI Group, KPI Name, Unit, Type, and performance indicators.
🚦 Status Indicators for Faster Decisions
Easily understand performance with visual indicators like ▲ / ▼, helping users identify target-met and target-missed KPIs instantly.
🔍 Drill-Through KPI Definition Page
Review KPI formulas, definitions, type, and group using the dedicated KPI Definition page for deeper analysis.
📂 Excel-Based Data Source
The dashboard uses simple Excel sheets for actual values, target values, and KPI definitions, making updates easy and practical.
⚡ User-Friendly Filtering Experience
Apply slicers like Month Selector and KPI Group Selector to review performance from different perspectives.
What’s Inside the Neurology Hospitals KPI Dashboard in Power BI
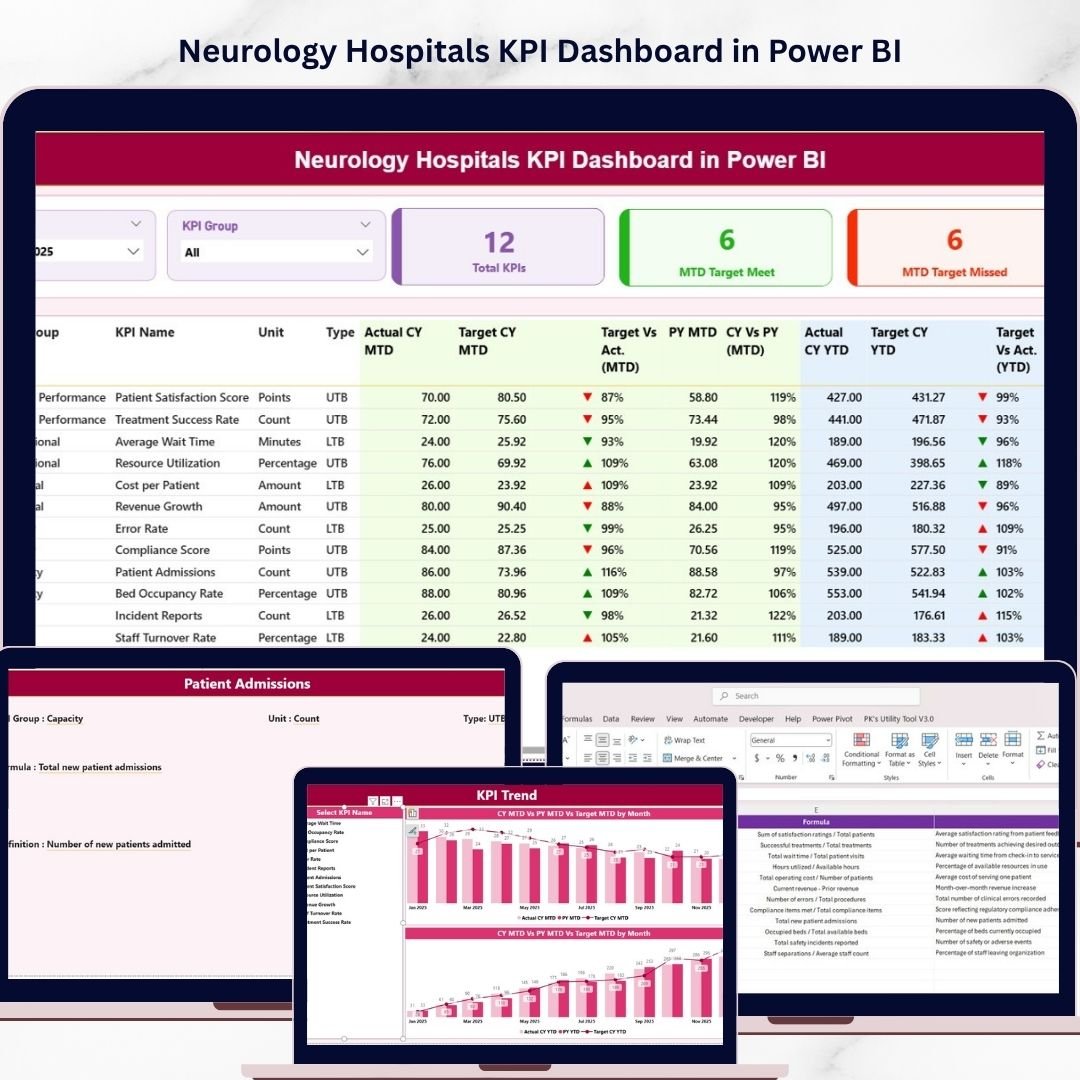
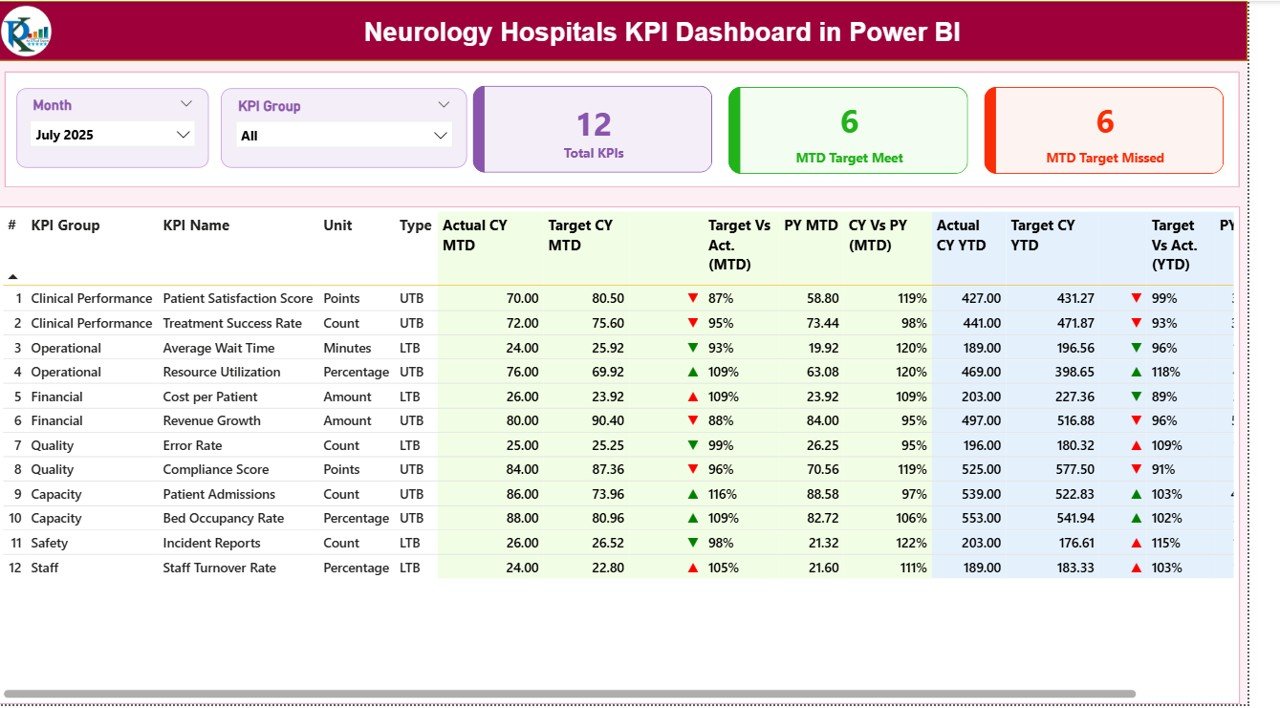
🖥️ Summary Page
This is the main performance overview page. It includes slicers, KPI cards, and a detailed KPI table with MTD and YTD metrics, status indicators, and comparison percentages.
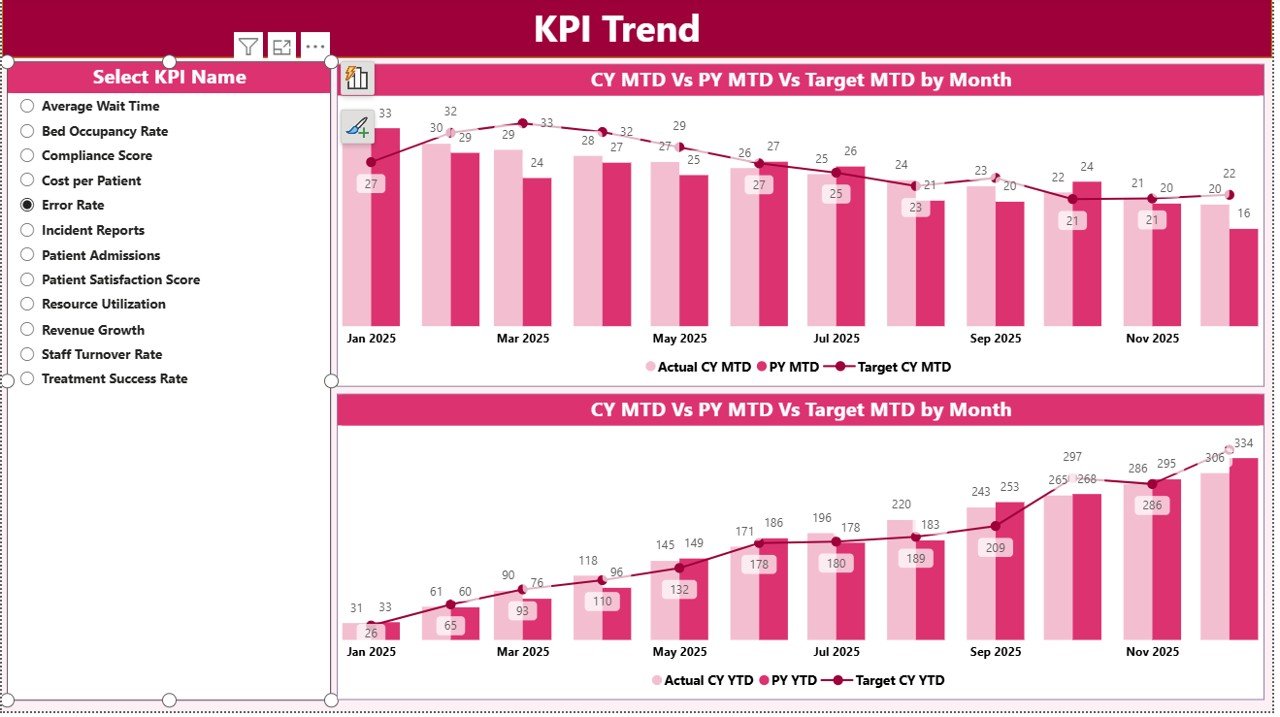
📉 KPI Trend Page
This page helps users visually analyze trends through two combo charts for MTD Trends and YTD Trends using actual, target, and previous-year values.
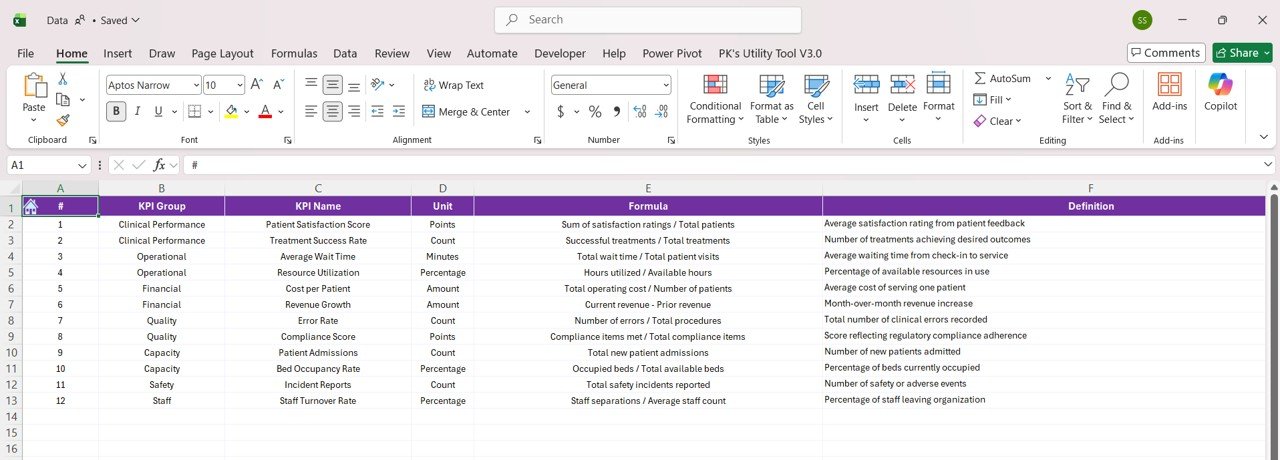
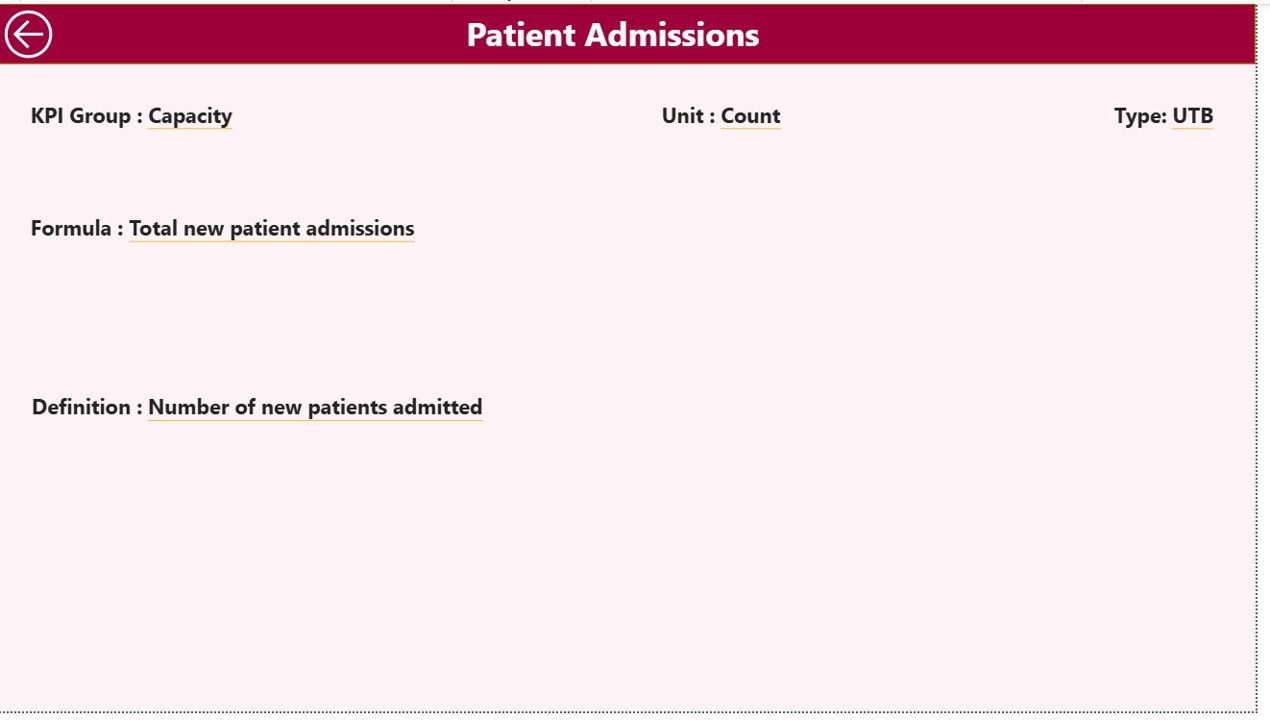
📘 KPI Definition Page
This drill-through page provides detailed KPI background, including formula, definition, KPI type, and KPI group for deeper understanding.
📊 Excel Input Structure
The dashboard is supported by three input sheets:
-
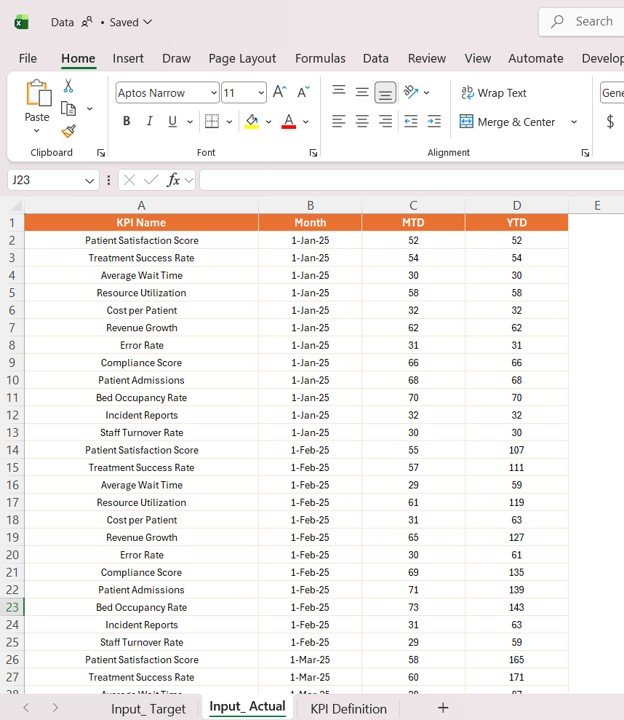
Input_Actual Sheet for actual KPI values
-
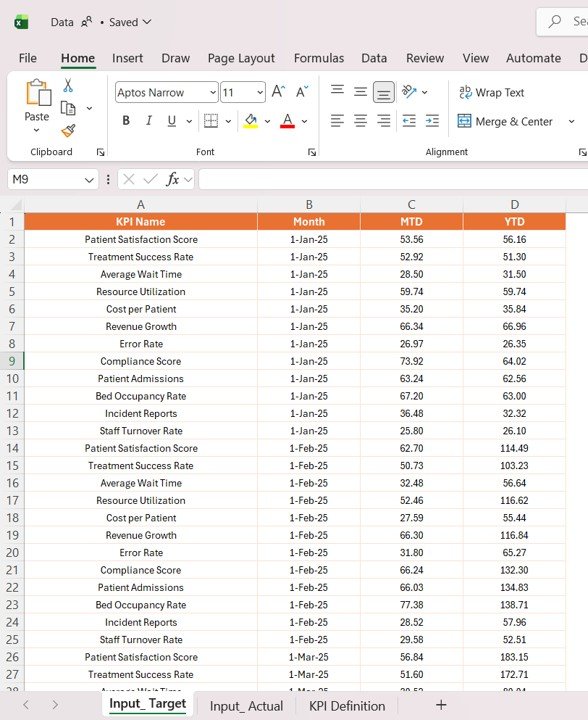
Input_Target Sheet for KPI target values
-
KPI Definition Sheet for KPI details and logic
Because of this simple structure, hospitals can maintain the dashboard without difficulty.
How to Use the Neurology Hospitals KPI Dashboard in Power BI
✅ Enter actual KPI data into the Input_Actual sheet
✅ Add target values into the Input_Target sheet
✅ Maintain KPI details in the KPI Definition sheet
✅ Refresh the Power BI dashboard
✅ Use the Month Selector and KPI Group Selector to filter the report
✅ Review the Summary Page first for an overall performance snapshot
✅ Open the KPI Trend Page to analyze trends over time
✅ Use the KPI Definition Page to understand KPI calculations and logic
This workflow makes it easy for hospital teams to move from raw data to actionable insights quickly.
Who Can Benefit from This Neurology Hospitals KPI Dashboard in Power BI
🏥 Hospital Administrators who want better visibility into operational and clinical KPI performance
👨⚕️ Neurology Department Heads who need to monitor treatment and service efficiency
📋 Healthcare Analysts who want structured and visual KPI reporting
💼 Management Teams who need actual vs target comparisons for better planning
🧠 Quality Improvement Teams who want to identify gaps and improve patient care outcomes
📊 Decision-Makers who need real-time insights for faster action
This dashboard is ideal for neurology hospitals that want to improve accountability, efficiency, and patient care through smart KPI tracking.
Click hare to read the Detailed blog post
Explore the full blog post to understand all dashboard pages, KPI structure, benefits, and best practices in detail.
Visit our YouTube channel to learn step-by-step video tutorials
Watch practical tutorials, dashboard demos, and reporting tips to get more value from your Power BI dashboards.


