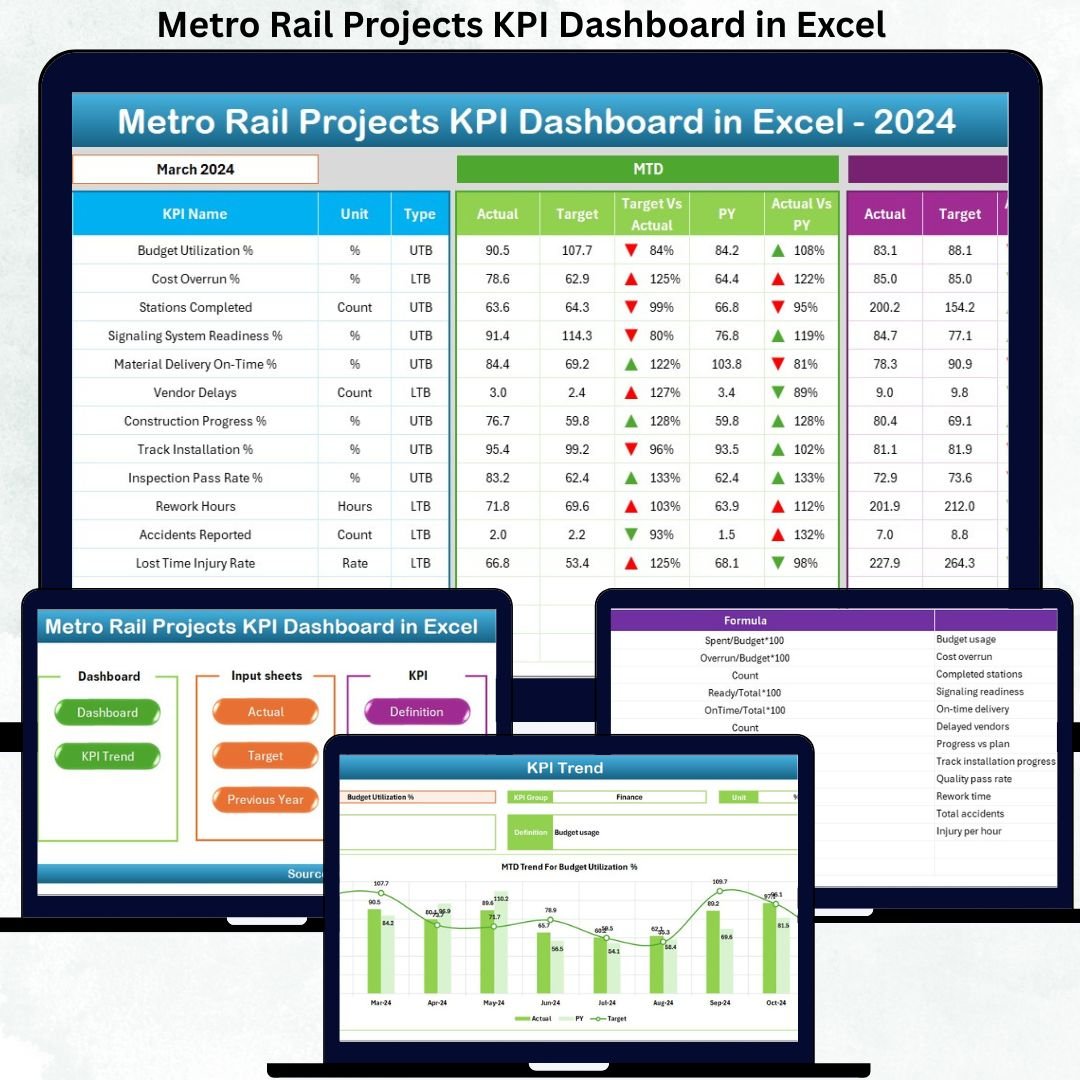
Metro Rail Projects KPI Dashboard in Excel is a powerful, ready-to-use Excel template designed to help metro project teams track performance with complete clarity and speed. As metro networks expand rapidly across major cities, project managers must monitor construction progress, operations, safety KPIs, asset health, cost performance, and revenue trends. Manual reporting often slows teams down—but this dashboard transforms your monthly review process into an efficient, data-driven experience.
This Excel dashboard gives you real-time insights, automated KPI calculations, easy navigation, and a structured reporting framework used by project teams, contractors, and metro authorities. Whether you’re managing tunneling progress, station construction, ridership, punctuality, or monthly expenditure, this tool helps you visualize performance instantly and make better decisions.
✨ Key Features of Metro Rail Projects KPI Dashboard in Excel
This dashboard has been designed with advanced yet easy-to-use features that make reporting smoother and more accurate.
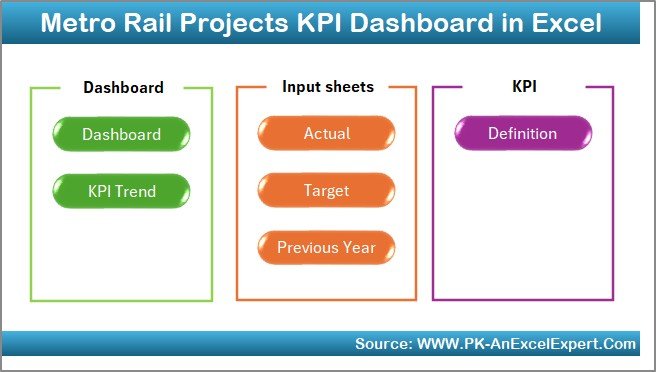
📌 Smart Navigation with Summary Page
Jump to any major sheet using six quick-access buttons. No more tab scrolling—perfect for meetings and new users.
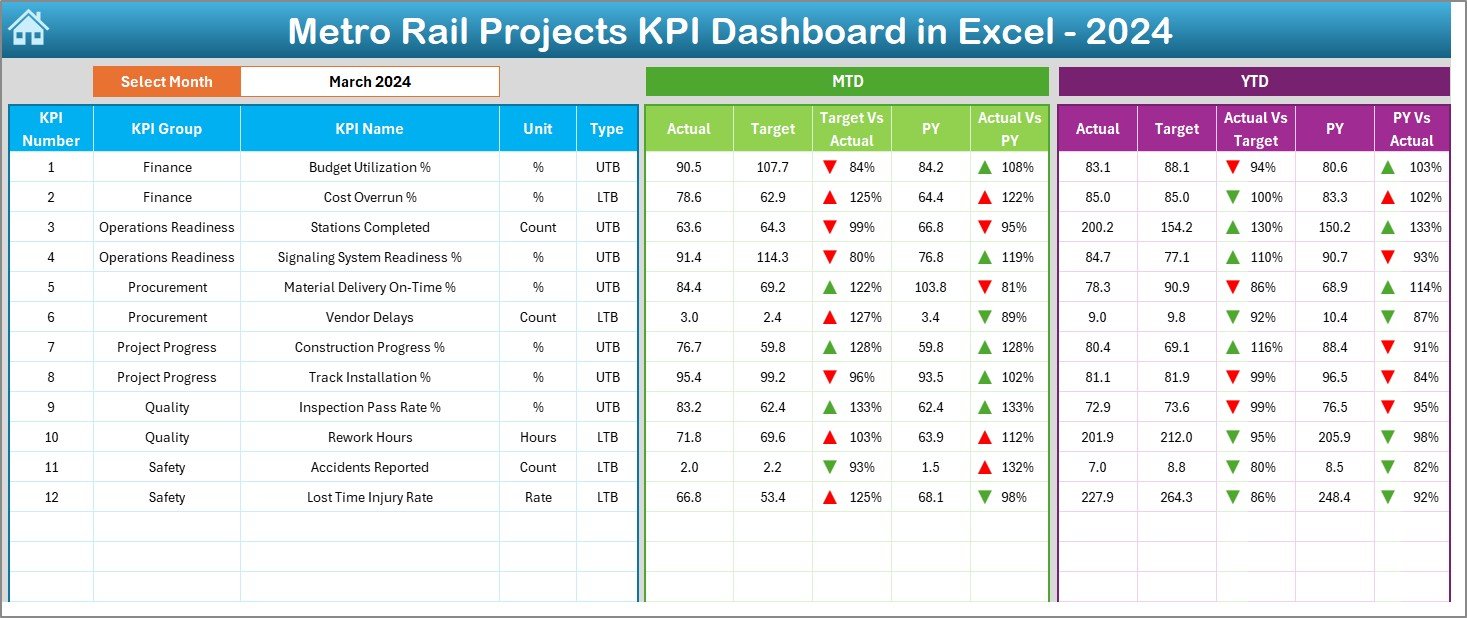
📌 Automated KPI Dashboard (MTD & YTD)
✔ Month selector with instant updates
✔ Actual vs Target performance
✔ Actual vs Previous Year comparison
✔ Conditional formatting arrows
✔ Clear MTD and YTD summaries
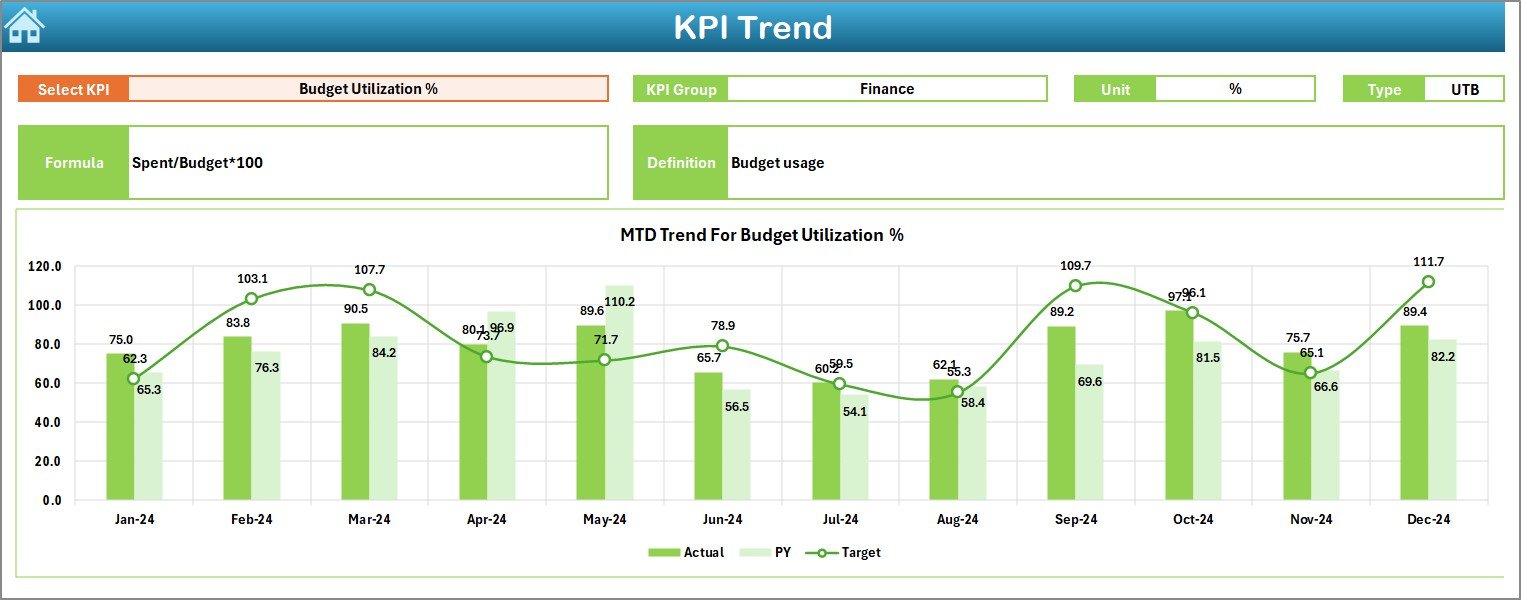
📌 Deep KPI Trend Analysis
Analyze any KPI using two trend charts (MTD & YTD). Spot patterns, improvements, seasonality, and performance gaps instantly.
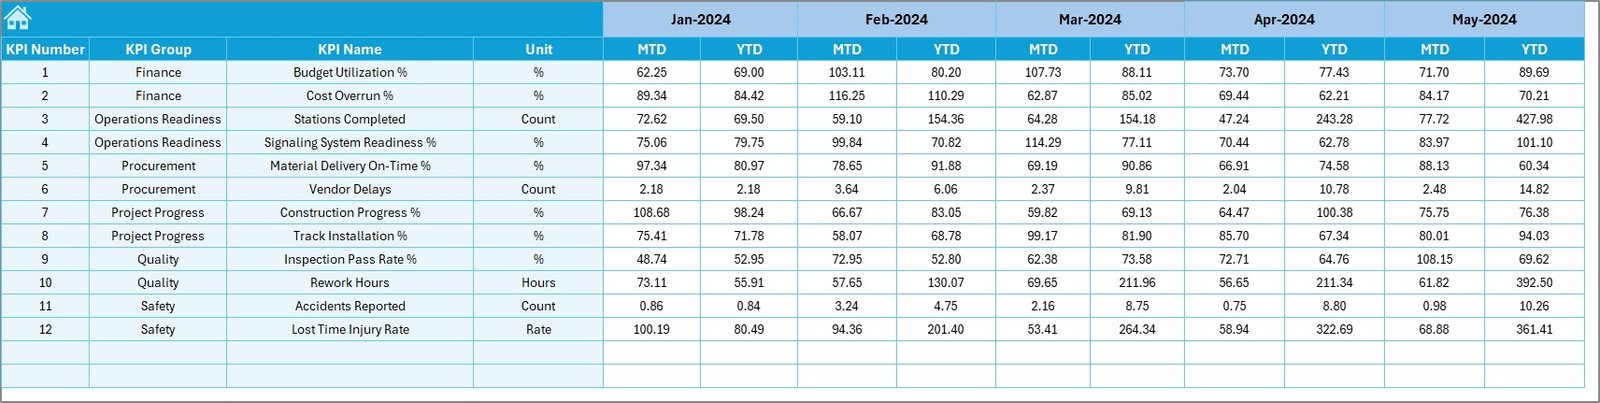
📌 Structured Data Input Sheets
Includes sheets for Actuals, Targets, Previous Year Data, and KPI Definitions—ensuring clean, accurate reporting every month.
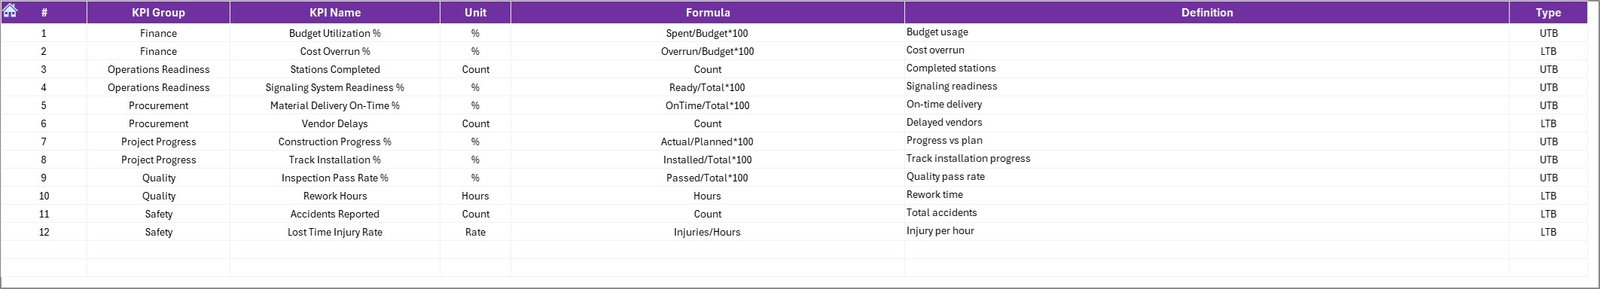
📌 KPI Dictionary for Standardized Reporting
Prevent calculation errors with a centralized sheet containing formulas, units, definitions, and KPI groups.
📦 What’s Inside the Metro Rail Projects KPI Dashboard in Excel
Inside this professional dashboard template, you get:
-
🗂 7 fully designed worksheets (Dashboard, Trend, Summary, Input Sheets & Definitions)
-
📊 Automatic KPI calculations
-
🎯 Actual, Target & Previous Year comparatives
-
📈 Trend visuals for better storytelling
-
💡 Editable structure—add or modify KPIs anytime
-
📘 Professional layout suitable for executive reporting
Every sheet has a defined purpose and works together to give you an end-to-end KPI monitoring system for metro rail projects.
🧭 How to Use the Metro Rail Projects KPI Dashboard in Excel
Using this dashboard is simple—no advanced Excel skills required!
⭐ Step 1: Add KPI Definitions
Define KPI names, units, formulas, and descriptions in the KPI Definition sheet.
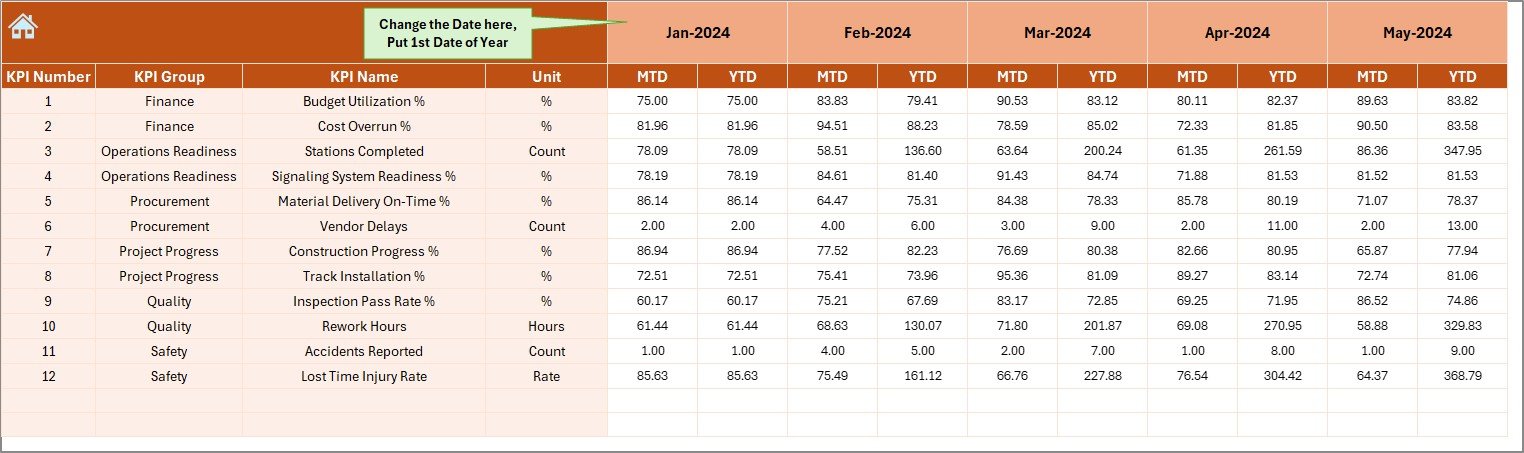
⭐ Step 2: Set the Starting Month
Update the first month in the Actual Numbers Input sheet—everything adjusts automatically.
⭐ Step 3: Enter Actual Values Monthly
Fill in MTD and YTD data for each KPI.
⭐ Step 4: Enter Monthly Targets
Update Monthly and Cumulative targets in the Target Sheet.
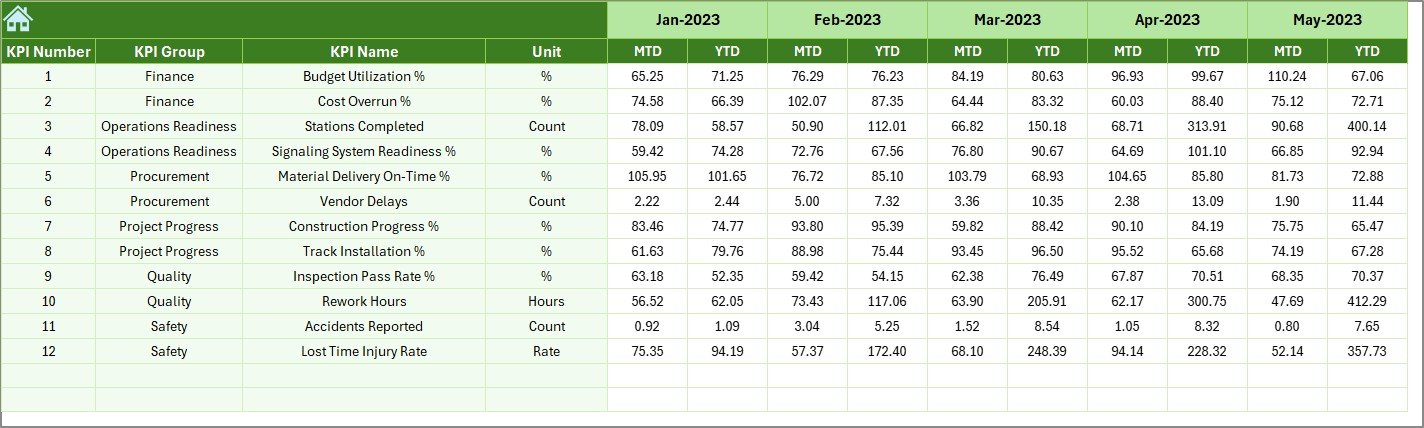
⭐ Step 5: Enter Previous Year Performance
Add the previous year’s values to support year-on-year comparisons.
⭐ Step 6: Review the Dashboard
Select any month from the drop-down and watch the entire dashboard update instantly.
⭐ Step 7: Use Trend Analysis
Pick a KPI and explore detailed MTD & YTD trend charts with insights.
This workflow ensures fast, error-free reporting every time.
🎯 Who Can Benefit from This Metro Rail Projects KPI Dashboard in Excel
This dashboard is built for anyone involved in metro construction or operations:
-
🚇 Metro Rail Project Teams
-
🏗 Construction & Civil Work Departments
-
🛤 Signaling, Trackwork & Rolling Stock Teams
-
📅 Planning & Scheduling Teams
-
🛑 Safety Departments
-
📊 Operations Monitoring Teams
-
💰 Finance & Budgeting Teams
-
👨💼 Executive Leadership & Government Authorities
-
🤝 Contractor & Vendor Management Teams
If your job requires performance tracking, progress reviews, cost monitoring, risk assessment, or operational insights—this dashboard will save you hours every month.
### Click here to read the Detailed blog post
Watch the step-by-step video tutorial:


Reviews
There are no reviews yet.