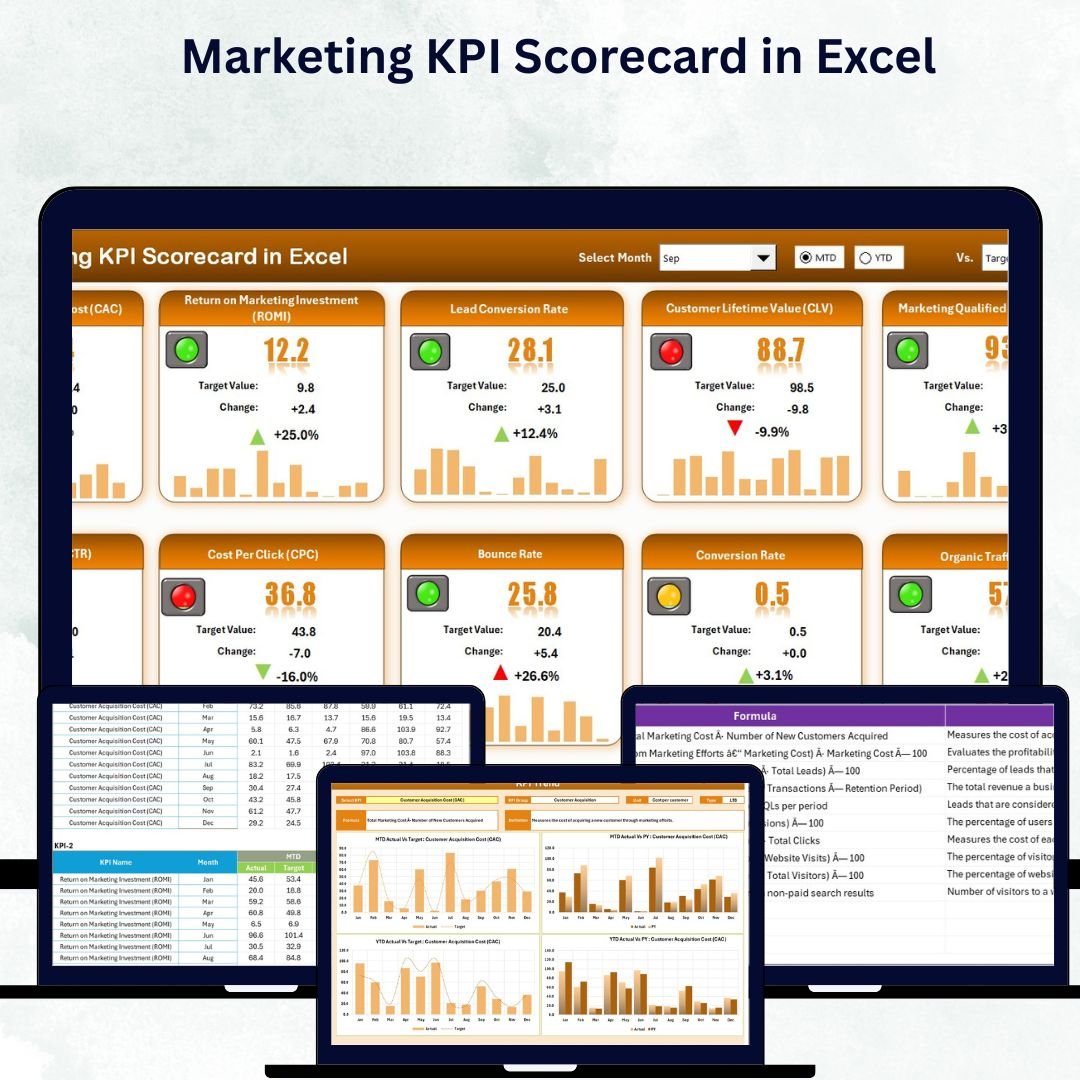
In the fast-moving world of marketing, tracking every campaign, lead, and conversion can quickly become overwhelming. That’s why the Marketing KPI Scorecard in Excel is the perfect solution — a ready-to-use, data-driven tool that brings all your marketing performance metrics into one organized and interactive dashboard.
This Excel-based scorecard transforms complex data into easy-to-read visuals, helping teams monitor Month-to-Date (MTD) and Year-to-Date (YTD) results, track progress toward targets, and make data-driven decisions — all without the need for expensive analytics platforms.
🧠 Key Features of Marketing KPI Scorecard in Excel
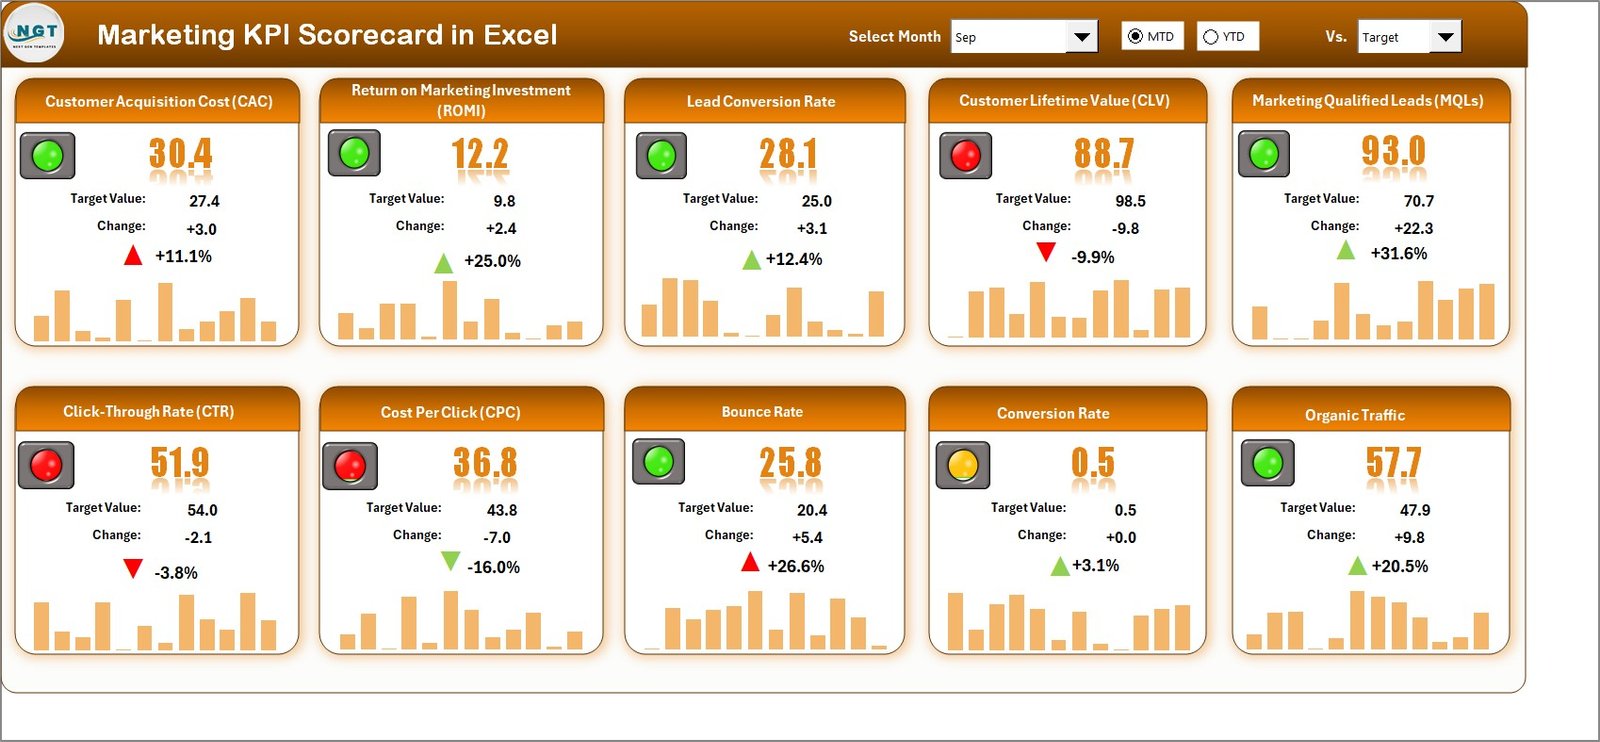
✨ All-in-One Dashboard: View your top 10 marketing KPIs in a single, dynamic sheet.
📊 MTD & YTD Comparison: Instantly switch between Month-to-Date and Year-to-Date performance.
🎯 Actual vs Target Tracking: Compare goals vs outcomes with automatic color-coded indicators.
📈 Trend Visualization: Analyze KPI growth patterns and historical performance with interactive charts.
💡 Automated Calculations: Enter your data once and watch your dashboard update automatically.
🧩 Customizable KPIs: Modify KPI names, units, and formulas to match your business needs.
🪶 Lightweight & Flexible: Works seamlessly in Excel without needing Power BI or complex add-ins.
🔒 Error-Free Reporting: Built-in formulas reduce human error and increase accuracy.
💼 Professional Design: Clean layout with dropdowns, slicers, and conditional formatting.
💰 Cost-Effective Solution: Avoid expensive subscription tools — Excel does it all!
📦 What’s Inside the Marketing KPI Scorecard in Excel
The template includes four expertly structured worksheets, each designed for clarity and ease of use:
1️⃣ Scorecard Sheet:
-
The main dashboard that displays 10 KPIs in one glance.
-
Dropdowns to switch between months or performance periods.
-
Green and red formatting for “on-track” vs “below-target” results.
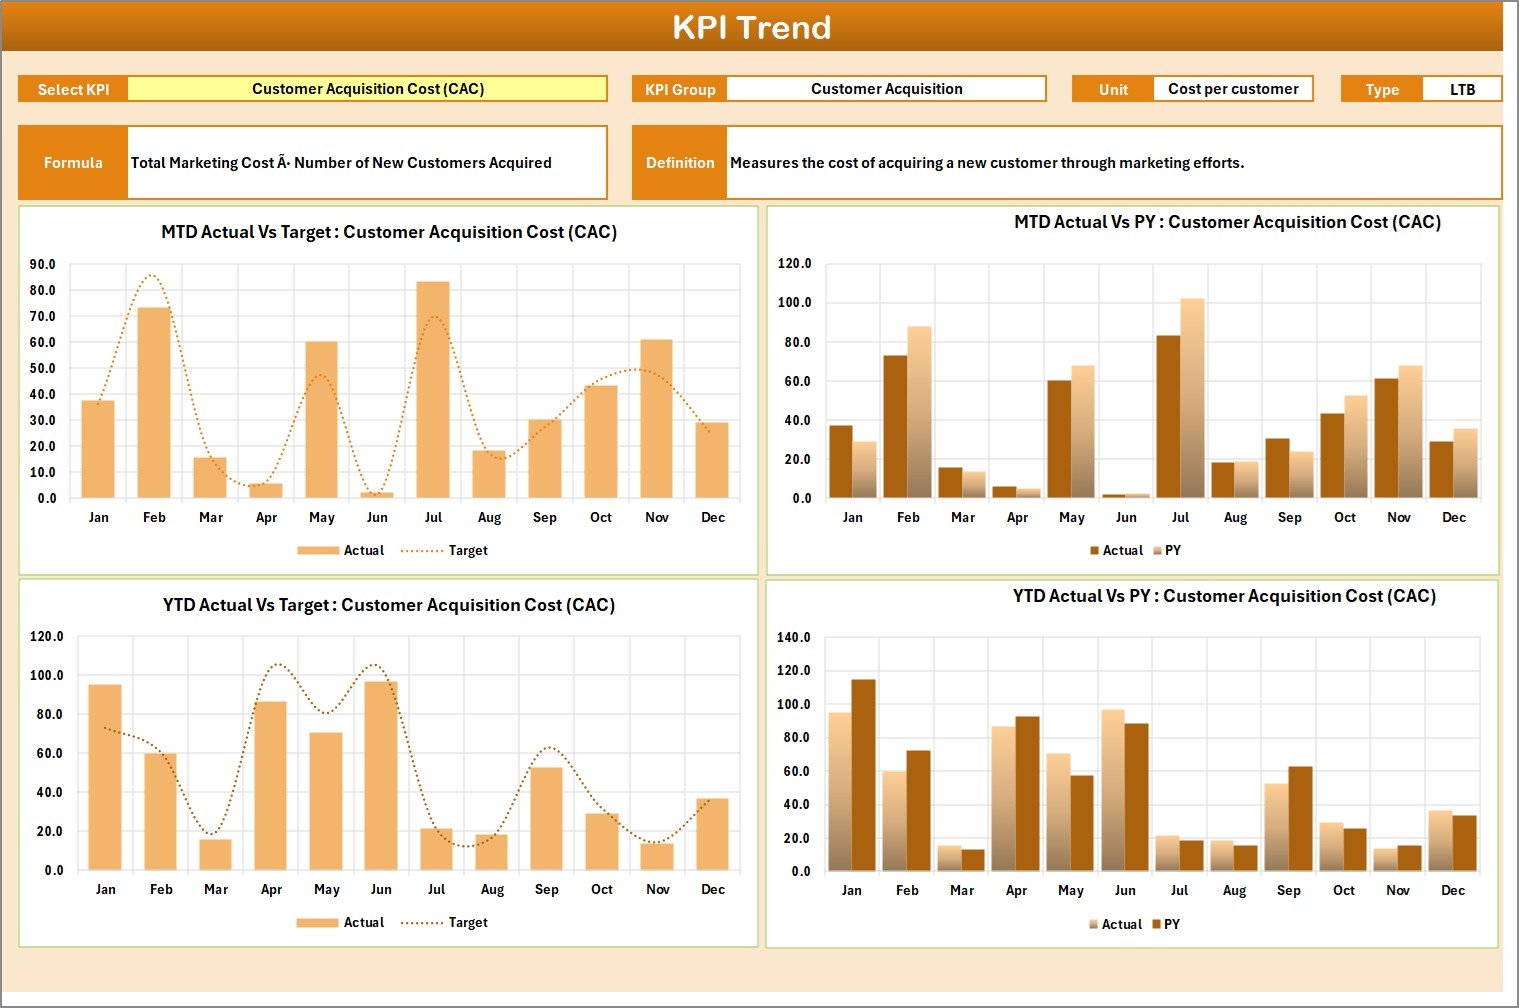
2️⃣ KPI Trend Sheet:
-
Choose a KPI from the dropdown to view its performance trend.
-
Dynamic line/column charts for Actual, Target, and Previous Year data.
-
Automatically displays KPI Group, Unit, Type, Formula, and Definition.
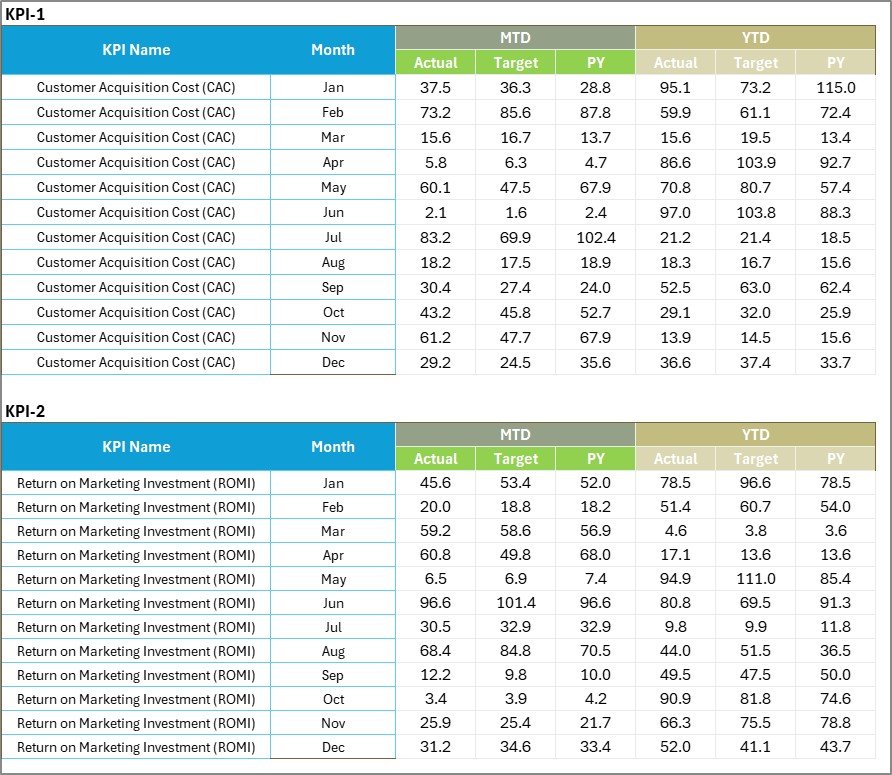
3️⃣ Input Data Sheet:
-
Enter your monthly actual, target, and previous-year data.
-
Flexible design for quick updates — all linked dashboards auto-refresh.
-
Compatible with imported data from Google Ads, Analytics, or CRM tools.
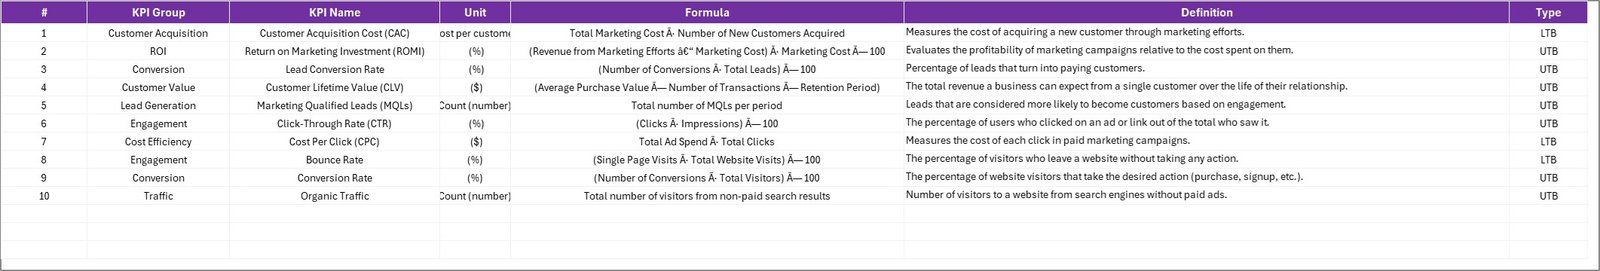
4️⃣ KPI Definition Sheet:
-
Acts as your KPI reference library.
-
Define KPI Name, Group, Unit, Formula, Definition, and Type (UTB/LTB).
-
Ensures consistency across your entire marketing team.
⚙️ How to Use the Marketing KPI Scorecard in Excel
Using this Excel tool is quick and intuitive:
1️⃣ Open the Input Data Sheet and record your monthly KPI values.
2️⃣ Define your KPIs in the KPI Definition Sheet for accuracy and reference.
3️⃣ Visit the Scorecard Sheet to monitor overall marketing performance.
4️⃣ Explore the KPI Trend Sheet to analyze trends, patterns, and seasonality.
5️⃣ Adjust targets or strategies based on your visualized insights.
In just a few clicks, your raw marketing data turns into meaningful, actionable insights!
👥 Who Can Benefit from This Marketing KPI Scorecard
🎯 Marketing Managers: To assess campaign success and allocate budgets efficiently.
🏢 Agencies: To report marketing results to clients professionally.
📱 Digital Marketers: To track social media, ads, and lead generation KPIs.
💻 Startups: To maintain cost-effective visibility over all marketing activities.
📊 Executives: To make data-backed decisions and optimize ROI.
💡 Analysts: To visualize trends, identify bottlenecks, and refine future strategies.
This template is perfect for anyone aiming to turn their marketing performance into measurable business success.
Click here to read the Detailed Blog Post
h3>Watch the step-by-step video tutorial:


Reviews
There are no reviews yet.