Luxury is about precision. Behind every premium handbag brand, powerful numbers decide growth, margins, and long-term success. If you are still managing your performance through scattered spreadsheets, you are leaving profit on the table.
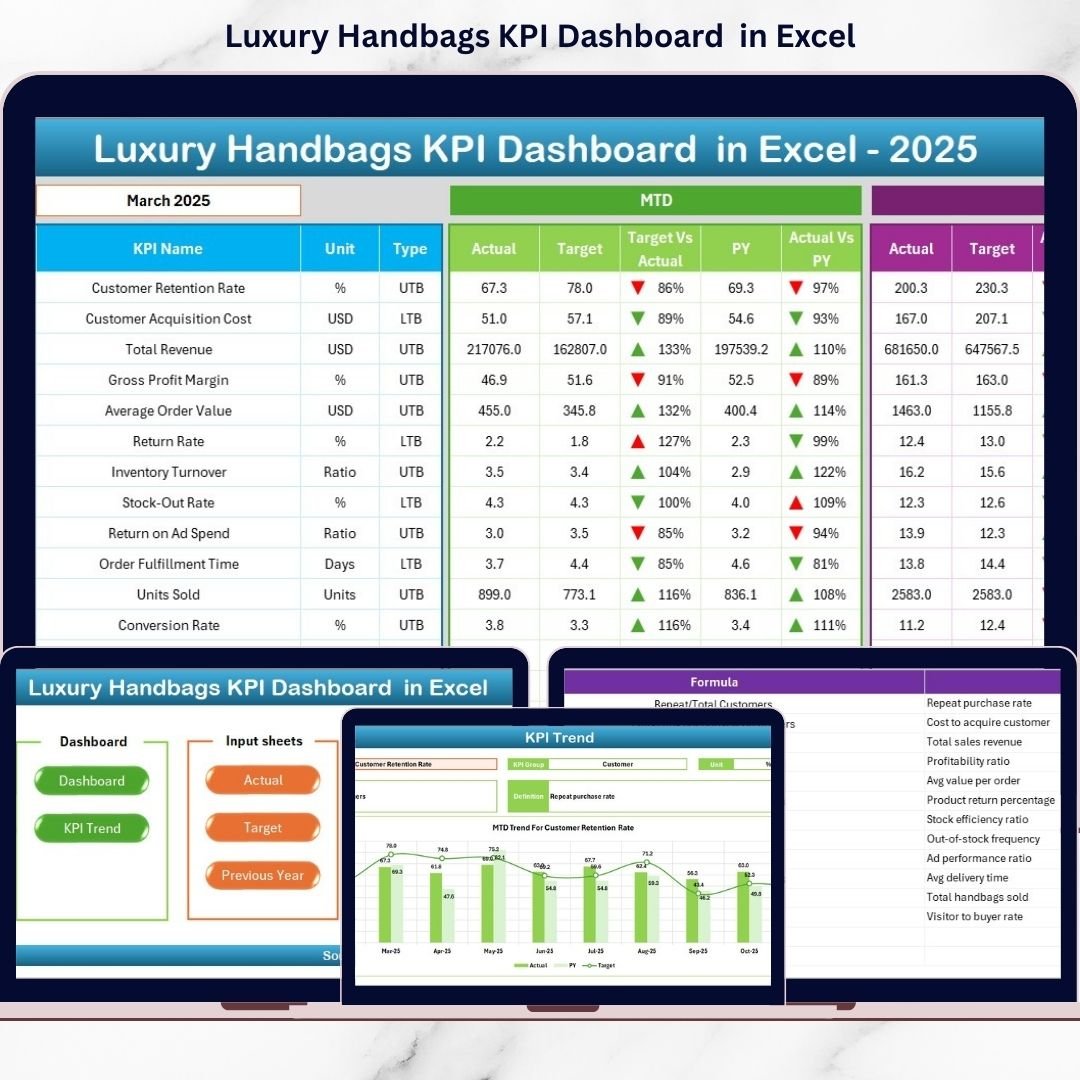
The Luxury Handbags KPI Dashboard in Excel is a ready-to-use, professionally designed performance management system created specifically for premium handbag retailers, distributors, and brand owners.
Track revenue. Monitor margins. Control inventory. Compare targets. Analyze trends.
All inside one powerful Excel file.
No complex software. No expensive BI tools. Just clear, structured business visibility.
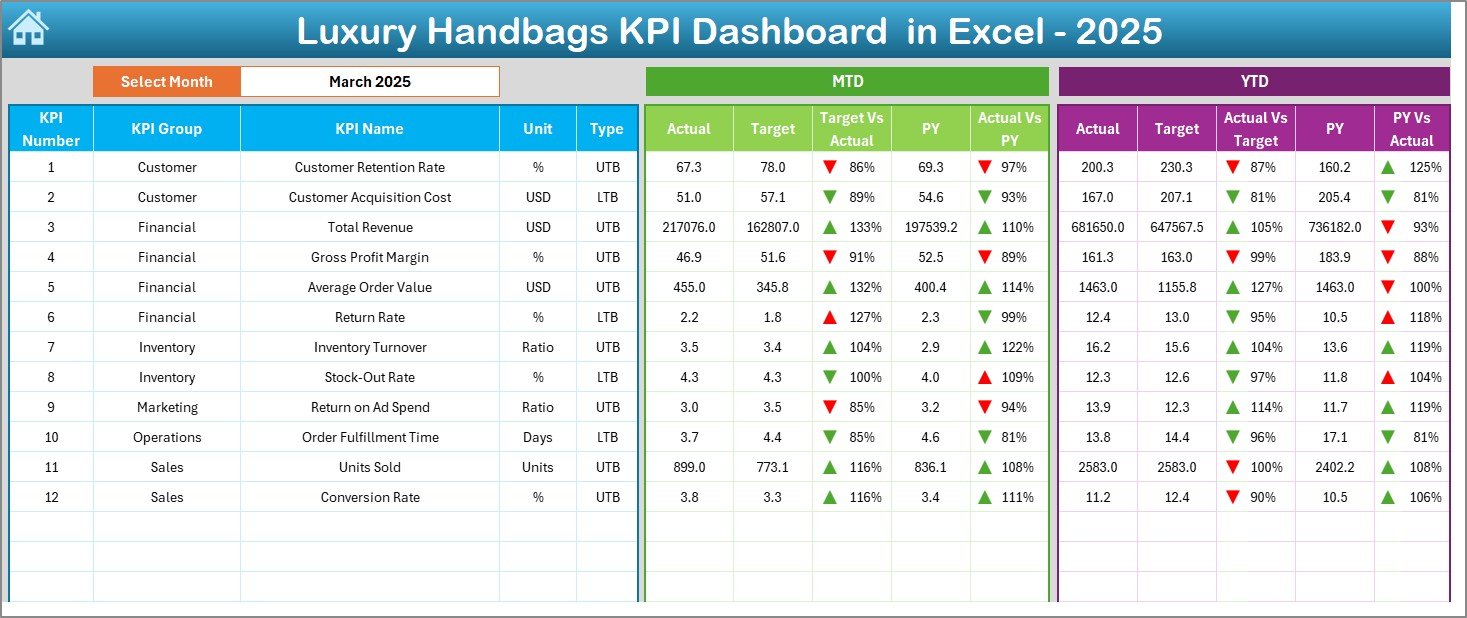
This dashboard helps you monitor Monthly (MTD) and Year-to-Date (YTD) performance, compare Actual vs Target vs Previous Year, and instantly identify profit gaps using smart visual indicators.
If you want clarity, control, and confidence in your luxury handbag business — this tool is built for you.
✨ Key Features of Luxury Handbags KPI Dashboard in Excel
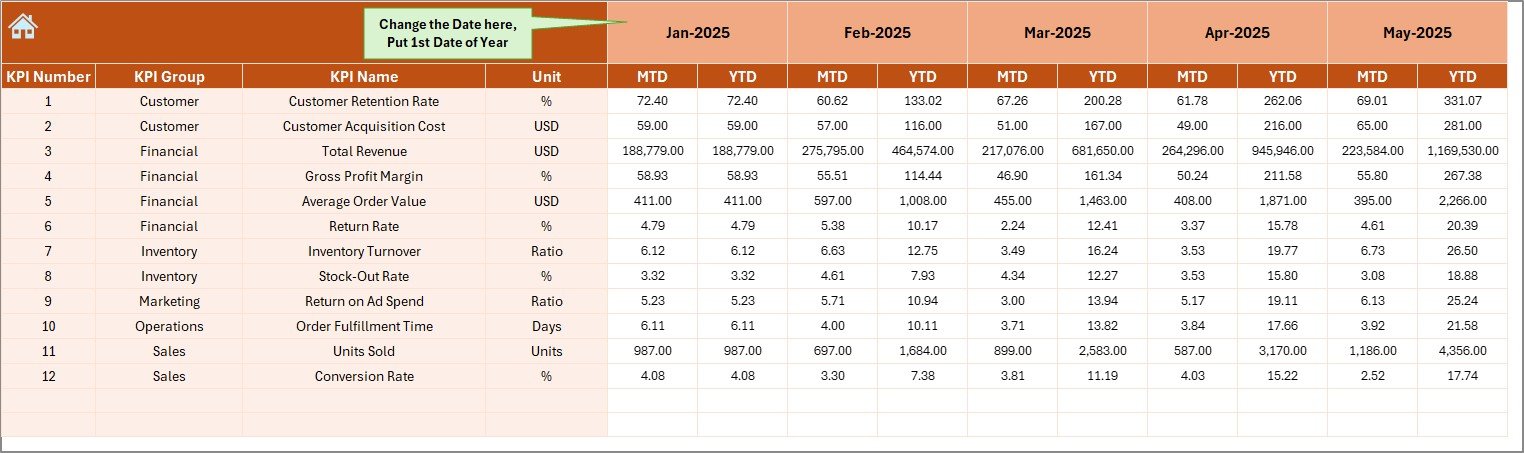
📊 Dynamic Month Selection (Cell D3) – Select any month and watch the entire dashboard update instantly.
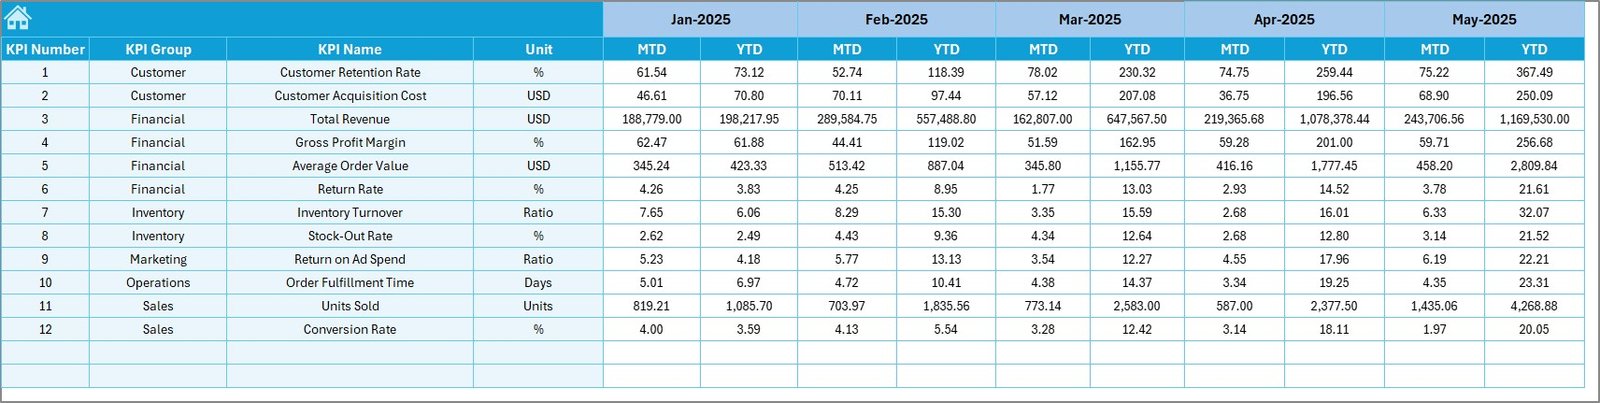
📈 MTD & YTD Performance Tracking – Monitor short-term and long-term performance together.
🎯 Target vs Actual Comparison – Instantly see achievement gaps with clear arrow indicators.
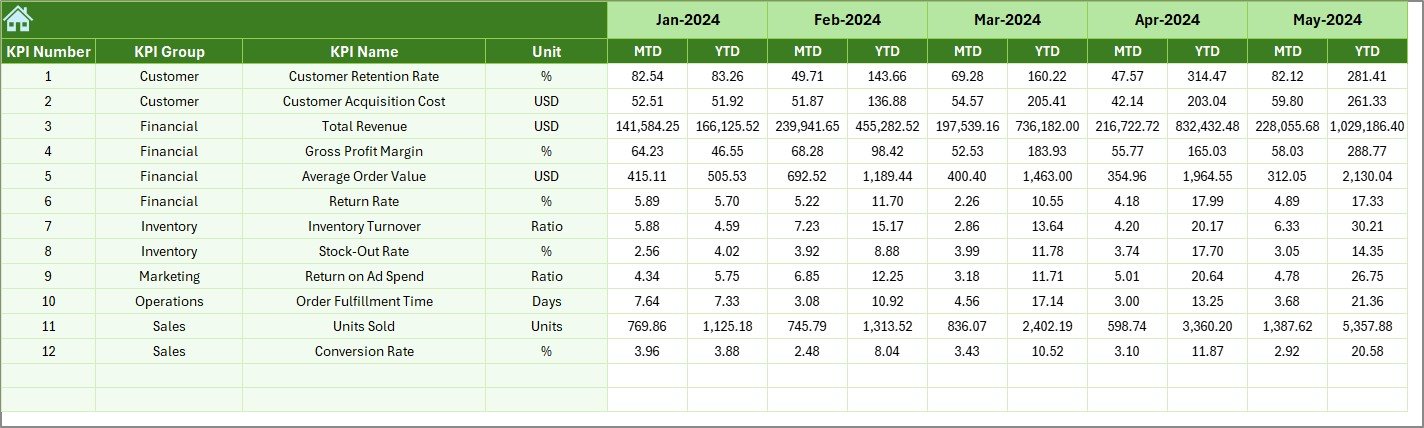
📅 Previous Year Comparison – Track year-over-year growth and seasonal performance.
📉 Conditional Formatting Indicators – Up and down arrows highlight performance direction.
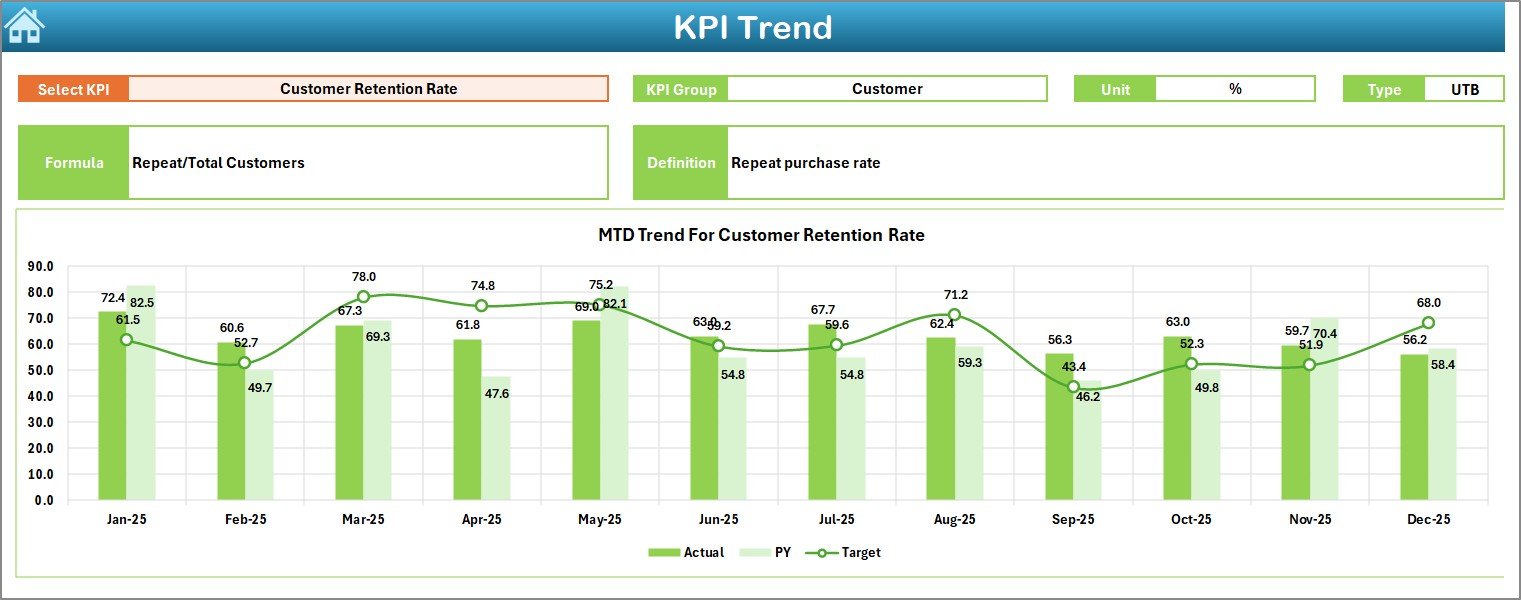
📊 KPI Trend Analysis Page – Visual MTD and YTD trend charts for deep insights.
🧾 Dedicated Input Sheets – Structured sheets for Actual, Target, and Previous Year data.
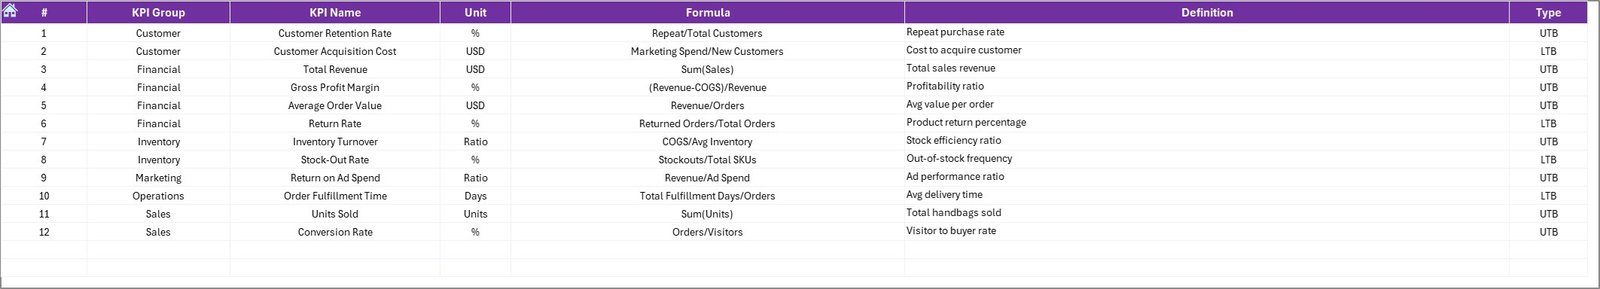
⚙️ Editable KPI Definition Sheet – Modify KPIs, formulas, and units anytime.
💼 Business-Friendly Design – Clean layout, easy navigation, no technical expertise required.
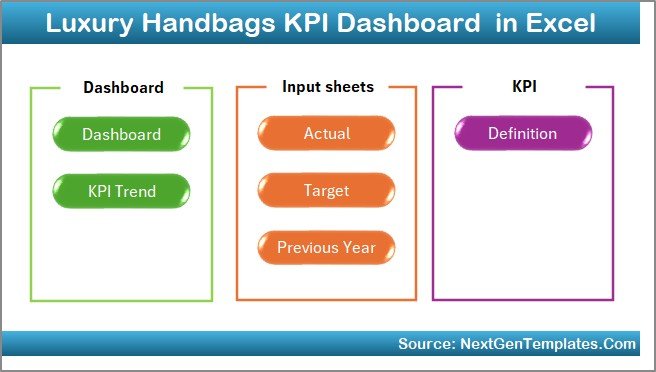
📂 What’s Inside the Luxury Handbags KPI Dashboard in Excel
This dashboard contains 7 professionally structured worksheets:
1️⃣ Summary Page – Navigation hub with quick-access buttons.
2️⃣ Dashboard Sheet – Main control center showing all KPIs with MTD and YTD metrics.
3️⃣ Trend Sheet – Deep KPI analysis with charts and definitions.
4️⃣ Actual Input Sheet – Monthly performance data entry area.
5️⃣ Target Sheet – Set monthly MTD and YTD targets.
6️⃣ Previous Year Sheet – Historical data comparison.
7️⃣ KPI Definition Sheet – Manage KPI names, units, formulas, and type (UTB/LTB).
You also track critical business KPIs such as:
-
Total Sales Revenue
-
Gross Margin %
-
Inventory Turnover Ratio
-
Sell-Through Rate
-
Average Order Value
-
Repeat Purchase Rate
-
Dead Stock %
-
Customer Acquisition Cost
Everything is centralized for smarter decision-making.
🚀 How to Use the Luxury Handbags KPI Dashboard in Excel
Using this dashboard is simple:
-
Define your KPIs in the KPI Definition sheet.
-
Enter previous year data for historical comparison.
-
Set monthly targets in the Target sheet.
-
Enter actual performance numbers each month.
-
Select the month in cell D3.
-
Review MTD and YTD performance.
-
Conduct monthly strategy meetings using dashboard insights.
Within 2–3 months, you will notice clearer trend visibility and improved operational control.
👑 Who Can Benefit from This Luxury Handbags KPI Dashboard?
✔ Luxury handbag retailers
✔ Premium boutiques
✔ Multi-store luxury chains
✔ Brand distributors
✔ Fashion brand owners
✔ Inventory managers
✔ Sales heads
✔ Business analysts
Whether you run a single boutique or manage multiple premium outlets, this dashboard adapts to your structure.
Luxury products come with high margins and high risk. A 5% drop in margin can significantly impact profits. Slow-moving inventory blocks capital. Missed trend analysis delays strategy changes.
This dashboard prevents those mistakes.
It helps you:
-
Protect margins
-
Monitor stock movement
-
Improve sell-through rate
-
Increase repeat purchase rate
-
Align targets with real performance
Unlike costly analytics tools, this Excel-based solution is budget-friendly and scalable. You can customize KPIs anytime without redesigning the system.
If you want structured growth backed by real data, this dashboard gives you the competitive edge.
Click here to read the Detailed blog post
Watch the step-by-step video tutorial: