Logistics cost management is the backbone of a healthy supply chain. When transportation expenses increase, warehouse productivity drops, or delivery accuracy decreases, logistics inefficiencies begin to drain profit margins. To avoid these cost leakages and stay operationally strong, businesses need a clear and structured way to track logistics KPIs month over month and year over year.
The Logistics Cost Optimization KPI Dashboard in Google Sheets is a powerful, ready-to-use solution that helps supply chain, procurement, warehousing, and distribution teams monitor logistics performance in real time. With automated KPIs, MTD/YTD comparisons, conditional formatting, and deep trend analysis, this dashboard provides full visibility into transportation costs, warehouse performance, fleet utilization, delivery metrics, and operational efficiency — all inside an easy-to-use Google Sheets file.
Whether you manage a small distribution network or a large multi-location fleet, this dashboard equips your teams with the insights they need to reduce expenses, optimize workflow, and improve logistics decision-making.
Key Features of the Logistics Cost Optimization KPI Dashboard in Google Sheets
This dashboard is structured into 6 powerful worksheets, each serving a unique purpose for cost tracking and performance evaluation.
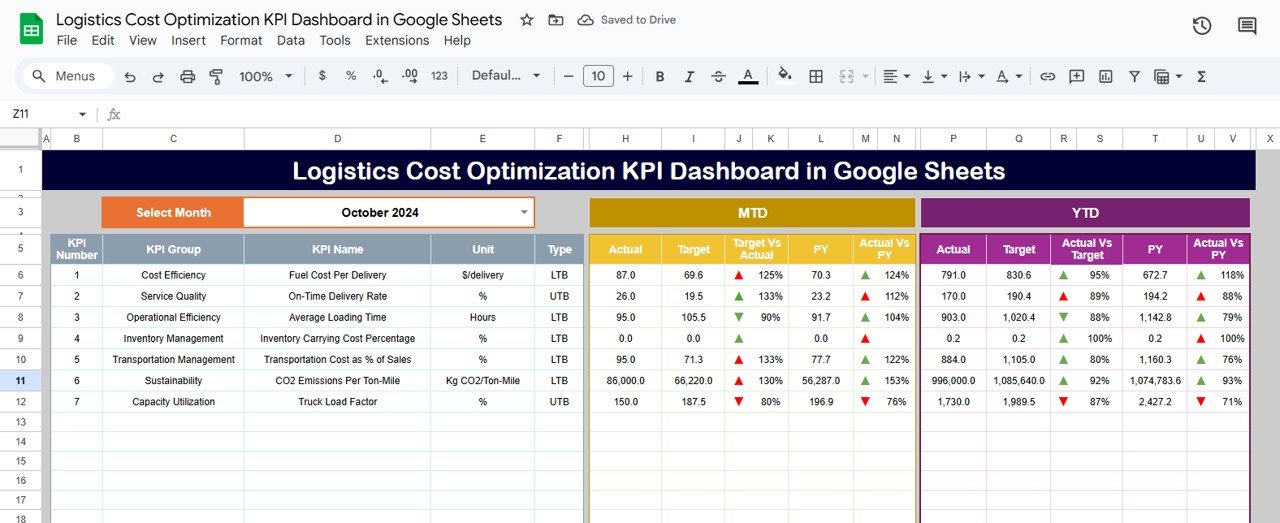
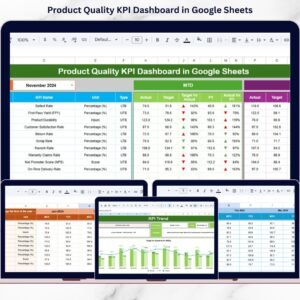
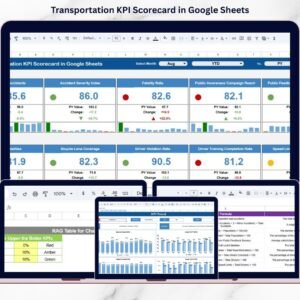
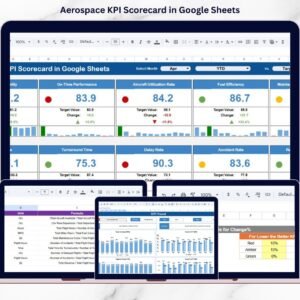
✨ Interactive Main Dashboard – Displays all KPIs with MTD, YTD, Target, and Previous Year comparisons.
📅 Month Selector (D3) – Switch between months and update all charts and values instantly.
📊 MTD & YTD Indicators – Compare current performance against targets and previous year values.
⬆️⬇️ Conditional Formatting Arrows – Green ↑ for improvement, Red ↓ for decline.
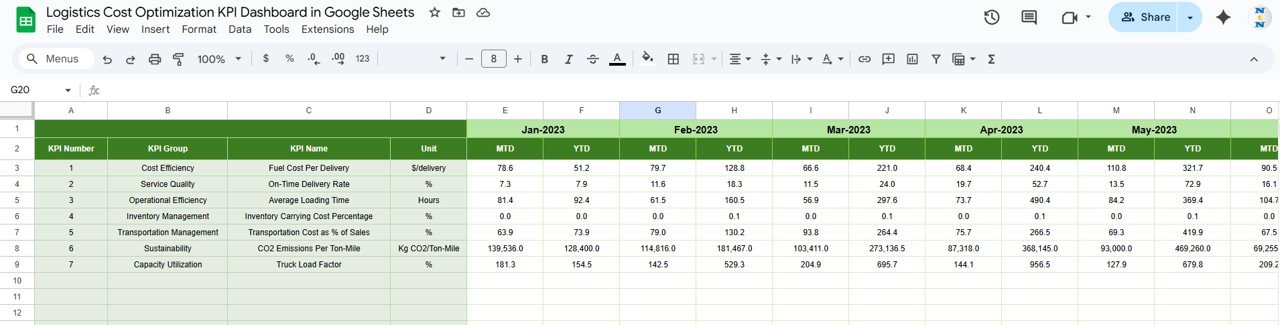
📈 KPI Trend Analysis Sheet – View month-by-month KPI movement with formulas, units, and definitions.
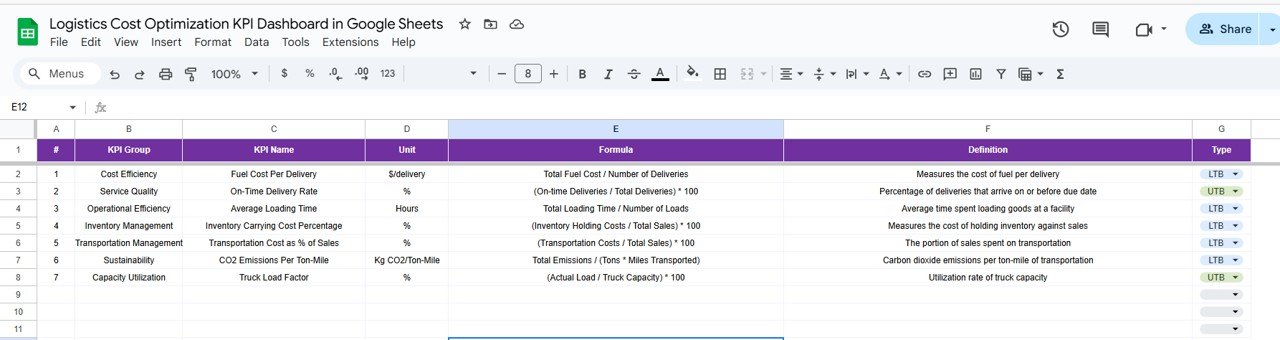
📑 KPI Definition Sheet – Each KPI includes a formula, unit, group, definition, and type (UTB/LTB).
📘 Actual, Target & Previous Year Sheets – Enter values in an organized structure for accurate dashboard calculations.
☁️ Cloud-Based Accessibility – No installations required; works anywhere with Google Sheets.
These features ensure accuracy, visibility, and data-driven logistics optimization.
What’s Inside the Logistics Cost Optimization KPI Dashboard in Google Sheets
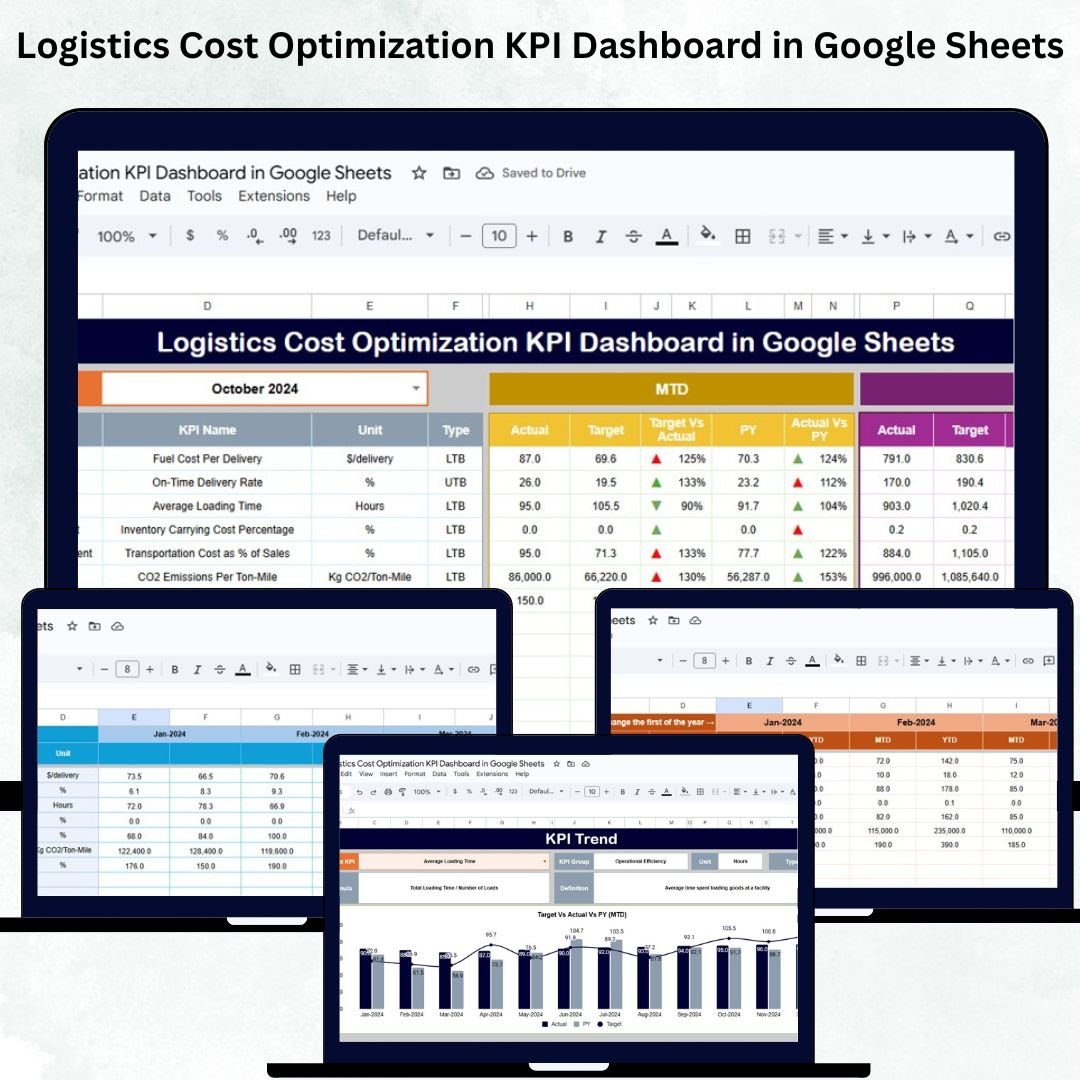
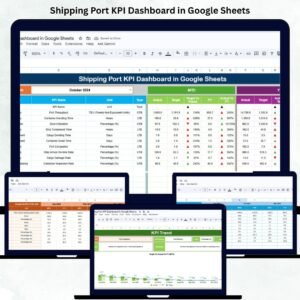
🟦 Dashboard Sheet Tab (Main Dashboard)
This is the core of the system — where all major KPIs appear with dynamic updates.
It includes:
-
MTD Actual, Target & PY Values
-
YTD Actual, Target & PY Values
-
Trend arrows for instant improvement/decline insights
-
Clear KPI groupings for transportation, warehousing, fleet, delivery, and cost performance
The dashboard helps you quickly spot cost leakages, operational inefficiencies, and high-impact improvement areas.
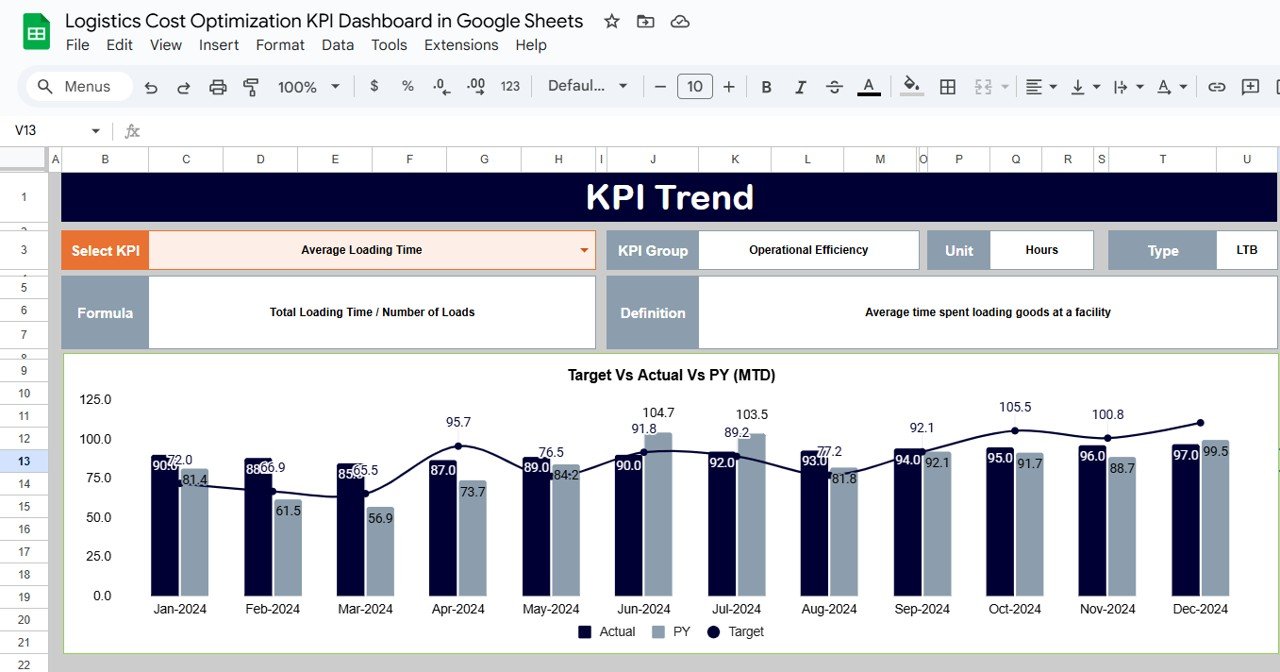
🟧 KPI Trend Sheet Tab
This sheet provides deep monthly trend analysis for each KPI.
Includes:
-
KPI Dropdown (C3)
-
KPI Group
-
Unit (USD, %, Hours, Score, etc.)
-
KPI Formula
-
Type (UTB/LTB)
-
Definition
This helps teams understand patterns, monitor seasonal cost variations, and predict upcoming logistics challenges.
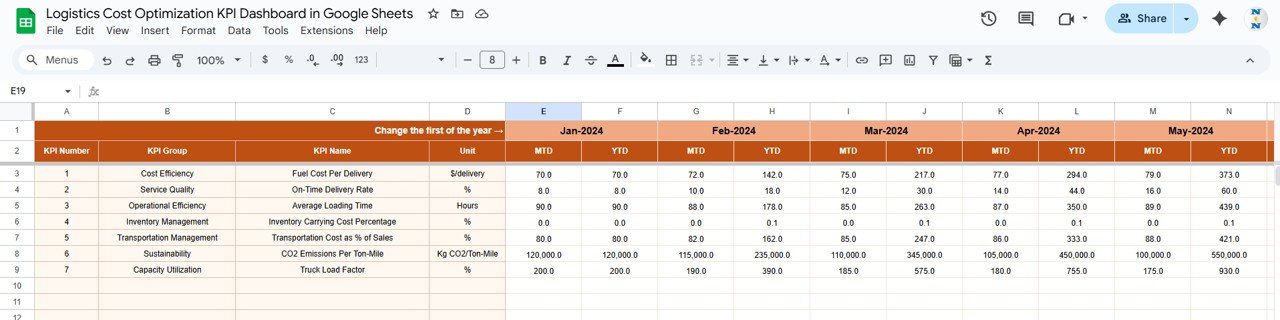
🟩 Actual Number Sheet Tab
Enter MTD and YTD actual numbers here.
The dashboard pulls all performance metrics from this sheet automatically.
🟨 Target Sheet Tab
Set monthly and yearly targets for each KPI.
Useful for:
-
Budget planning
-
Performance benchmarking
-
Goal setting for transport, warehouse, and fleet teams
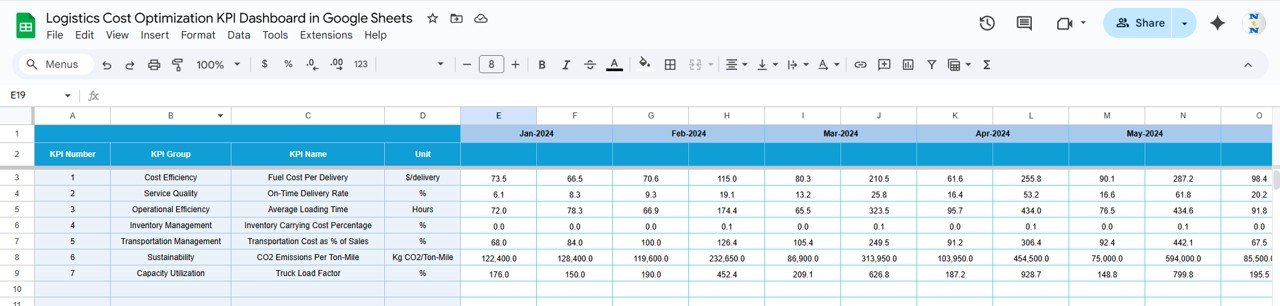
🟪 Previous Year Numbers Sheet Tab
Store previous-year values for both MTD and YTD.
This is essential for identifying real growth, cost reductions, or operational declines.
🟫 KPI Definition Sheet Tab
Includes:
-
KPI Name
-
Group
-
Formula
-
Unit
-
Definition
-
Type (UTB/LTB)
This makes the dashboard professional, transparent, and easy for all departments to understand.
How to Use the Logistics Cost Optimization KPI Dashboard in Google Sheets
🔹 Step 1: Update Actual Values monthly in the Actual Sheet.
🔹 Step 2: Set MTD & YTD targets in the Target Sheet.
🔹 Step 3: Input Previous Year values for accurate benchmarking.
🔹 Step 4: Use the Dashboard Sheet to analyze cost and efficiency performance.
🔹 Step 5: Use conditional arrows to identify improvement or decline.
🔹 Step 6: Track KPI patterns in the Trend Sheet for monthly insights.
🔹 Step 7: Use findings to optimize routes, reduce freight costs, and improve warehouse efficiency.
All updates reflect instantly throughout the dashboard.
Who Can Benefit from the Logistics Cost Optimization KPI Dashboard in Google Sheets
🚚 Supply Chain Teams – Analyze logistics performance and cost trends.
🏭 Warehouse & Operations Managers – Track efficiency, labor utilization, and storage costs.
📦 Procurement Teams – Compare supplier and carrier performance.
📍 Transport & Fleet Managers – Monitor fleet utilization, fuel efficiency, and delivery metrics.
📊 Finance Teams – Improve budgeting and reduce operational cost leaks.
📈 Logistics Analysts – Gain visibility across all logistics KPIs.
Any business with a supply chain structure can benefit immensely from this dashboard.
Click here to read the Detailed blog post
Watch the step-by-step video Demo:


Reviews
There are no reviews yet.