Modern factories invest millions in automation. But here’s the truth — without proper KPI tracking, even the most advanced machines underperform.
If you’re still managing machine data through scattered Excel sheets and manual reports, you’re losing visibility, speed, and control.
It’s time to centralize everything.
The Industrial Automation Equipment KPI Dashboard in Power BI is a ready-to-use, interactive performance monitoring system designed to help manufacturing and automation companies track equipment efficiency, downtime, output, and cost metrics — all in one structured dashboard.
This powerful solution transforms raw production data into actionable insights using interactive visuals, MTD and YTD comparisons, and year-over-year analysis.
Stop guessing. Start optimizing.
🚀 Key Feature of Industrial Automation Equipment KPI Dashboard in Power BI
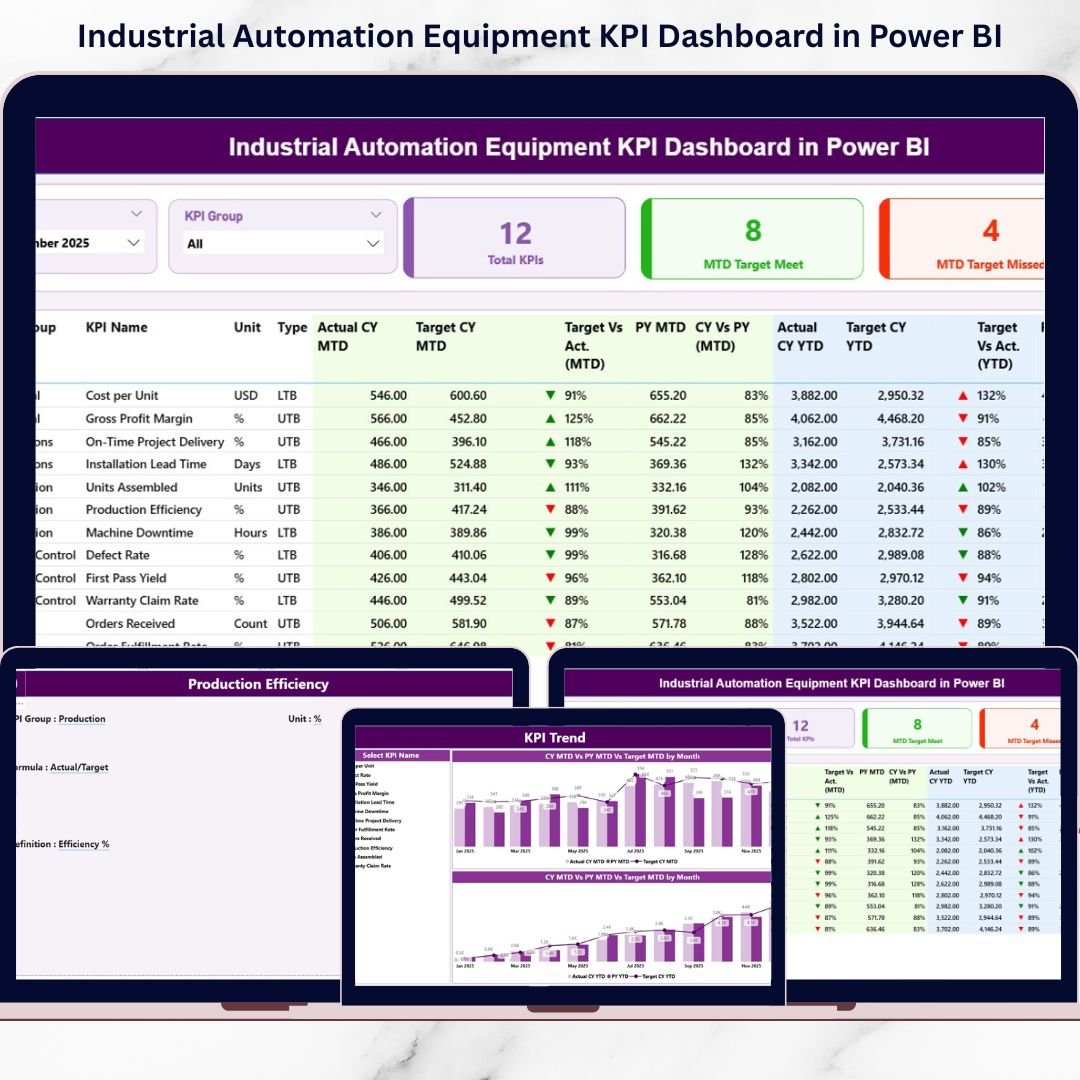
✨ Interactive Summary Page
Monitor total KPIs, target met vs missed count, and detailed KPI performance in one view.
📊 MTD & YTD Comparison
Track Month-to-Date and Year-to-Date performance with automatic calculations.
🎯 Target vs Actual Indicators
Instantly identify performance gaps using green ▲ and red ▼ icons.
📈 Year-over-Year (CY vs PY) Analysis
Compare current year with previous year performance effortlessly.
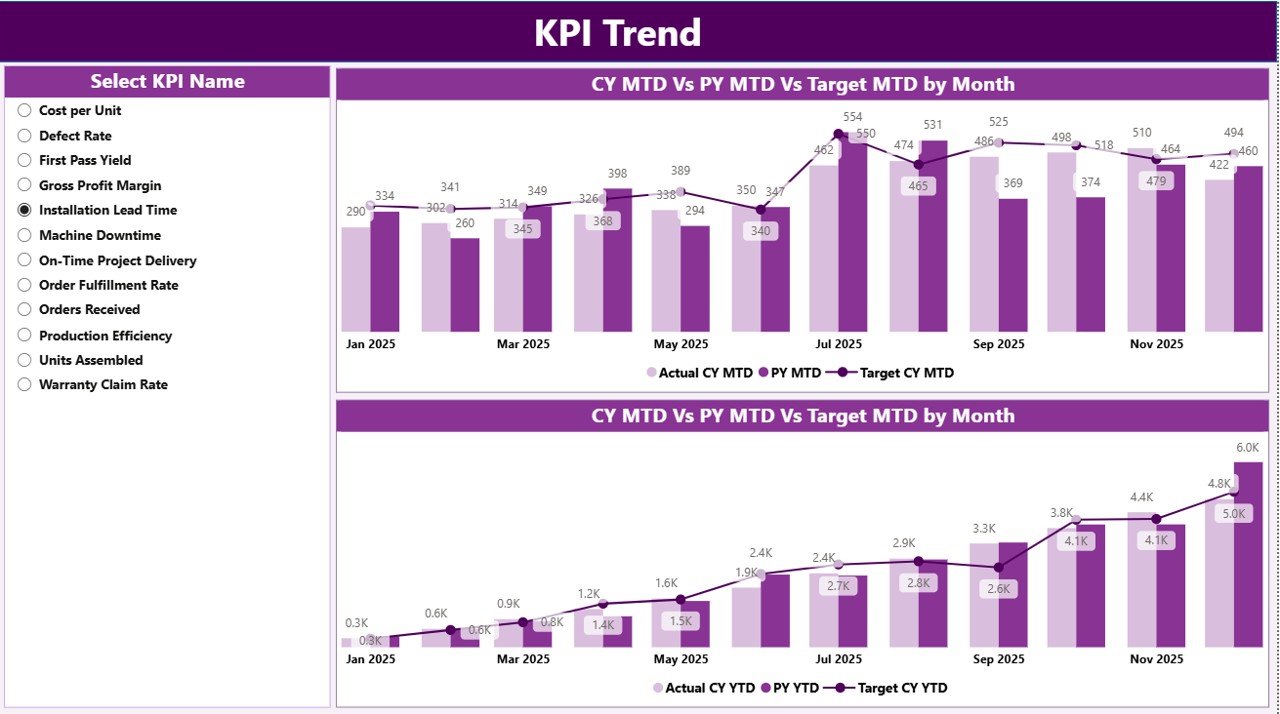
🔎 KPI Trend Visualization
Analyze trends using combo charts for strategic forecasting.
🗂 Drill-Through KPI Definition Page
View formula, definition, KPI type (LTB/UTB), and group instantly.
📅 Dynamic Slicers
Filter by month and KPI group with just one click.
📁 Excel-Based Data Source
Easily maintain data without advanced Power BI skills.
📦 What’s Inside the Industrial Automation Equipment KPI Dashboard in Power BI
This Power BI solution includes 3 structured dashboard pages:
1️⃣ Summary Page
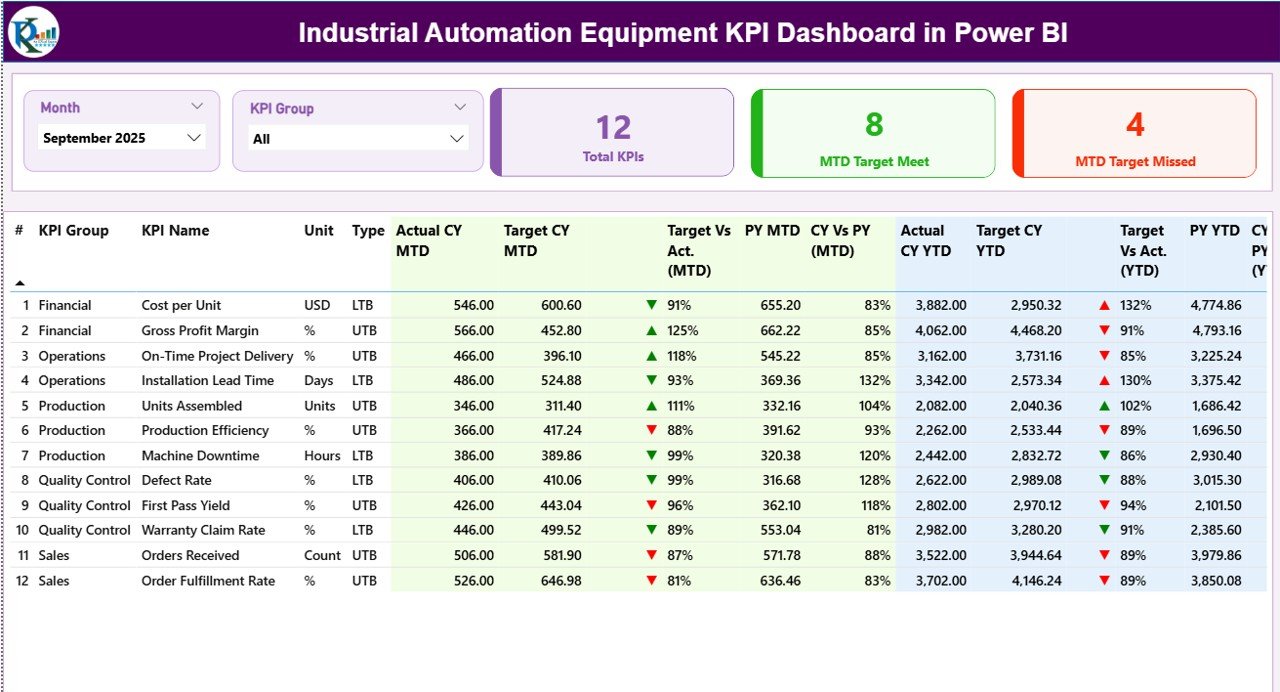
Your main control center with:
-
Month & KPI Group slicers
-
KPI cards (Total KPIs, Target Met, Target Missed)
-
Detailed KPI performance table
-
MTD & YTD sections
-
CY vs PY comparison percentages
2️⃣ KPI Trend Page
-
Two combo charts (MTD & YTD)
-
Actual CY, Target, and Previous Year values
-
KPI Name slicer for focused trend analysis
3️⃣ KPI Definition Page
-
KPI formula
-
KPI description
-
KPI type (LTB / UTB)
-
KPI group
-
Back navigation button
The dashboard connects to an Excel data file containing:
-
Input_Actual sheet
-
Input_Target sheet
-
KPI Definition sheet
This clean structure keeps your system scalable and organized.
🛠 How to Use the Industrial Automation Equipment KPI Dashboard in Power BI
Using this dashboard is simple:
1️⃣ Enter actual MTD and YTD numbers in the Input_Actual Excel sheet.
2️⃣ Enter target MTD and YTD values in the Input_Target sheet.
3️⃣ Maintain KPI details in the KPI Definition sheet.
4️⃣ Refresh the Power BI file.
5️⃣ Analyze performance instantly.
You do not need advanced Power BI skills. Just update Excel — the dashboard does the rest.
👥 Who Can Benefit from This Industrial Automation Equipment KPI Dashboard in Power BI
This dashboard is perfect for:
🏭 Manufacturing companies
⚙ Automation system integrators
📊 Plant managers
🛠 Maintenance teams
📈 Operations managers
📉 Industrial engineers
📋 Business analysts
Whether you manage a large production facility or a growing factory, this dashboard helps you gain clarity and control.
Why This Dashboard Is a Game-Changer
When you track KPIs like:
-
Overall Equipment Effectiveness (OEE)
-
Machine Downtime
-
Production Output
-
Rejection Rate
-
Cycle Time
-
Maintenance Cost
-
Energy Consumption
-
Equipment Utilization
-
MTBF & MTTR
You gain operational transparency.
Instead of reacting to problems, you prevent them.
Instead of manual calculations, you get automatic insights.
Instead of confusion, you get clarity.
This dashboard empowers leaders to make faster, smarter, data-driven decisions.
Click here to read the Detailed blog post
Visit our YouTube channel to learn step-by-step video tutorials
YouTube Channel


