Running a successful hearing aid clinic is not just about providing devices—it’s about delivering exceptional patient care while tracking performance with precision. What if you could monitor every key metric, improve service quality, and boost revenue—all from one powerful dashboard? 🚀
Introducing the Hearing Aid Services KPI Dashboard in Power BI — a smart, interactive, and ready-to-use analytics solution designed specifically for audiology clinics and hearing aid service providers. This dashboard transforms complex data into clear, actionable insights so you can make faster and smarter decisions.
Instead of relying on scattered spreadsheets or manual reports, this dashboard centralizes all your data into one intuitive platform. From patient consultations to device sales and follow-ups, everything is tracked seamlessly.
💡 Key Features of Hearing Aid Services KPI Dashboard in Power BI
📊 Interactive KPI Dashboard – View all key performance indicators in one centralized screen.
📅 Dynamic Month & KPI Filters – Analyze data instantly using slicers for better insights.
🎯 Target vs Actual Tracking – Identify performance gaps quickly with visual indicators.
📈 MTD & YTD Analysis – Track both short-term and long-term performance efficiently.
🔺 Performance Indicators – Green and red arrows highlight success or improvement areas.
📉 Previous Year Comparison – Measure growth and trends over time.
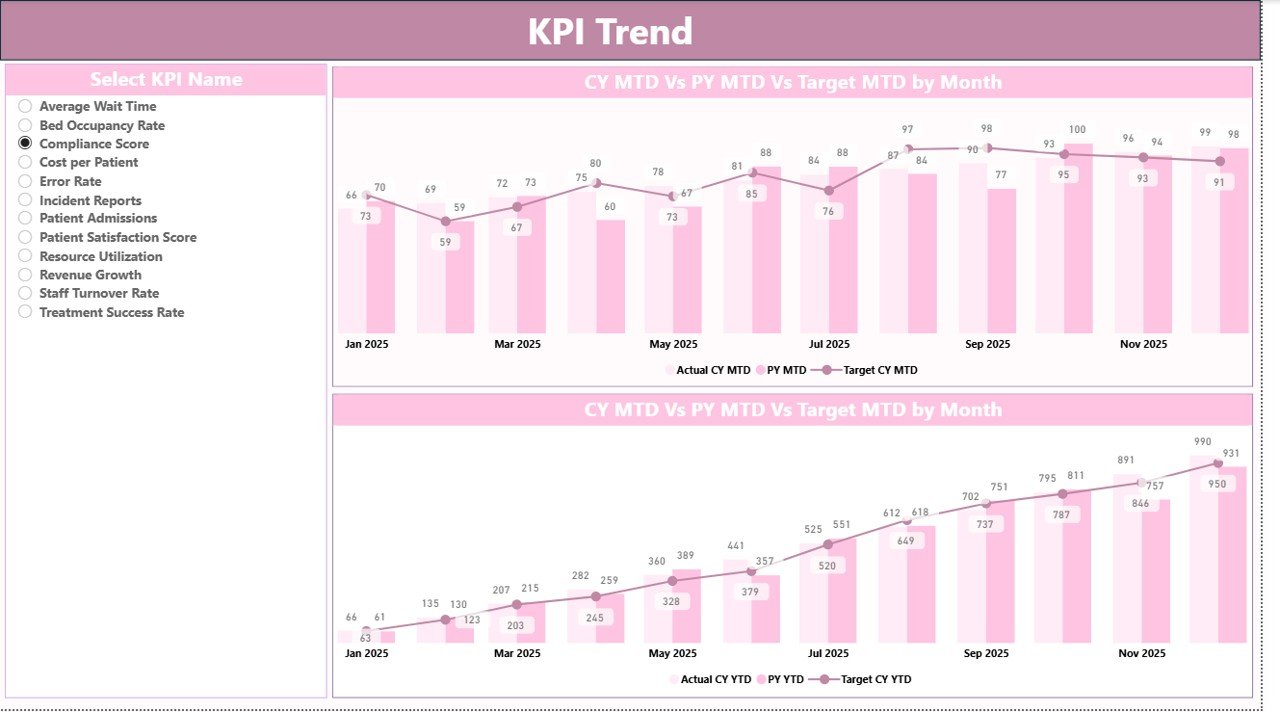
📊 KPI Trend Analysis Page – Visualize performance patterns using dynamic combo charts.
🧾 Drill-Through KPI Details – Access complete KPI definitions with one click.
⚡ Real-Time Updates – Refresh data instantly from Excel to Power BI.
📦 What’s Inside the Hearing Aid Services KPI Dashboard in Power BI
This powerful dashboard is designed with 3 interactive pages for complete analysis:
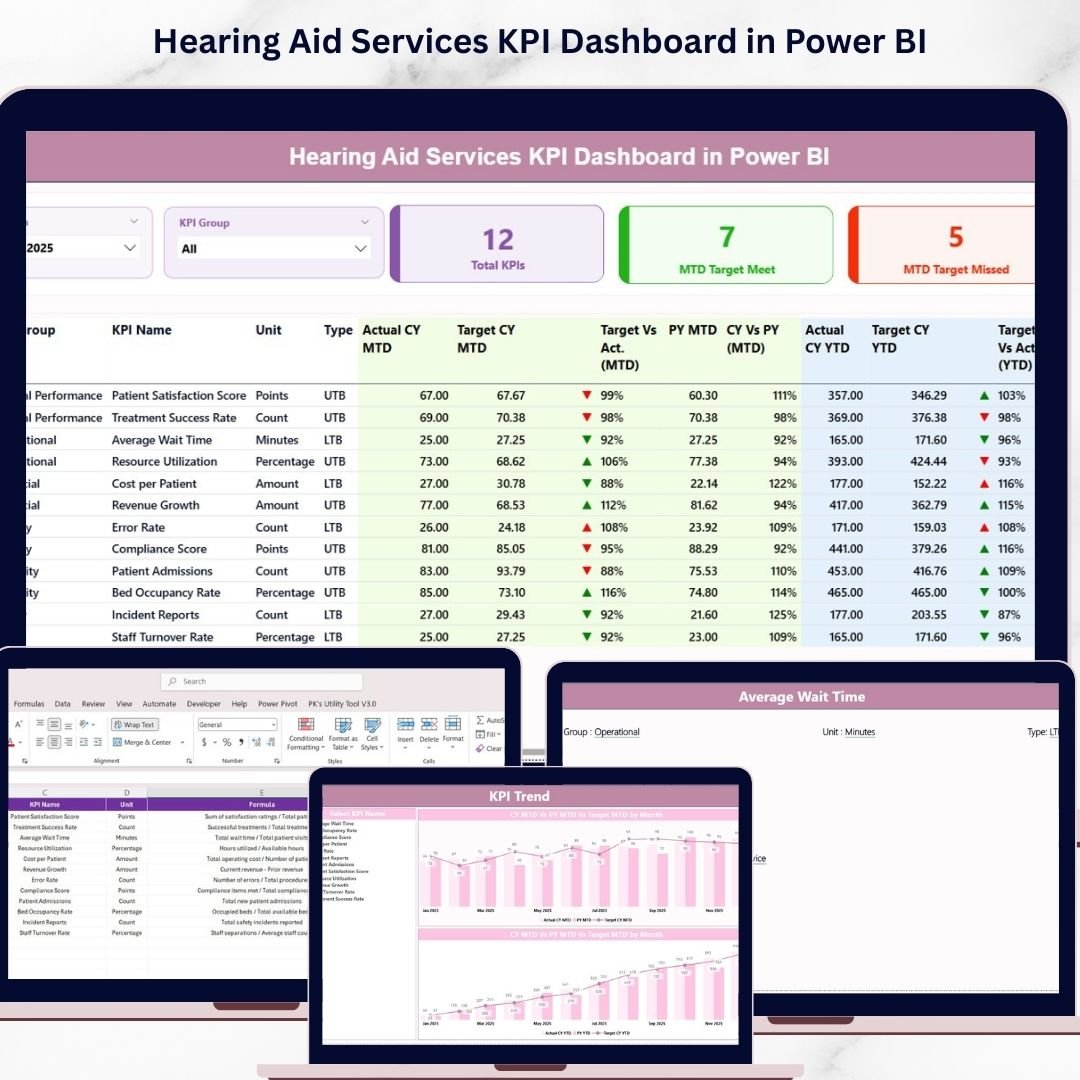
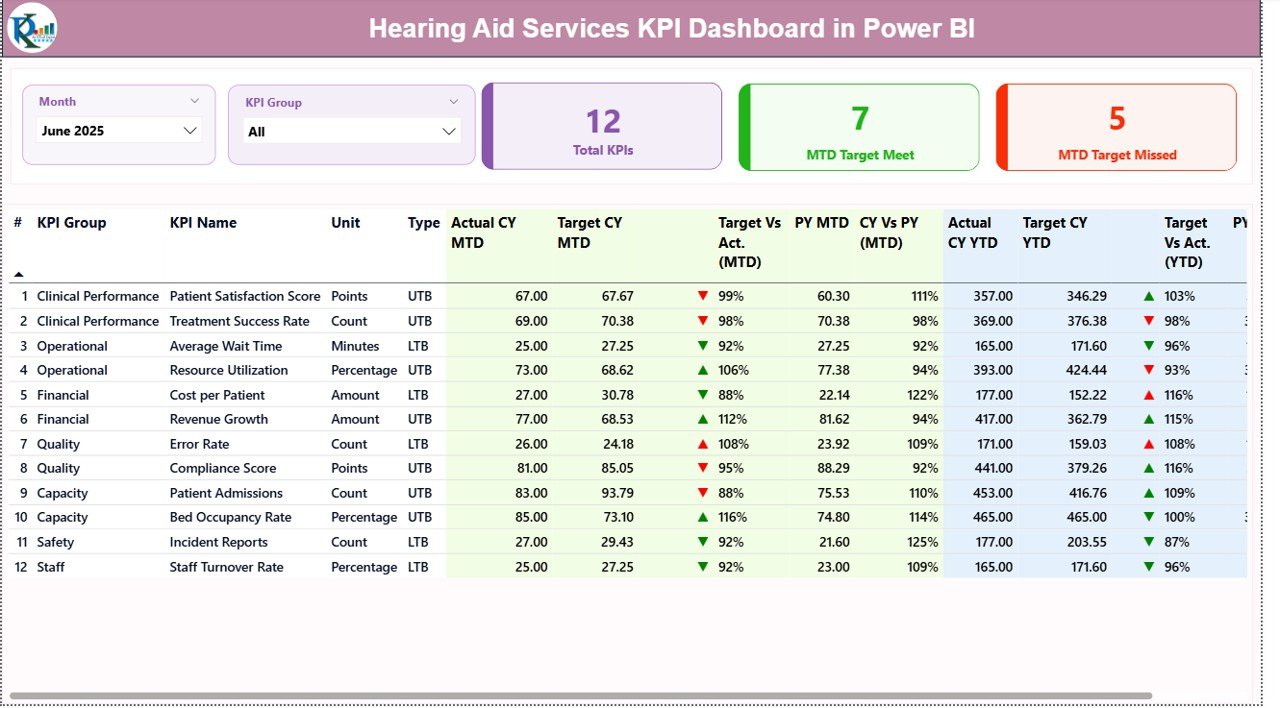
📌 Summary Page
The main dashboard showing KPI cards, performance indicators, and a detailed KPI table with MTD and YTD comparisons.
📌 KPI Trend Page
Analyze trends using interactive combo charts comparing current year, previous year, and targets.
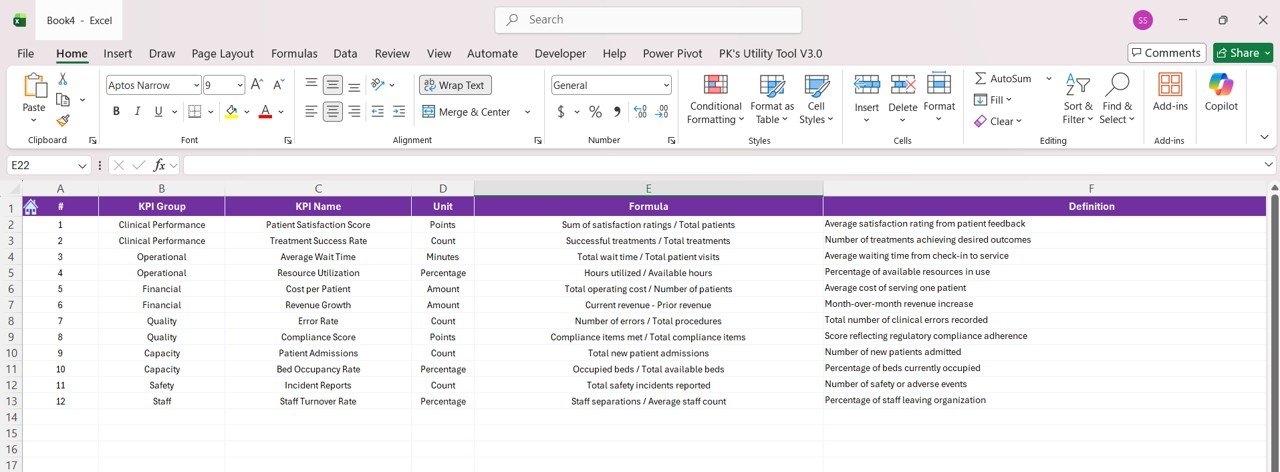
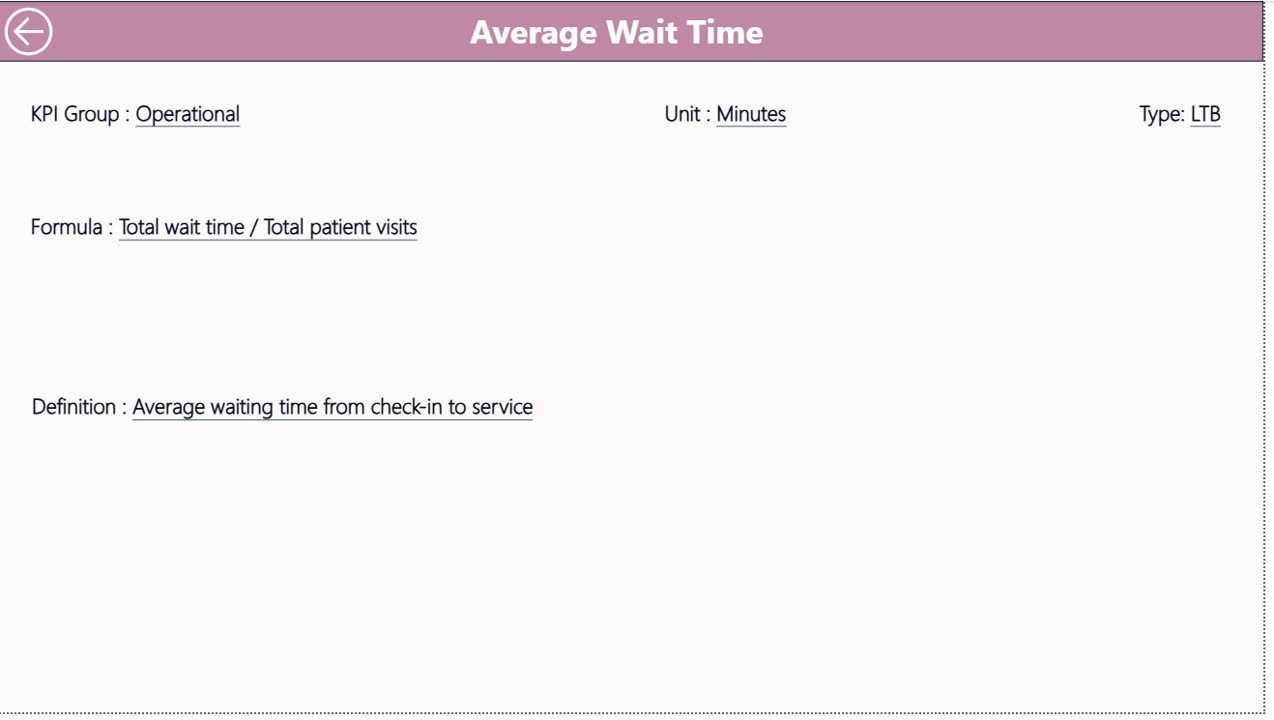
📌 KPI Definition Page
A drill-through page providing detailed KPI information such as formula, unit, and definition.
Additionally, the dashboard is powered by structured Excel data sources:
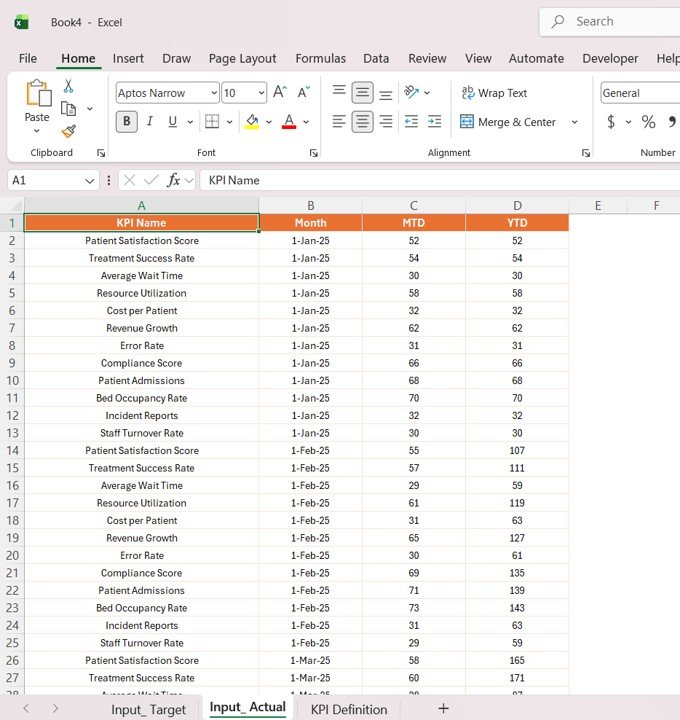
📂 Input_Actual Sheet – Stores actual MTD and YTD values
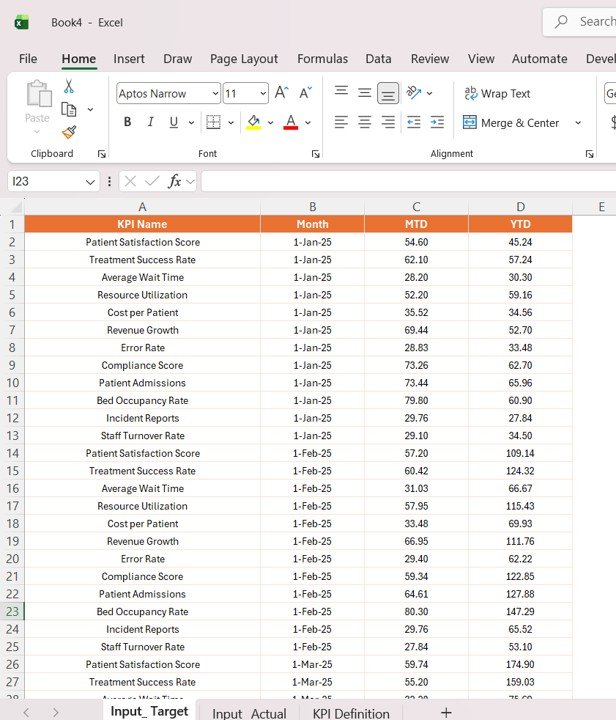
📂 Input_Target Sheet – Contains KPI targets
📂 KPI Definition Sheet – Defines all KPIs
Together, these components provide a complete data analytics system for your clinic.
⚙️ How to Use the Hearing Aid Services KPI Dashboard in Power BI
Using this dashboard is simple and efficient—even for beginners.
👉 Step 1: Define KPIs
Enter KPI details such as name, formula, and type in the KPI Definition sheet.
👉 Step 2: Set Targets
Input monthly and yearly targets in the Target sheet.
👉 Step 3: Add Actual Data
Update the Actual sheet with real performance data.
👉 Step 4: Refresh Power BI Dashboard
Load the updated data into Power BI for instant visualization.
👉 Step 5: Analyze Insights
Use slicers and charts to monitor trends and performance.
Within minutes, you’ll have a fully functional analytics system ready to support smarter decisions.
👥 Who Can Benefit from This Hearing Aid Services KPI Dashboard in Power BI
🏥 Hearing Aid Clinics – Monitor patient services and device performance.
👨⚕️ Audiology Centers – Track consultations, tests, and follow-ups efficiently.
📊 Healthcare Managers – Make faster, data-driven decisions.
💼 Medical Device Companies – Analyze sales and service performance.
🏢 Hospital Administrators – Improve operational efficiency and patient satisfaction.
📈 Business Owners – Increase profitability with better insights.
If you want to streamline operations, improve patient care, and boost revenue—this dashboard is your ultimate solution.
This dashboard is not just a reporting tool—it’s a complete performance management system. It helps you uncover hidden insights, identify gaps, and take immediate action.
💥 Stop guessing your clinic performance.
💥 Start managing it with precision and confidence.


