

In today’s high-pressure global logistics environment, freight forwarding companies cannot afford delayed decisions, unclear performance, or manual reporting errors. Freight Forwarding KPI Dashboard in Power BI Every shipment, delivery timeline, and service commitment directly impacts customer satisfaction and profitability. However, many logistics teams still struggle with scattered Excel files, static reports, and delayed insights.
Freight Forwarding KPI Dashboard in Power BI That is exactly where the Freight Forwarding KPI Dashboard in Power BI becomes a powerful game-changer.
This professionally designed dashboard converts raw logistics data into clear, interactive, and real-time insights. Instead of reacting to problems after they occur, this solution helps you monitor performance continuously, identify risks early, and take confident, data-driven actions—all from one centralized Power BI dashboard.
🚀 Key Features of Freight Forwarding KPI Dashboard in Power BI
📊 Interactive Power BI Visuals – Replace static reports with dynamic charts, tables, and cards
📅 Month & KPI Group Slicers – Instantly filter performance by period and KPI category
🎯 MTD & YTD Performance Tracking – Analyze short-term efficiency and long-term growth together
📈 Target vs Actual Analysis – Quickly identify gaps between goals and results
🔁 Current Year vs Previous Year Comparison – Track real operational improvement and growth
⬆️⬇️ Visual Status Indicators – Instantly spot overperformance or underperformance
📘 Drill-Through KPI Definitions – Understand each KPI with formulas and explanations
📂 Excel-Based Data Input – Easy updates without complex system integrations
📦 What’s Inside the Freight Forwarding KPI Dashboard
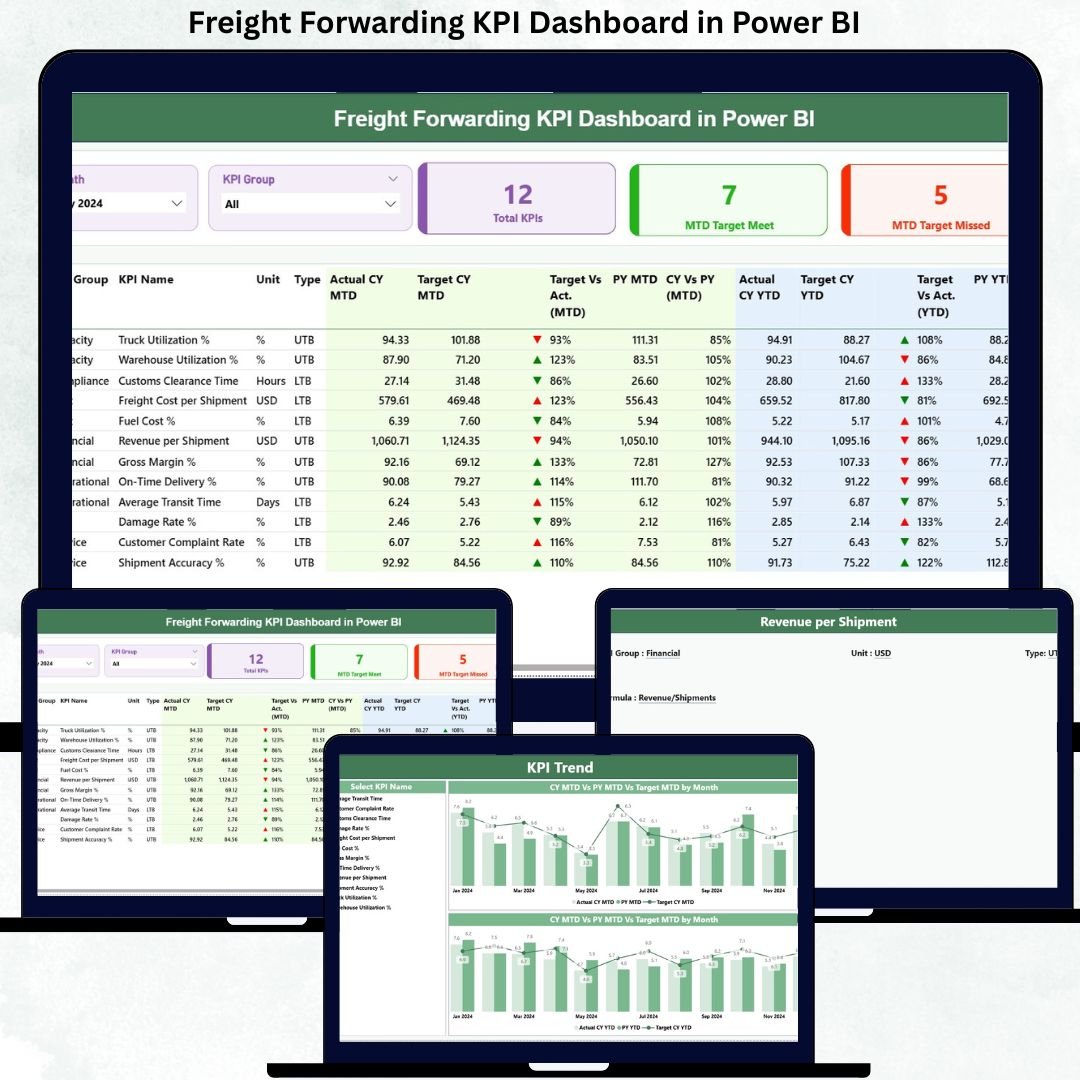
This Power BI product includes a well-structured, three-page dashboard designed specifically for freight forwarding and logistics operations.
🔹 Summary Page

Acts as the main monitoring hub. It displays:
-
Total KPIs Count
-
MTD Target Met Count
-
MTD Target Missed Count
-
A detailed KPI table with MTD & YTD Actuals, Targets, Previous Year values, and percentage comparisons
🔹 KPI Trend Page
Designed for trend analysis using:
-
MTD Trend Combo Chart
-
YTD Trend Combo Chart
-
Current Year vs Previous Year vs Target comparison
🔹 KPI Definition Page (Drill-Through)
Provides:
-
KPI Formula
-
KPI Definition
-
Unit, Group, and KPI Type (LTB / UTB)
-
Easy navigation back to the Summary Page
This structure ensures clarity, transparency, and complete KPI understanding.
🛠️ How to Use the Freight Forwarding KPI Dashboard
Using this dashboard is simple and business friendly.
1️⃣ Enter Actual KPI values in the Input Actual Excel sheet
2️⃣ Update Target values in the Input Target Excel sheet
3️⃣ Maintain KPI details in the KPI Definition sheet
4️⃣ Refresh the Power BI file to update all visuals
5️⃣ Use slicers, tables, and charts to analyze performance instantly
Because Excel is the data source, updates remain fast, controlled, and scalable.
👥 Who Can Benefit from This Freight Forwarding KPI Dashboard?
This dashboard is ideal for:
🚚 Freight Forwarding Companies
📦 Logistics & Supply Chain Managers
📊 Operations & MIS Teams
💼 Business & Strategy Leaders
📈 Performance Analysts
🌍 Multi-branch Logistics Organizations
If your business needs better visibility, faster decisions, and operational control, this dashboard is built for you.
🔎 Click here to read the Detailed blog post
👉 Visit our YouTube channel to learn step-by-step video tutorials


Reviews
There are no reviews yet.