Managing floriculture operations without real-time visibility is risky. With changing demand, high perishability, seasonal variations, and tight margins, floriculture businesses cannot afford delayed or inaccurate decisions. Yet many growers, exporters, and wholesalers still rely on scattered Excel files and manual reports that slow them down.
That is exactly why the Floriculture KPI Dashboard in Power BI becomes a game-changing solution 🌟.
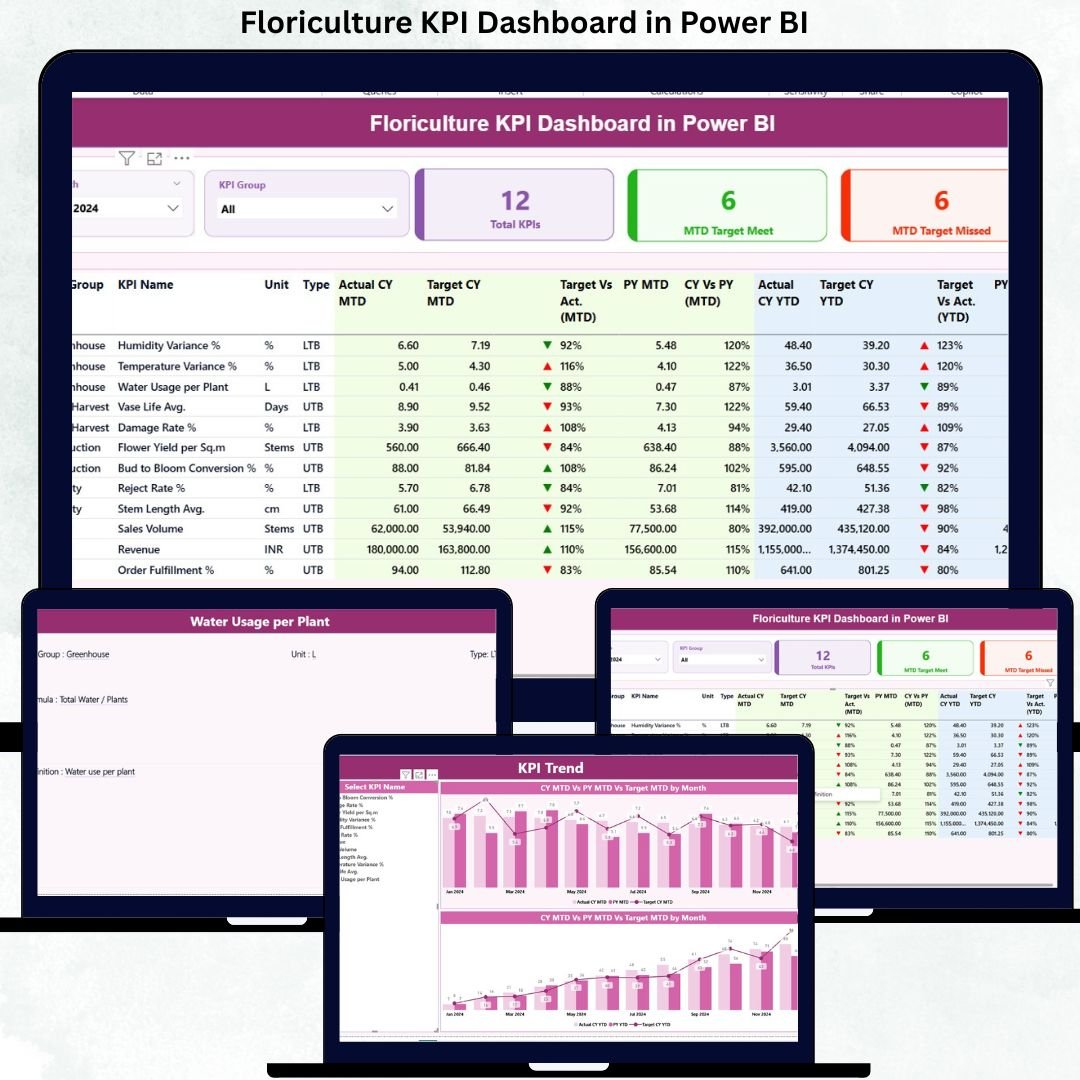
This professionally designed, ready-to-use Power BI dashboard converts raw floriculture data into clear, visual, and actionable insights. Instead of spending hours preparing reports, you can instantly track performance, compare targets, and identify problem areas—all from one interactive dashboard.
Built with Excel as the data source and Power BI for visualization, this product combines simplicity with powerful analytics. Whether you manage cultivation, quality, sales, or logistics, this dashboard helps you stay in control and make confident, data-driven decisions.
🚀 Key Features of the Floriculture KPI Dashboard in Power BI
🌼 Centralized KPI Monitoring – Track all critical floriculture KPIs in one clean and interactive Power BI report
📅 Dynamic Month Selection – Instantly analyze performance for any selected month
🎯 Target vs Actual Analysis – Clearly identify KPIs meeting or missing targets
📊 MTD & YTD Performance Tracking – Monitor short-term and cumulative results with ease
📉📈 Previous Year Comparison – Evaluate growth and performance trends year over year
🟢🔴 Visual Performance Indicators – Up/down arrows highlight success and gaps instantly
🧩 Well-Structured KPI Groups – Production, Quality, Sales, Logistics, and more
🔗 Excel-Based Data Source – Simple data updates without technical complexity
📦 What’s Inside the Floriculture KPI Dashboard in Power BI
This digital product includes a fully structured Power BI file connected to an Excel data model.
📄 3 Powerful Power BI Pages
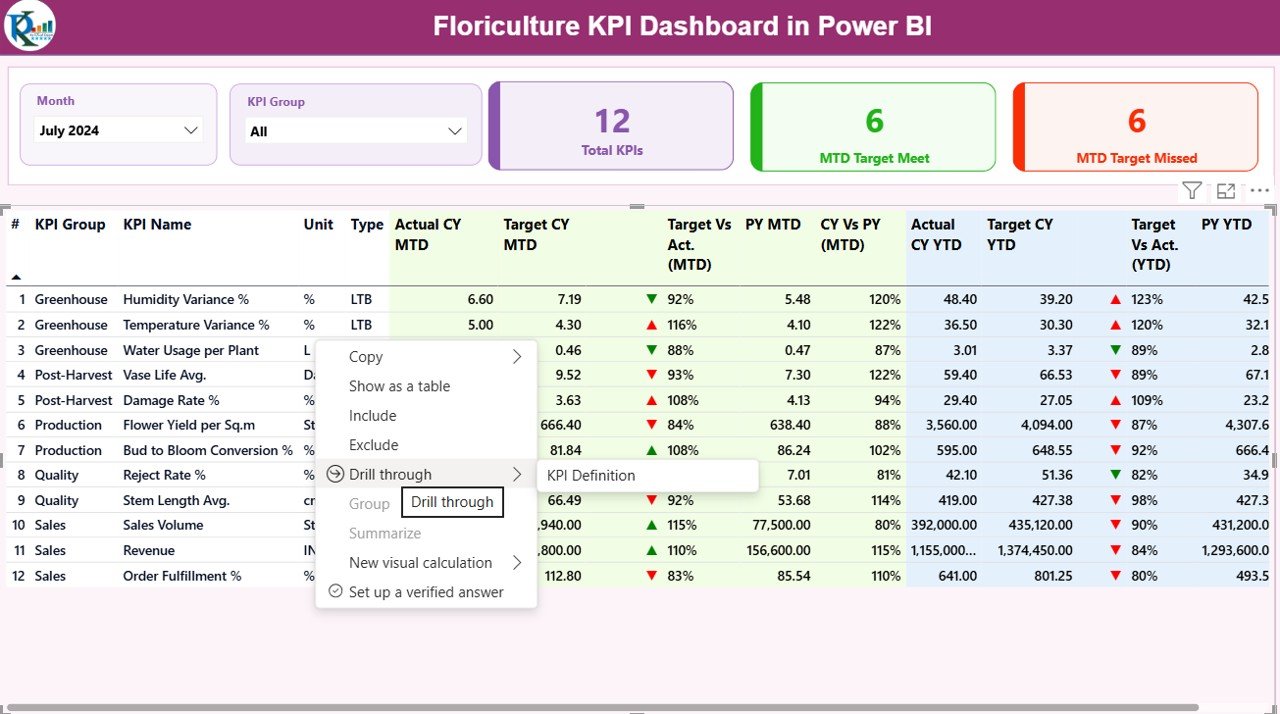
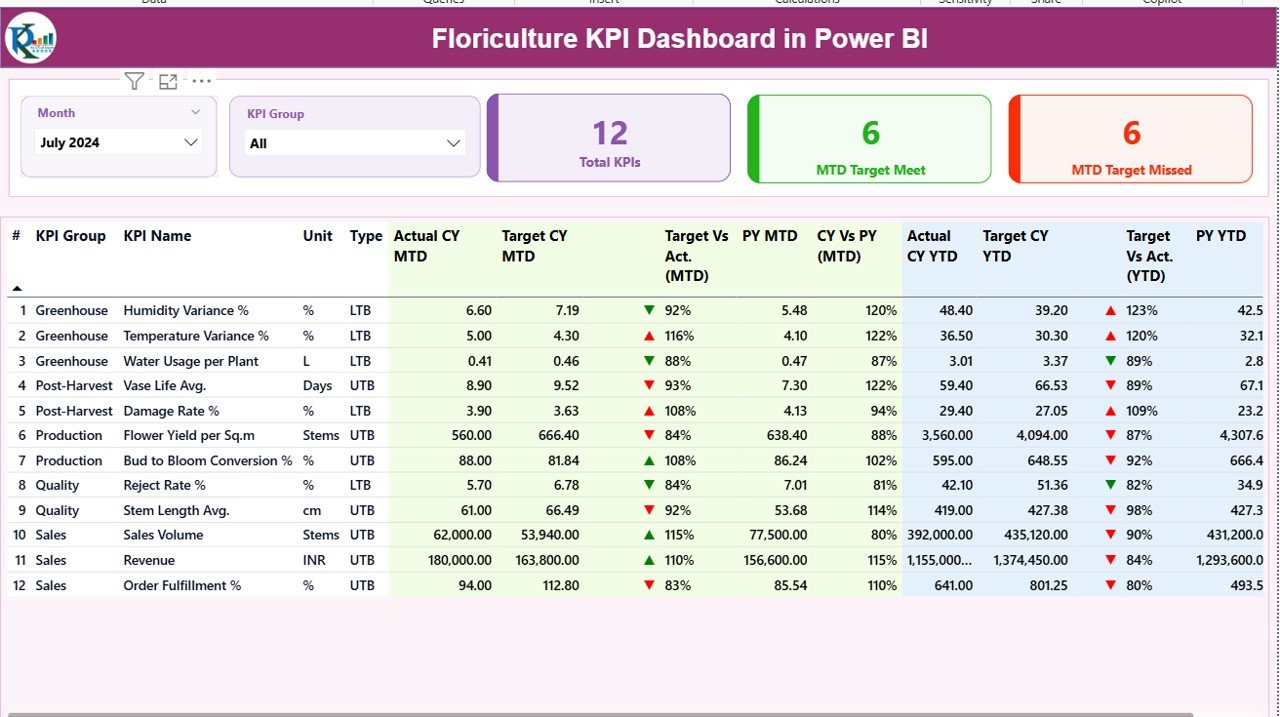
✅ Summary Page
A high-level performance overview with slicers, KPI cards, and a detailed KPI table showing MTD and YTD results, targets, and previous-year comparisons.
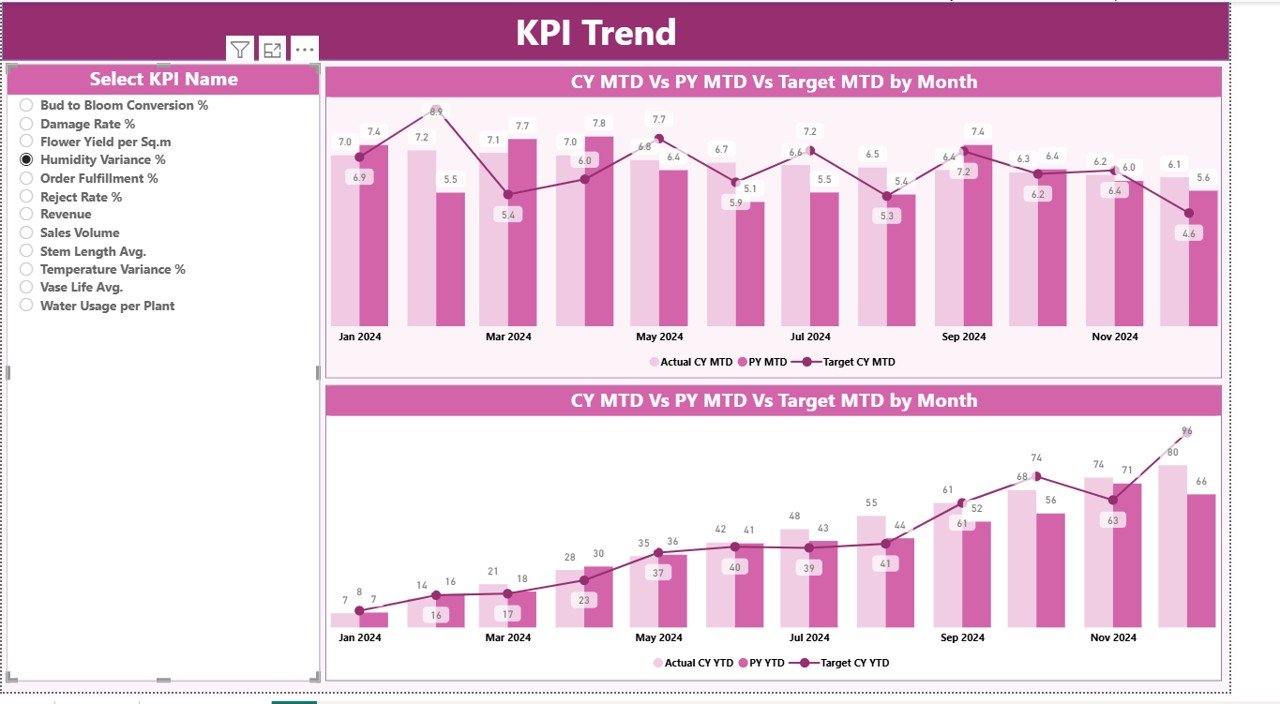
📈 KPI Trend Page
Interactive MTD and YTD trend charts comparing current year, previous year, and targets for selected KPIs.
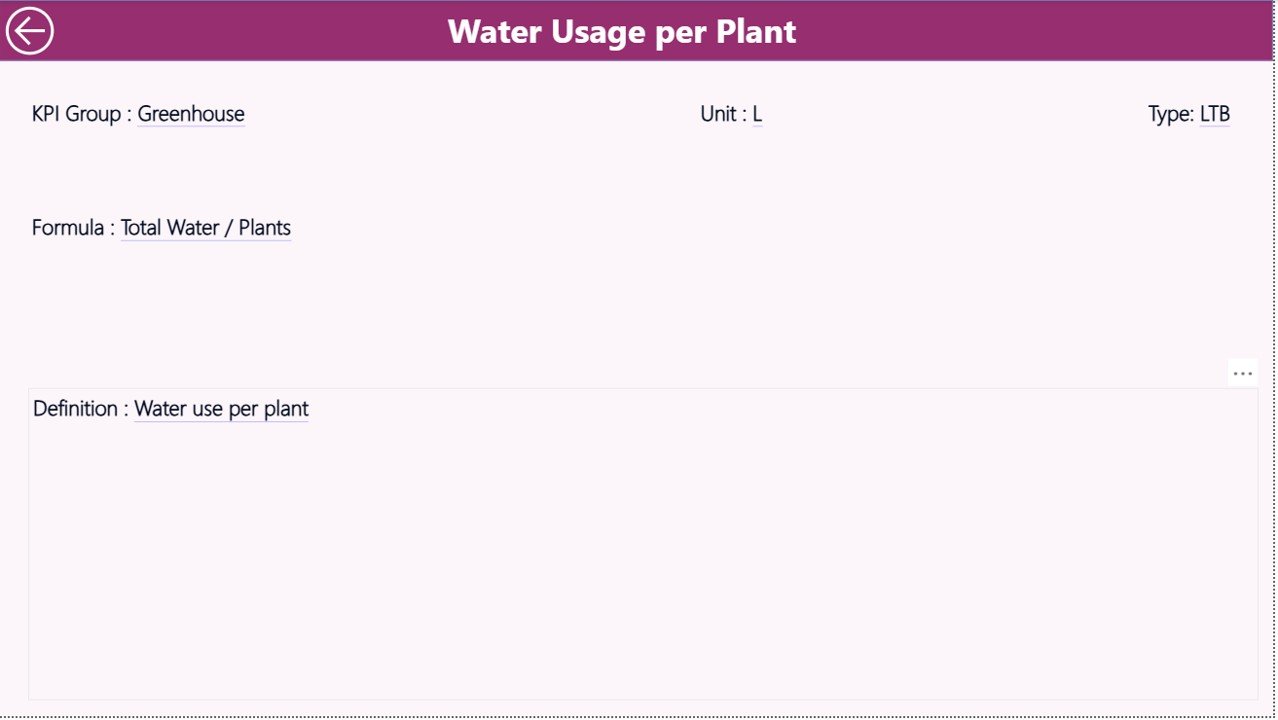
📘 KPI Definition Page
A reference page displaying KPI number, group, unit, formula, definition, and KPI type (LTB or UTB) to ensure clarity and consistency.
📊 Excel Data Source with Structured Sheets
-
Input_Actual – Actual MTD and YTD values
-
Input_Target – Target MTD and YTD values
-
KPI Definition – KPI logic, unit, formula, and type
🛠️ How to Use the Floriculture KPI Dashboard in Power BI
Using this dashboard is simple—even for non-technical users:
1️⃣ Enter or update actual and target values in the Excel sheets
2️⃣ Open the Power BI file and refresh the data
3️⃣ Select the month and KPI group using slicers
4️⃣ Instantly view KPI status, trends, and comparisons
5️⃣ Take corrective action based on visual insights
No advanced Power BI knowledge is required—Power BI handles all calculations automatically.
👥 Who Can Benefit from This Floriculture KPI Dashboard
🌸 Flower growers and farm managers
🚚 Floriculture exporters and wholesalers
🏭 Operations and supply chain teams
💰 Finance and planning professionals
📊 Business owners and decision-makers
If you are responsible for yield, quality, cost, sales, or profitability, this dashboard is built for you.
Click here to read the Detailed Blog Post
Watch the step-by-step video tutorial:
Visit our YouTube channel to learn step-by-step video tutorials and dashboard walkthroughs.


Reviews
There are no reviews yet.