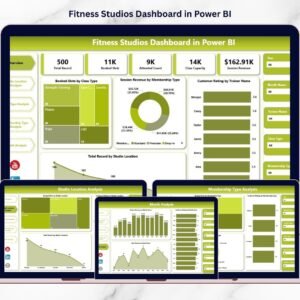
Running a fitness studio involves far more than workouts and memberships. Behind every successful studio lies data — bookings, trainers, memberships, customer ratings, schedules, and revenue performance. However, many studio owners still rely on disconnected spreadsheets, making it difficult to track performance clearly.
The Fitness Studios Dashboard in Power BI solves this challenge by transforming operational data into interactive visual insights.
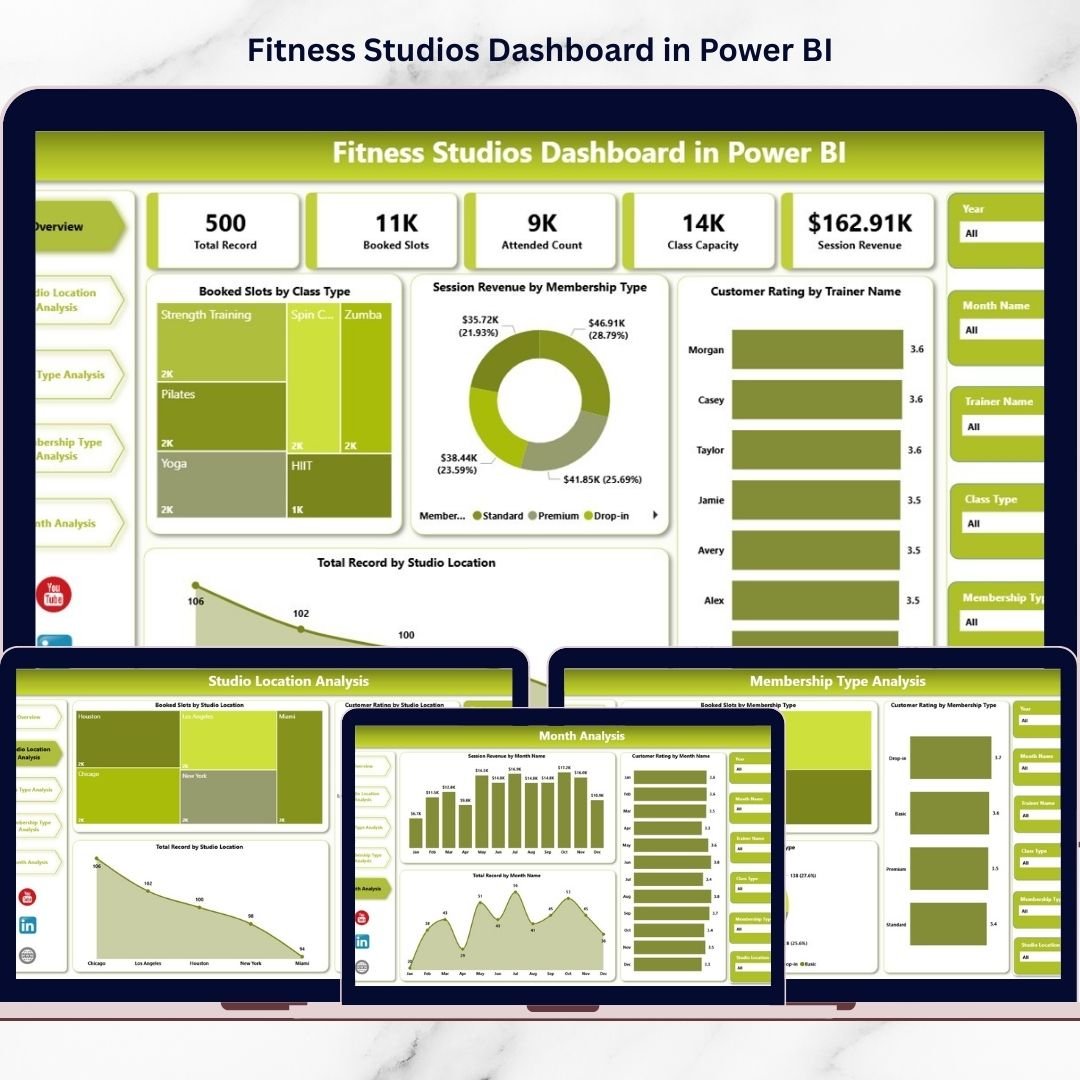
This ready-to-use dashboard provides a centralized analytics platform where studio owners and managers can monitor performance, compare locations, analyze class popularity, evaluate trainers, and track monthly trends — all in one place. Instead of guessing, you make confident decisions backed by real data.
🔑 Key Feature of Fitness Studios Dashboard in Power BI
📊 Interactive Performance Dashboard
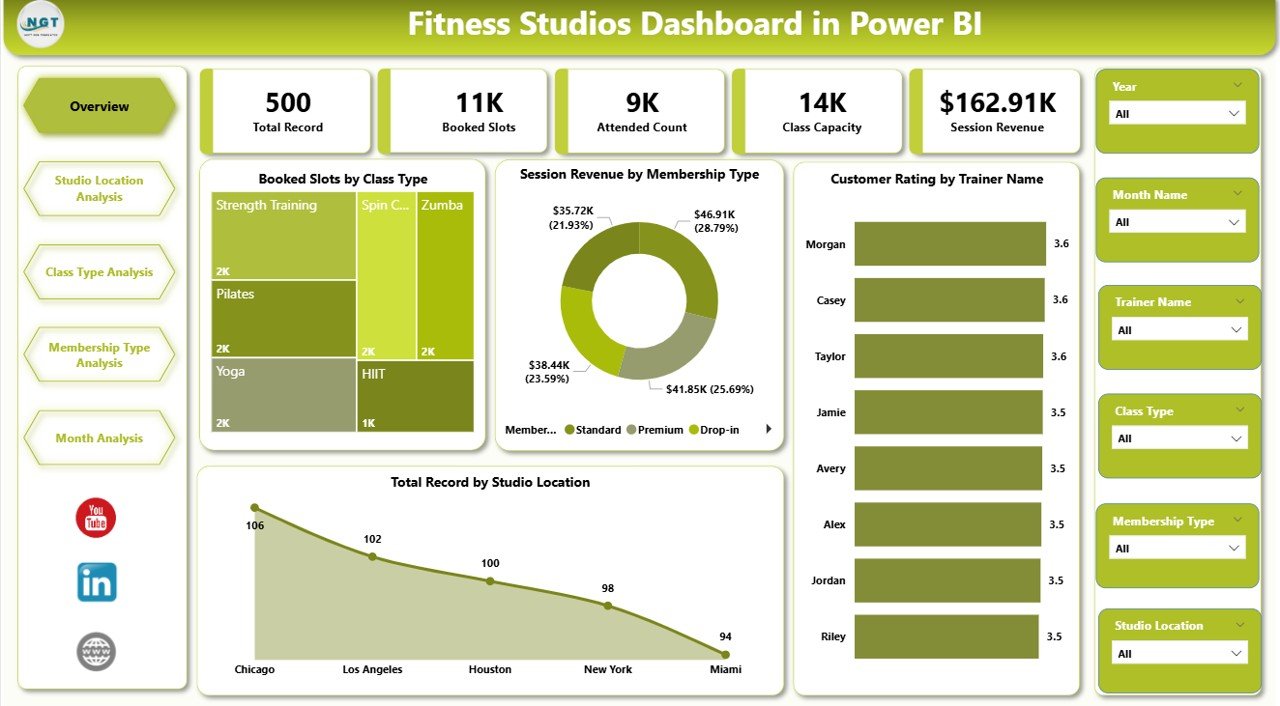
Monitor bookings, revenue, and customer satisfaction from one centralized view.
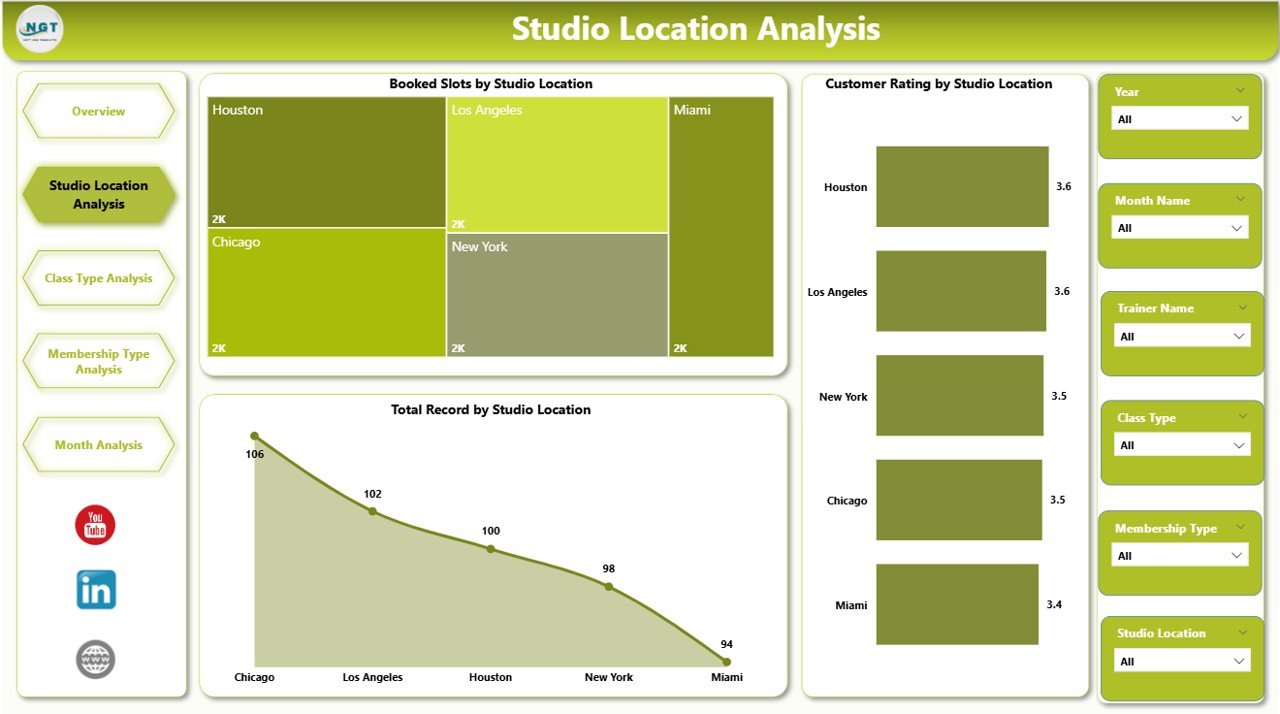
🏢 Multi-Location Studio Analysis
Compare performance across branches instantly.
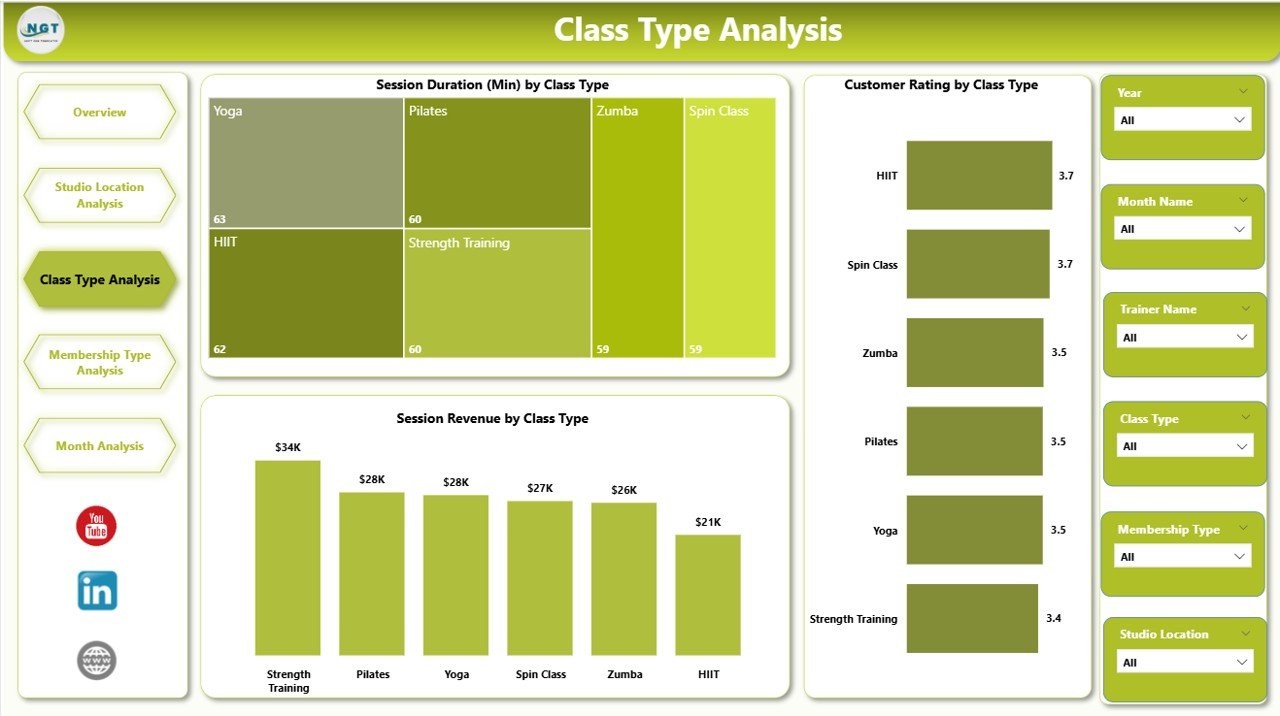
🏋️ Class Performance Insights
Identify high-demand classes and optimize schedules.
⭐ Trainer Rating Analysis
Track customer satisfaction and improve trainer performance.
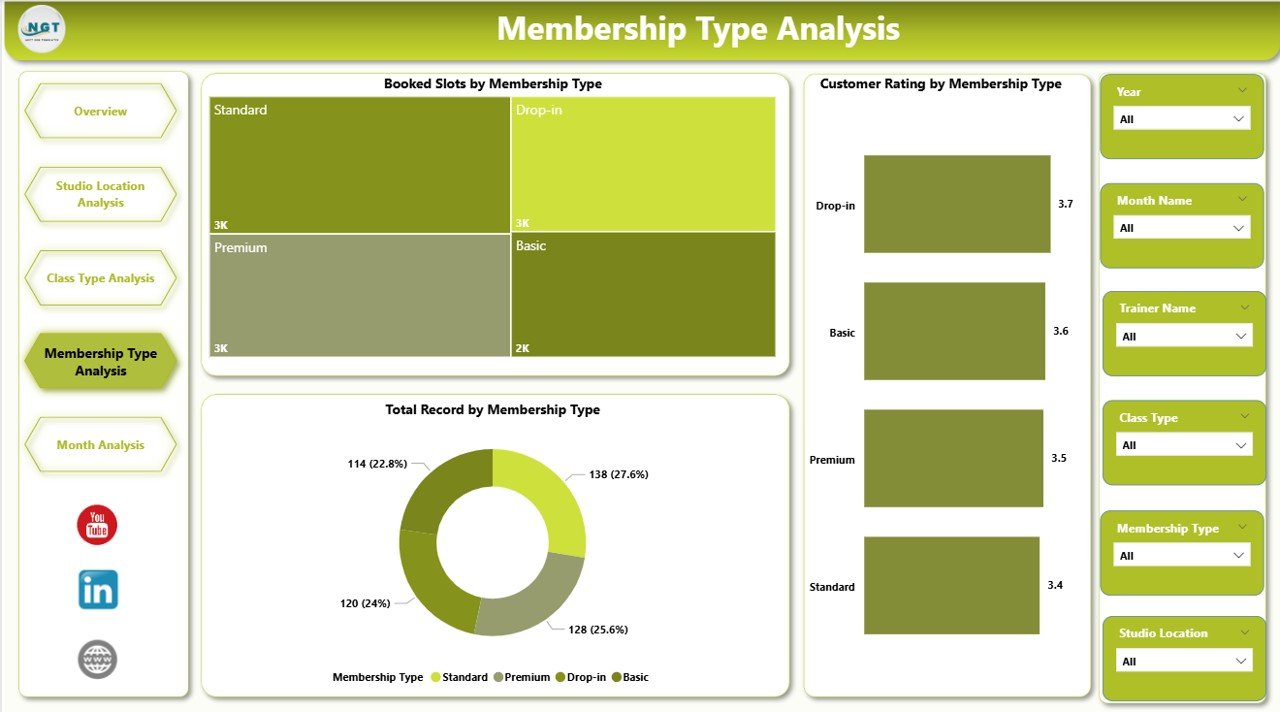
💳 Membership Performance Tracking
Understand which membership plans drive revenue and engagement.
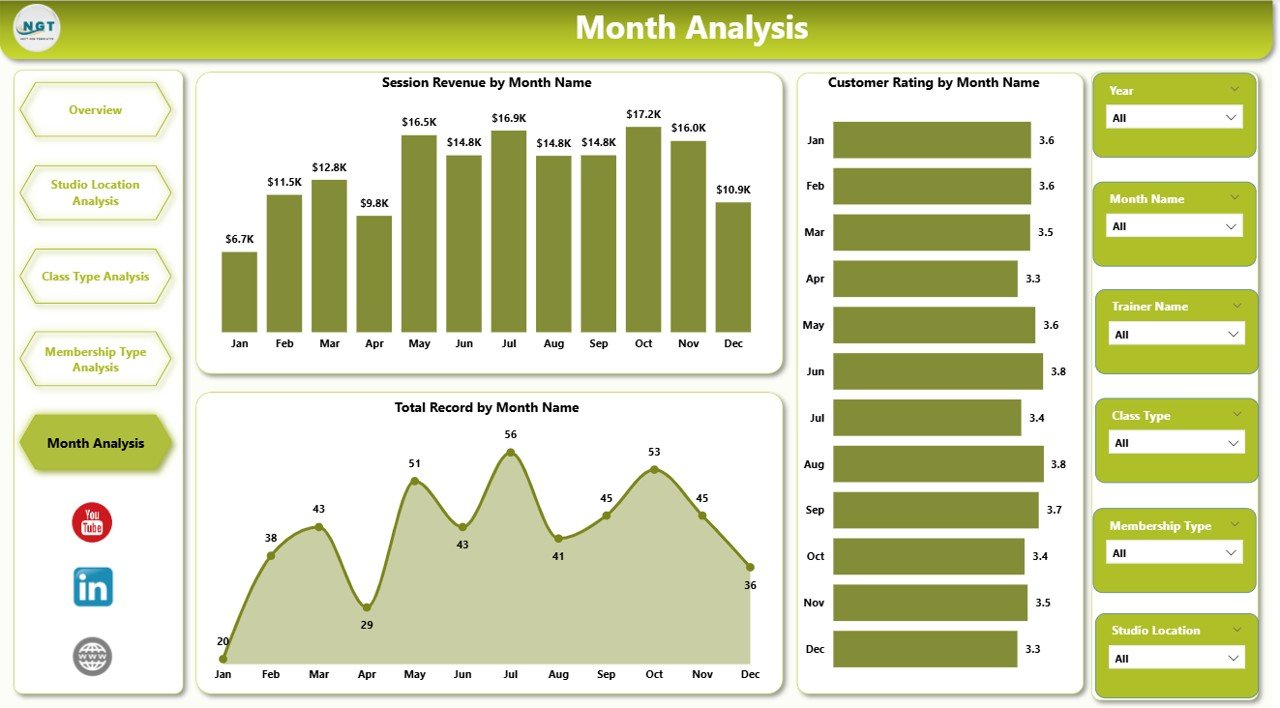
📅 Monthly Trend Monitoring
Analyze seasonal patterns and forecast demand accurately.
🎯 Dynamic Slicers & Filters
Drill down into data instantly using interactive filters.
⚡ Automated Visual Updates
Refresh data once and update the entire dashboard automatically.
📈 Data-Driven Decision Making
Improve profitability, retention, and operational efficiency.
📦 What’s Inside the Fitness Studios Dashboard in Power BI
This Power BI solution includes 5 interactive analytical pages:
✔️ Overview Page – Complete studio performance snapshot
✔️ Studio Location Analysis – Branch comparison insights
✔️ Class Type Analysis – Class popularity and revenue analysis
✔️ Membership Type Analysis – Membership engagement tracking
✔️ Month Analysis – Time-based performance trends
Each page includes slicers for fast filtering and deeper analysis.
🛠️ How to Use the Fitness Studios Dashboard in Power BI
Follow these simple steps:
Step 1: Import your studio dataset into Power BI
Step 2: Ensure data includes location, class type, trainer, revenue, and ratings
Step 3: Refresh data connections
Step 4: Use slicers to filter insights dynamically
Step 5: Analyze KPI cards and charts
Step 6: Take action based on performance insights
Within minutes, you gain full visibility into your fitness operations.
🎯 Who Can Benefit from This Fitness Studios Dashboard
This dashboard is ideal for:
✅ Fitness Studio Owners
✅ Gym & Wellness Centers
✅ Multi-Branch Fitness Chains
✅ Franchise Managers
✅ Operations Managers
✅ Fitness Business Consultants
✅ Data Analysts in Fitness Industry
Both single-location studios and large fitness networks can use it effectively.
Why This Dashboard Improves Fitness Studio Performance
With centralized analytics, studios can:
✔️ Identify top-performing classes
✔️ Improve customer satisfaction using rating insights
✔️ Optimize trainer allocation
✔️ Increase membership retention
✔️ Plan promotions using monthly trends
✔️ Monitor revenue drivers clearly
As a result, studios operate smarter and grow faster.
### Click hare to read the Detailed blog post
📺 Visit our YouTube channel to learn step-by-step video tutorials
👉 Youtube.com/@PKAnExcelExpert