


Precision is not optional in manufacturing. In firearms manufacturing, it is mandatory. 🔍
Production must meet strict quality standards. Compliance must remain tight. Safety must never slip. Costs must stay under control. If performance tracking is weak, risks multiply.
Are you still relying on disconnected spreadsheets and manual reports?
It’s time to upgrade to a structured, professional system.
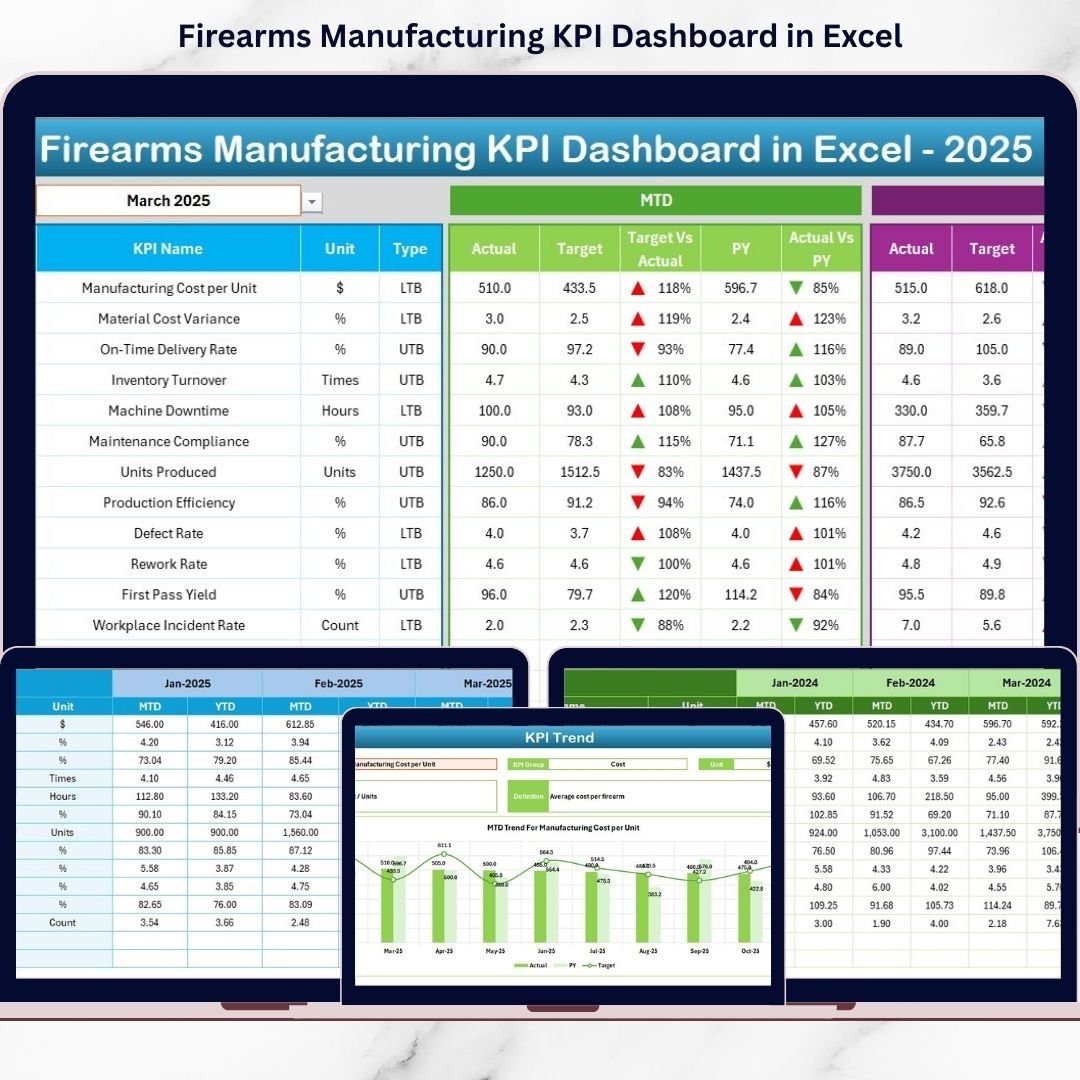
The Firearms Manufacturing KPI Dashboard in Excel is a ready-to-use performance monitoring solution built specifically for firearms production facilities. It centralizes production, quality, safety, financial, and inventory KPIs into one dynamic dashboard.
With interactive month selection, automatic calculations, and visual indicators, this dashboard transforms raw factory data into powerful insights — instantly.
No complex software. No heavy IT setup. Just Excel, structured smartly.
Key Features of Firearms Manufacturing KPI Dashboard in Excel 📊
🚀 7 Fully Structured Worksheets for complete KPI management
📅 Dynamic Month Selection (Cell D3) – Instantly update dashboard by selecting month
📈 MTD & YTD Tracking – Monitor both short-term and long-term performance
📊 Target vs Actual Comparison – Automatic performance ratio calculation
🔄 Year-over-Year (CY vs PY) Analysis
🔺 Conditional Formatting Icons (▲ / ▼) for quick performance signals
📉 KPI Trend Charts for MTD and YTD visualization
🗂 Structured KPI Definition Sheet for dynamic expansion
⚙️ Separate Actual, Target & Previous Year Input Sheets
Green ▲ shows strong performance.
Red ▼ highlights areas needing attention.
Managers instantly identify performance gaps without reading lengthy reports.
What’s Inside the Firearms Manufacturing KPI Dashboard in Excel 📂
This dashboard contains 7 well-organized worksheets:
1️⃣ Home Sheet – Navigation Panel
The Home sheet acts as the control center.
It includes 6 navigation buttons to access:
-
Dashboard
-
KPI Trend
-
Actual Numbers Input
-
Target Sheet
-
Previous Year Numbers
-
KPI Definition
Navigation becomes simple and professional.
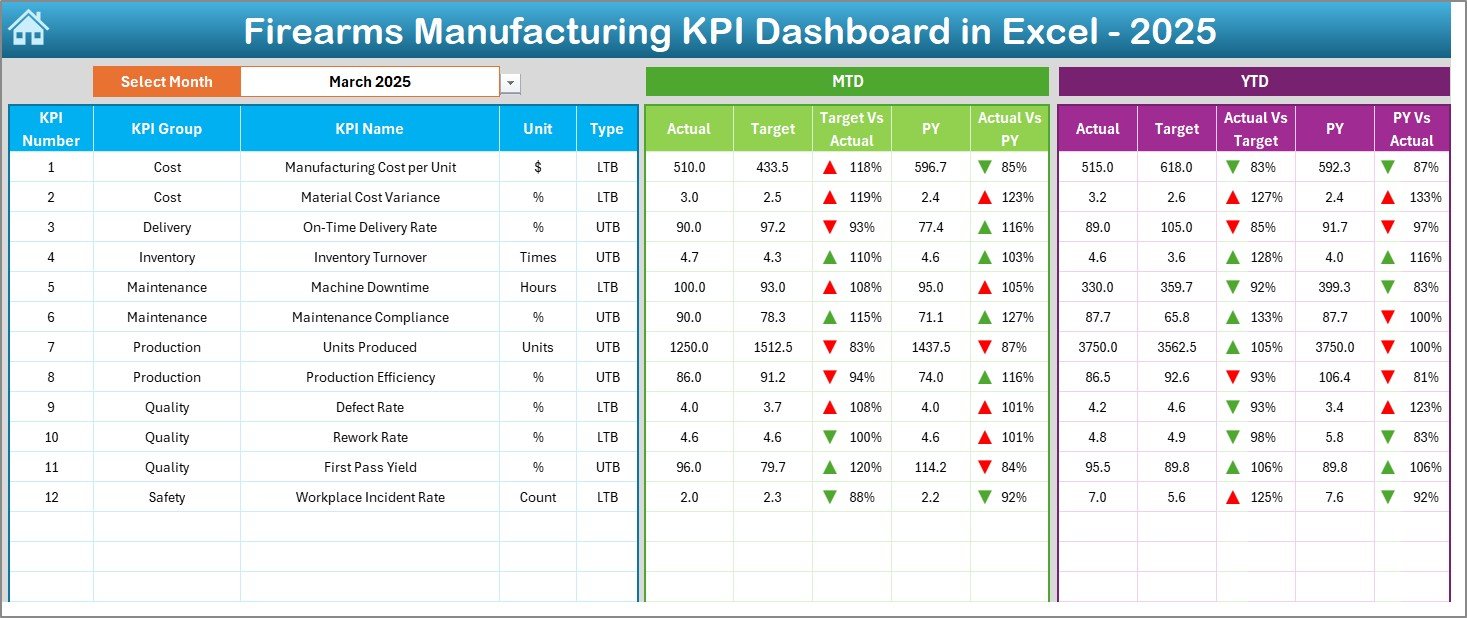
2️⃣ Dashboard Sheet – Performance Overview
This is the main reporting page.
Select the month from cell D3, and the entire dashboard updates automatically.
It displays:
✔ MTD Actual
✔ MTD Target
✔ Previous Year MTD
✔ Target vs Actual %
✔ CY vs PY %
✔ YTD Actual
✔ YTD Target
✔ Previous Year YTD
Formulas used:
Actual MTD / Target MTD
Current Year / Previous Year
Both short-term and long-term performance appear on one screen.
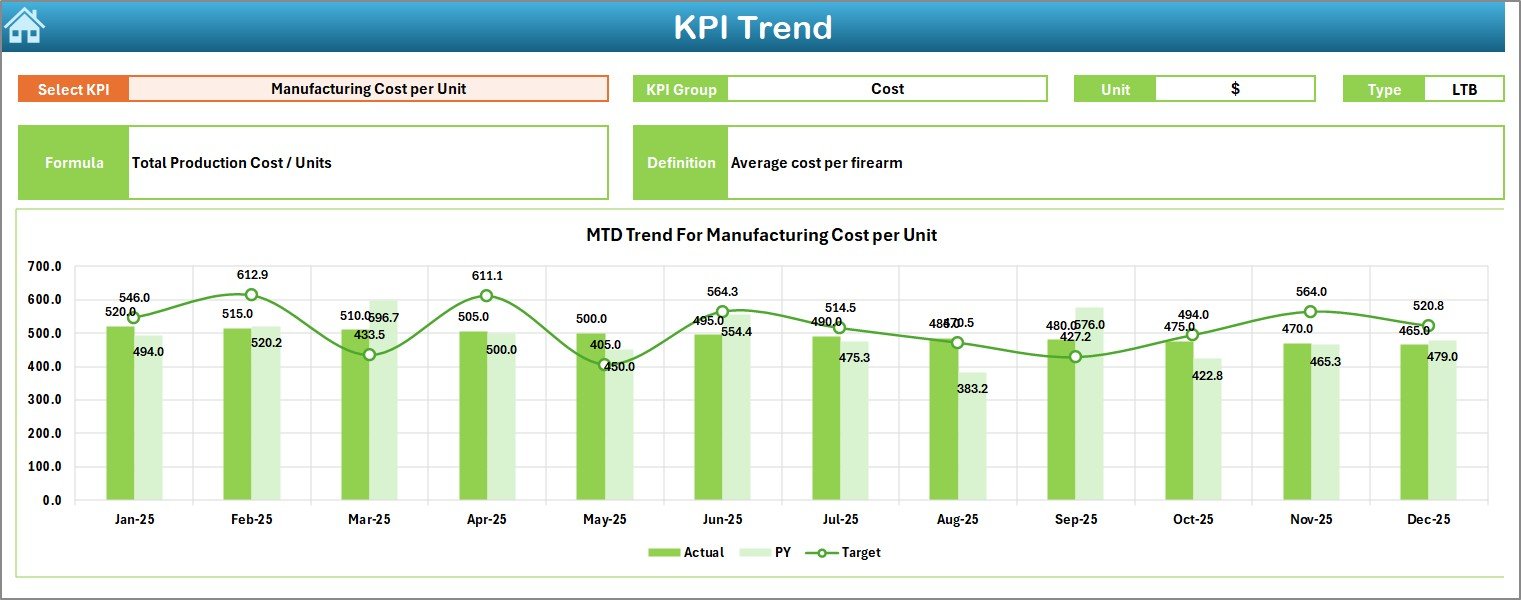
3️⃣ KPI Trend Sheet – Visual Analysis
Select KPI from drop-down (Cell C3).
This sheet displays:
-
KPI Group
-
Unit
-
Type (LTB / UTB)
-
Formula
-
Definition
Plus:
📊 MTD Trend Chart
📈 YTD Trend Chart
Each chart compares:
Actual vs Target vs Previous Year
This helps detect performance patterns instantly.
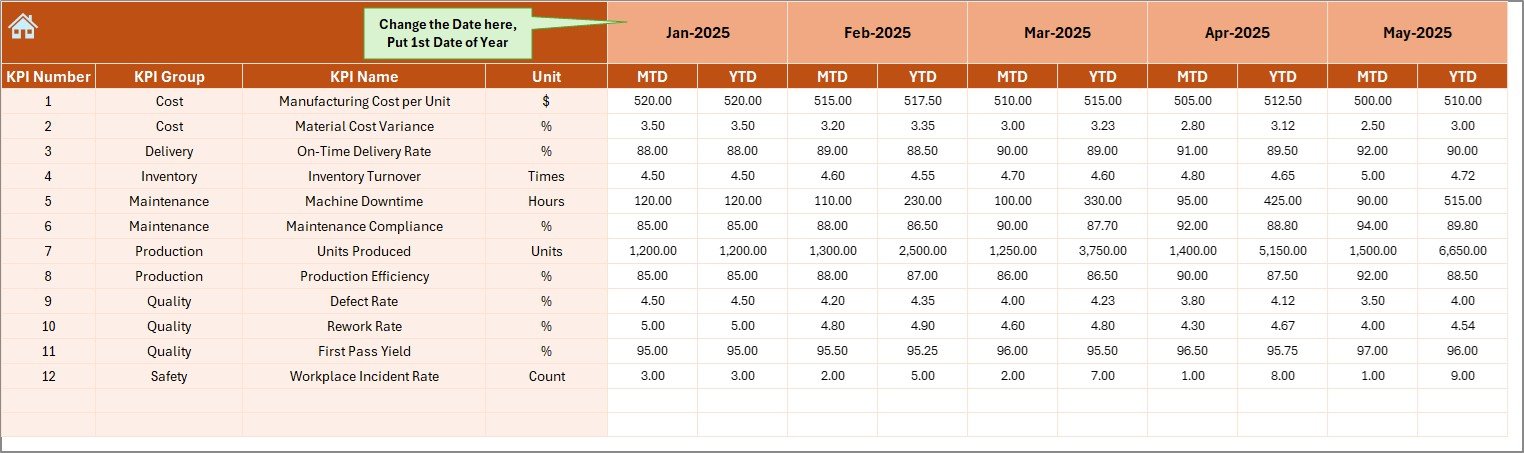
4️⃣ Actual Numbers Input Sheet
Enter monthly:
MTD Actual
YTD Actual
Set first month in cell E1 and continue updating consistently.
5️⃣ Target Sheet
Enter:
Monthly Target MTD
Monthly Target YTD
Accurate targets ensure reliable KPI evaluation.
6️⃣ Previous Year Numbers Sheet
Enter previous year MTD and YTD values.
This enables automatic year-over-year growth comparison.
7️⃣ KPI Definition Sheet
Define:
KPI Name
KPI Group
Unit
Formula
Definition
Type (LTB / UTB)
Because of this structure, the dashboard becomes scalable and flexible.
How to Use the Firearms Manufacturing KPI Dashboard in Excel ⚙️
Using the dashboard is straightforward:
1️⃣ Enter monthly actual numbers.
2️⃣ Update targets for each KPI.
3️⃣ Add previous year data.
4️⃣ Select month from D3.
Dashboard updates instantly.
You can customize KPIs such as:
Units Produced
Production Efficiency Rate
Machine Utilization %
Defect Rate
Rework Rate
Safety Incident Rate
Cost per Unit
Inventory Turnover
Compliance Audit Score
Everything becomes centralized and measurable.
Who Can Benefit from This Firearms Manufacturing KPI Dashboard in Excel 🎯
This dashboard is ideal for:
✔ Production Managers
✔ Quality Control Teams
✔ Compliance Officers
✔ Finance Departments
✔ Plant Supervisors
✔ Manufacturing Executives
Whether you operate a small facility or a large production plant, this dashboard supports operational control and strategic decision-making.
Instead of reacting to problems, you proactively manage performance.
Instead of guessing trends, you measure them.
Instead of manual reports, you gain structured insight.
The Firearms Manufacturing KPI Dashboard in Excel transforms factory data into clear, actionable intelligence.
It improves visibility, enhances compliance tracking, supports quality control, and strengthens profitability monitoring.
If you want precision in reporting that matches precision in manufacturing — this dashboard delivers it.
Click here to read the Detailed blog post
Visit our YouTube channel to learn step-by-step video tutorials:
👉 https://www.youtube.com/@PKAnExcelExpert


