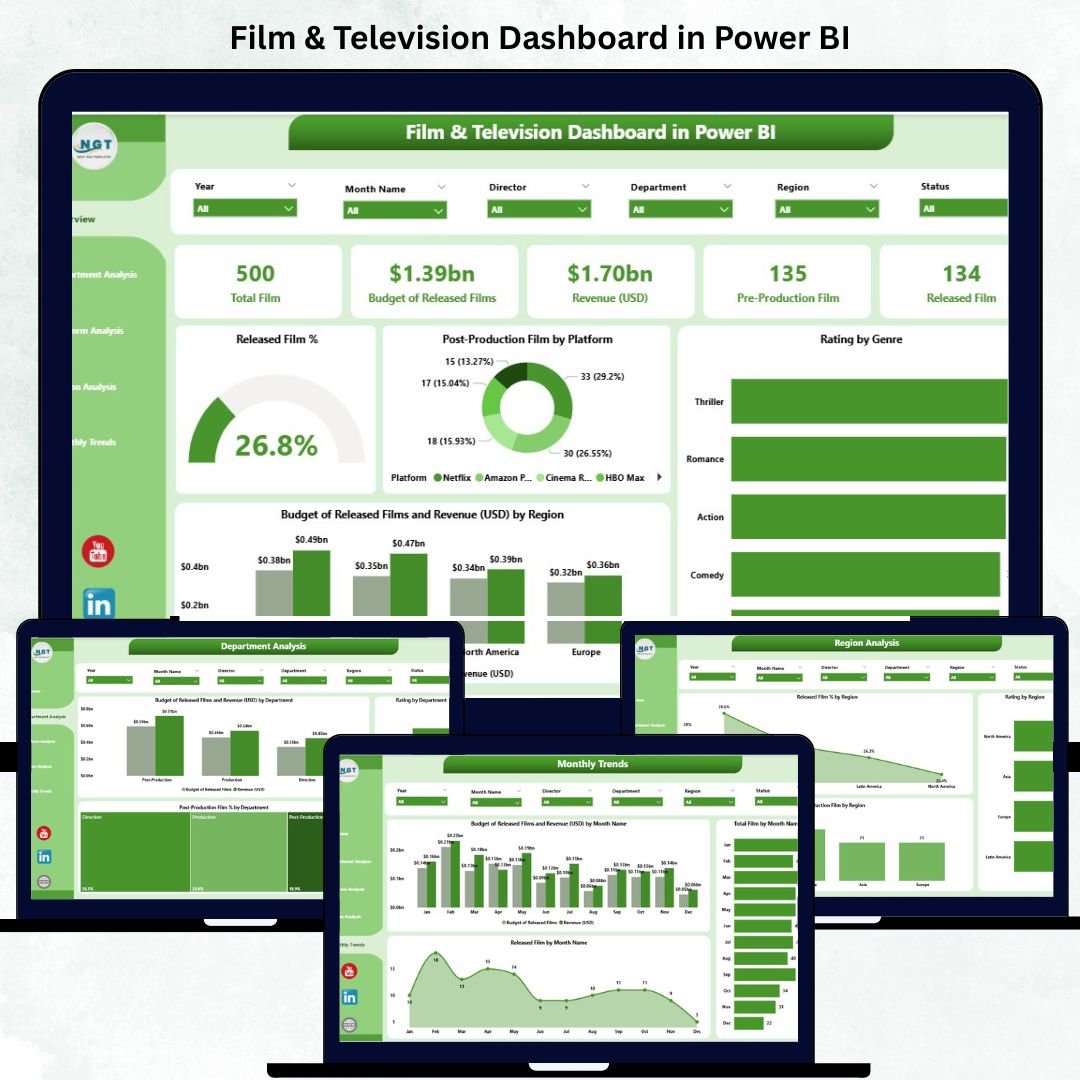
The Film & Television Dashboard in Power BI brings data and creativity together — giving studios, production houses, and distributors the power to track film performance, measure revenue, and analyze audience engagement all in one stunning interactive platform.
Built entirely in Microsoft Power BI, this ready-to-use dashboard turns your raw production and financial data into meaningful visual stories. From pre-production planning to post-release analysis, you can monitor budgets, ratings, and regional performance with ease. Whether you manage independent films or large-scale productions, this dashboard ensures you stay data-driven in every creative decision.
✨ Key Features of the Film & Television Dashboard in Power BI
✅ 📊 Overview Page – The Central Insight Hub
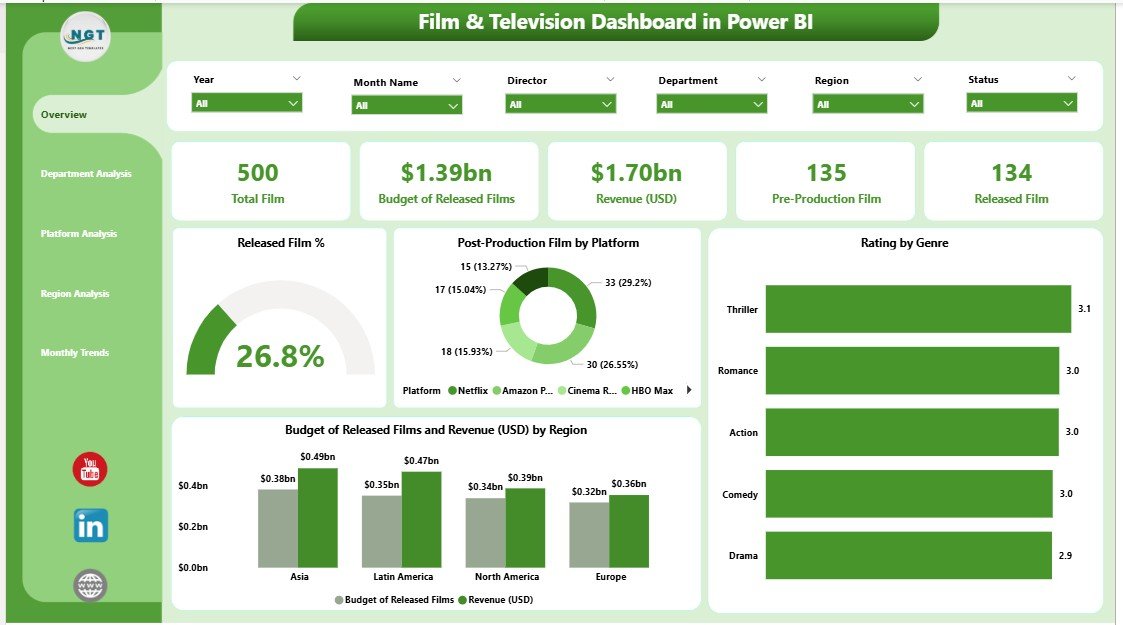
Gain an instant summary of your entire entertainment portfolio!
-
5 KPI Cards display Total Films, Released Film %, Average Rating, Total Budget (USD), and Total Revenue (USD).
-
Interactive charts visualize Released Film %, Post-Production Films by Platform, Ratings by Genre, Budget of Released Films, and Revenue (USD) by Region.
🎯 Use left-side slicers to filter data by month, genre, or platform for real-time insights.
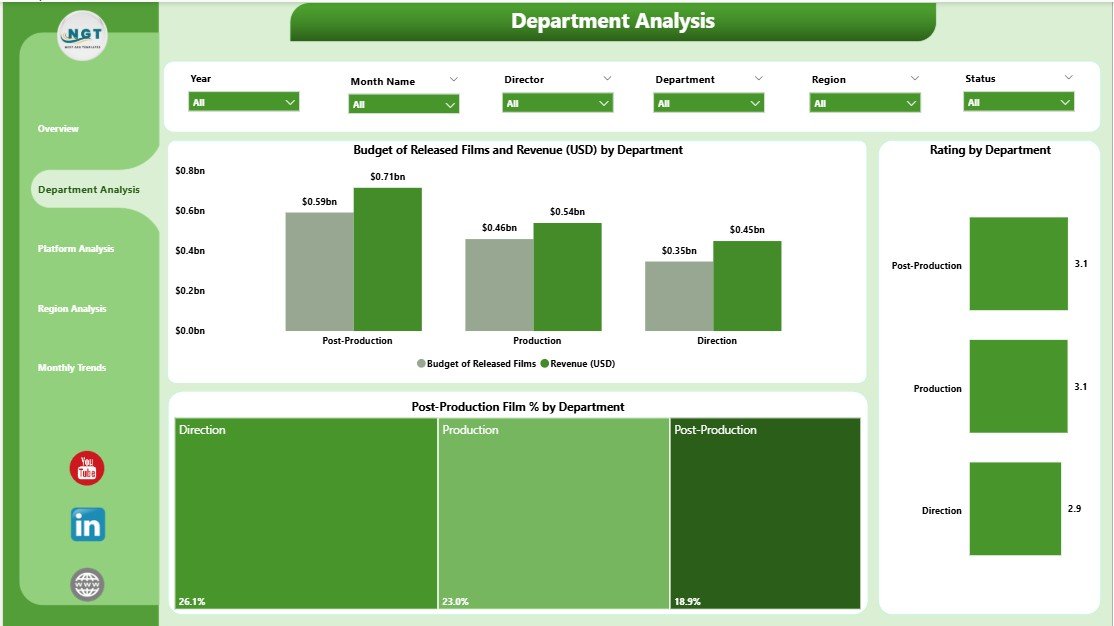
✅ 🏢 Department Analysis Page – Compare Team Performance
Track efficiency and spending across production, direction, editing, and marketing teams.
Charts include:
-
Budget vs Revenue (USD) by Department
-
Ratings by Department
-
Post-Production Film % by Department
💡 Helps identify which departments consistently deliver within budget and which need optimization.
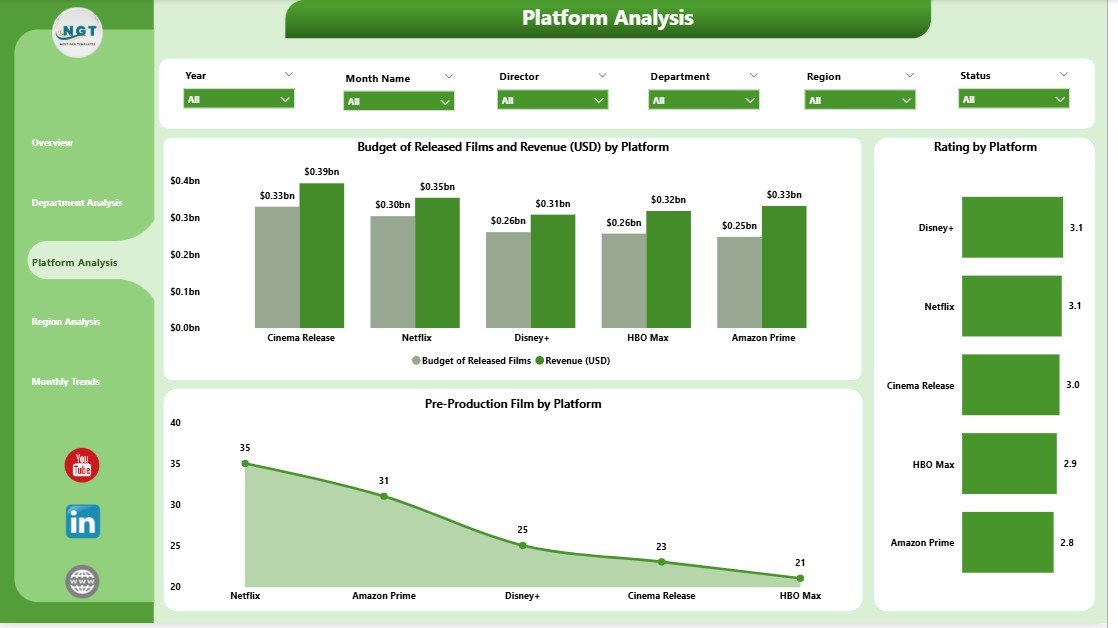
✅ 💻 Platform Analysis Page – Evaluate Streaming & Distribution Channels
Understand which digital or TV platforms deliver the most impact.
Includes charts like:
-
At-Risk Budget of Released Films and Revenue by Platform
-
Ratings by Platform
-
Post-Production Films by Platform
🎬 Compare Netflix, Amazon Prime, or regional broadcasters in one glance!
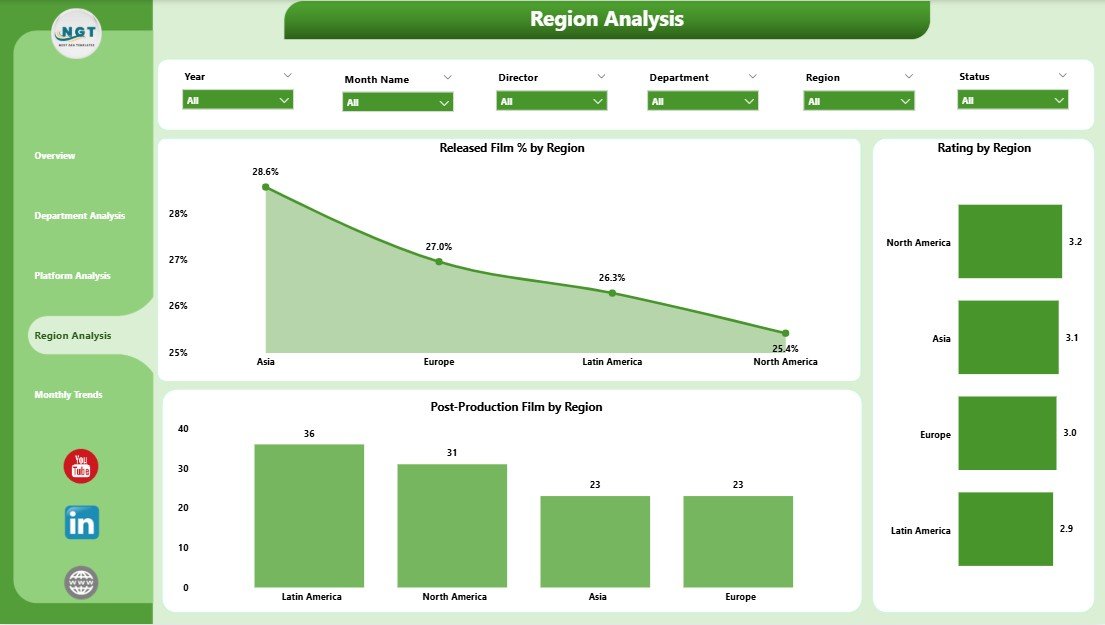
✅ 🌍 Region Analysis Page – Measure Global Reach
Discover regional success patterns with charts like:
-
Ratings by Region
-
Released Film % by Region
-
Post-Production Films by Region
🌎 Perfect for deciding where to premiere, market, or localize your films.
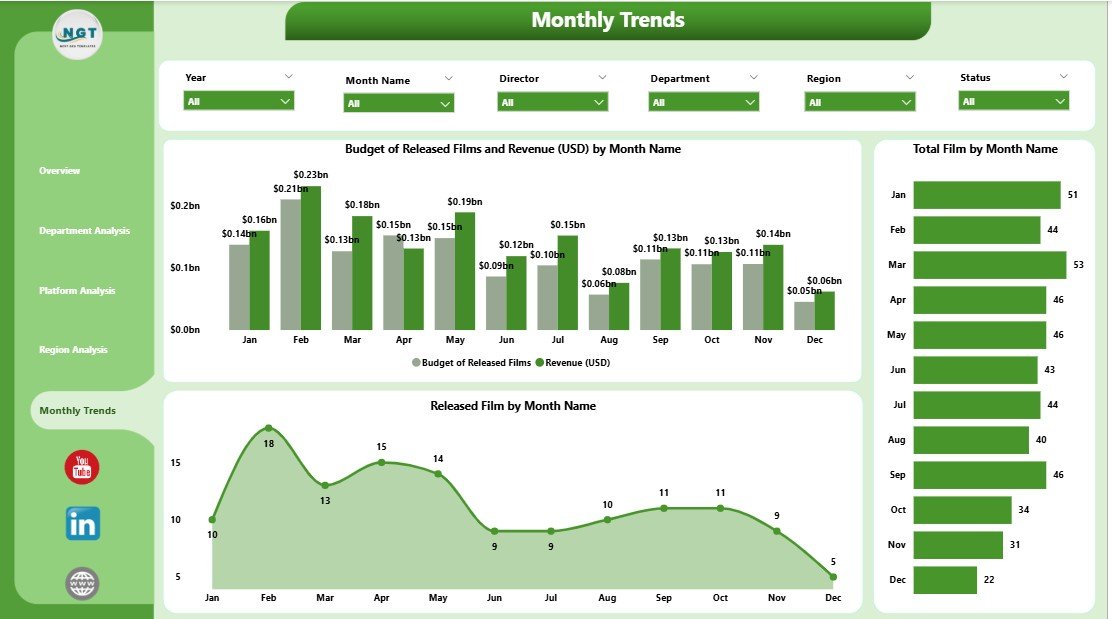
✅ 📅 Monthly Trends Page – Track Seasonal Performance
Explore time-based trends with visuals for Released Films by Month, Revenue by Month, and Ratings by Genre.
📈 Plan production calendars and release schedules using data-backed insights.
✅ 🔄 Real-Time Insights – Refresh Excel data to update Power BI visuals instantly.
✅ 📈 Smart Visual Storytelling – Dynamic slicers, color-coded charts, and interactive KPIs make analytics effortless.
✅ 🧩 Customizable Design – Add visuals, genres, or KPIs to suit your studio’s unique requirements.
📦 What’s Inside the Film & Television Dashboard
📁 Five Powerful Analytical Pages:
1️⃣ Overview Page – Overall industry and business insights.
2️⃣ Department Analysis – Evaluate performance by department.
3️⃣ Platform Analysis – Assess revenue and ratings by channel.
4️⃣ Region Analysis – Understand audience behavior by geography.
5️⃣ Monthly Trends – Review and forecast production timelines.
🎯 Core KPIs Measured:
-
Released Film %
-
Post-Production Film %
-
Budget vs Revenue (USD)
-
Rating by Genre, Department, and Region
💡 Design Highlights:
-
Sidebar page navigator for easy movement across pages.
-
Conditional formatting and DAX-based KPIs.
-
Clean, visual storytelling layout built for creative professionals.
⚙️ How to Use the Film & Television Dashboard
1️⃣ Connect Data: Import Excel or CSV files with your film data (genre, region, budget, rating, etc.).
2️⃣ Navigate Pages: Use the sidebar navigator to explore Overview, Department, or Region pages.
3️⃣ Apply Filters: Use slicers for month, platform, or department to customize your view.
4️⃣ Compare KPIs: Evaluate revenue, ratings, and production costs.
5️⃣ Discover Trends: View the Monthly Trends page for seasonal insights.
6️⃣ Share Results: Publish the dashboard to Power BI Service for team collaboration.
💡 Pro Tip: Update your Excel source weekly to keep all insights current and accurate!
👥 Who Can Benefit from This Dashboard
🎬 Film Producers & Studio Heads – Track budget utilization, film releases, and global revenue.
🎞️ Marketing Teams – Identify which genres and regions perform best for targeted campaigns.
🎥 Directors & Creative Teams – Analyze ratings and creative impact by genre or platform.
📈 Financial Analysts – Compare budgets vs actuals and forecast future performance.
📊 Data Analysts – Transform scattered entertainment data into strategic insights.
📺 Streaming & Distribution Partners – Measure content success by platform and audience.
With this Power BI dashboard, every decision — from production spending to marketing strategy — becomes smarter, faster, and fully data-driven.
🔗 Click here to read the Detailed Blog Post
🎥 Visit our YouTube channel to learn step-by-step video tutorials


Reviews
There are no reviews yet.