The Excel Magic: Stunning Animated Progress Circle Charts for Project Tracking is an innovative and visually captivating tool designed to track and present project progress in a dynamic and engaging way. This Excel template brings a fresh and interactive approach to project tracking by using animated progress circles to display data and milestones in a visually appealing format.
With customizable features, you can tailor the progress circles to reflect different data points, such as project completion, task progress, or performance goals. The animation provides a lively, real-time update to project status, allowing you to easily visualize the advancement of tasks or projects. This template is ideal for project managers, team leaders, and anyone who needs to present project progress with a professional and visually compelling chart.

Key Features of the Animated Progress Circle Charts for Project Tracking
📌 Animated Progress Circles
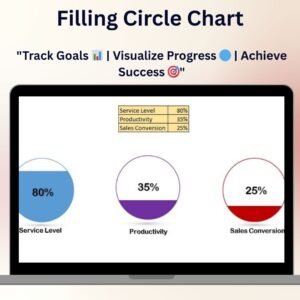
The main feature of this template is the dynamic, animated progress circle that visually represents the percentage of completion. As you input data, the circle gradually fills, providing a clear and engaging representation of progress.
🛠 Customizable Data Points
Adapt the progress circles to track various metrics, such as project completion, task status, milestones, or KPIs. Customize the labels, colors, and ranges to match your project needs.
💡 Real-Time Updates
As new data is entered, the animated circles update automatically, giving you real-time feedback on your project’s progress. This feature allows you to monitor the status of multiple tasks or projects effortlessly.
🔢 Multiple Progress Indicators
You can add multiple progress circles to track different tasks or projects simultaneously. This feature helps you visualize and compare various aspects of your project in a clear and concise manner.
🚀 Visual Impact
The animated progress circles are designed to grab attention, making your presentations and reports more engaging. Whether you’re tracking personal goals, team performance, or project timelines, this chart adds a professional touch to your data visualization.
📊 Data Integration
Seamlessly integrate the progress circles with your existing data sets. This tool works directly within Excel, allowing you to enter or update data, and watch as your progress circle fills up in real-time.
⚙ Easy to Use
The template is user-friendly, with clear instructions on how to set up and use the progress circles. Whether you’re a beginner or an advanced Excel user, you’ll find it easy to implement this tool into your project tracking.
🚀 Why You’ll Love the Animated Progress Circle Charts for Project Tracking
✅ Visually Engaging – Use animated circles to track and visualize project progress. ✅ Customizable and Flexible – Adapt the chart to track different data points and goals. ✅ Real-Time Tracking – Automatically update progress as you input new data. ✅ Multiple Indicators – Track multiple tasks or projects at the same time. ✅ Professional and Dynamic – Make your presentations and reports more engaging and interactive.
📂 What’s Inside the Animated Progress Circle Charts for Project Tracking?
- Animated Progress Circles: Visual representation of project completion with filling progress circles.
- Customizable Labels and Data Points: Change the labels, colors, and data values to suit your project.
- Real-Time Updates: As you input data, the circles automatically update to reflect the current progress.
- Multiple Charts: Track multiple aspects of your project or multiple projects simultaneously.
- Easy Setup and Instructions: Clear, step-by-step guide to help you get started quickly.
🔍 How to Use the Animated Progress Circle Charts for Project Tracking
1️⃣ Download the Template – Instant access to the Excel file upon purchase. 2️⃣ Customize Your Data – Modify the labels, data points, and progress values to fit your needs. 3️⃣ Input Data – Enter the project data into the designated fields and watch the progress circle update. 4️⃣ Monitor Progress – Keep track of your project’s completion in real-time with dynamic progress indicators. 5️⃣ Present and Share – Use the charts in meetings, presentations, or reports for a professional touch.
🎯 Who Can Benefit from the Animated Progress Circle Charts for Project Tracking? 🔹 Project Managers 🔹 Team Leaders 🔹 Business Analysts 🔹 Sales Teams 🔹 HR Professionals 🔹 Anyone needing a visually engaging way to track and present project progress
Stay on top of your project’s progress with the Animated Progress Circle Charts for Project Tracking in Excel. This tool makes it easier to visualize data, track milestones, and present your project’s status in an engaging and interactive way.










Reviews
There are no reviews yet.