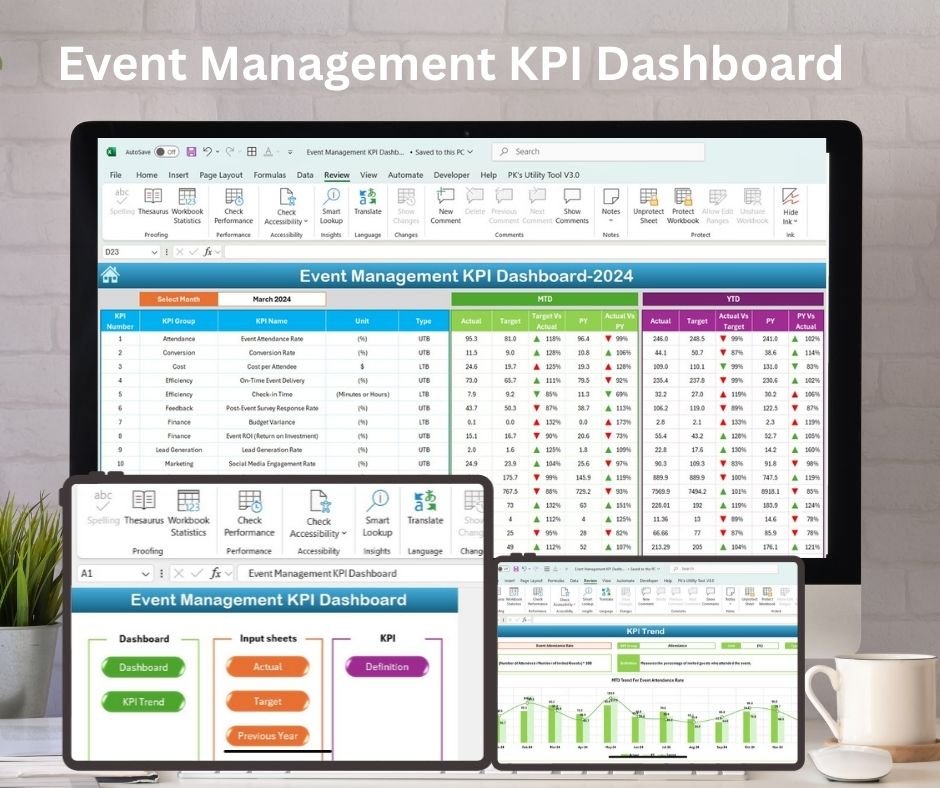
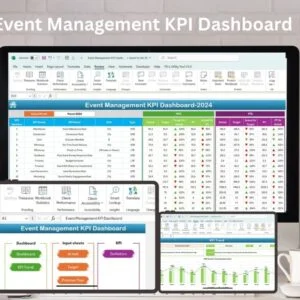
The Event Management KPI Dashboard in Excel is a powerful tool designed to help event planners, coordinators, and managers track and optimize key performance indicators (KPIs) for every aspect of event planning and execution. Whether you’re managing a conference, wedding, concert, or corporate event, this dashboard provides a centralized view of key metrics like attendee engagement, budget tracking, and event success.
With real-time data updates, visual trend analysis, and customizable fields, this dashboard is perfect for tracking event progress, improving operational efficiency, and ensuring the event meets its goals. This tool allows event managers to focus on what matters most—creating memorable and successful events.
Key Features of the Event Management KPI Dashboard in Excel:
📊 Comprehensive Event Tracking
Track key KPIs such as attendee registration, event attendance, budget vs. actual expenses, vendor performance, and guest satisfaction—all in one dashboard.
📈 Real-Time Performance Monitoring
Monitor your event’s performance in real-time with up-to-date information on budgets, attendee engagement, and logistical operations.
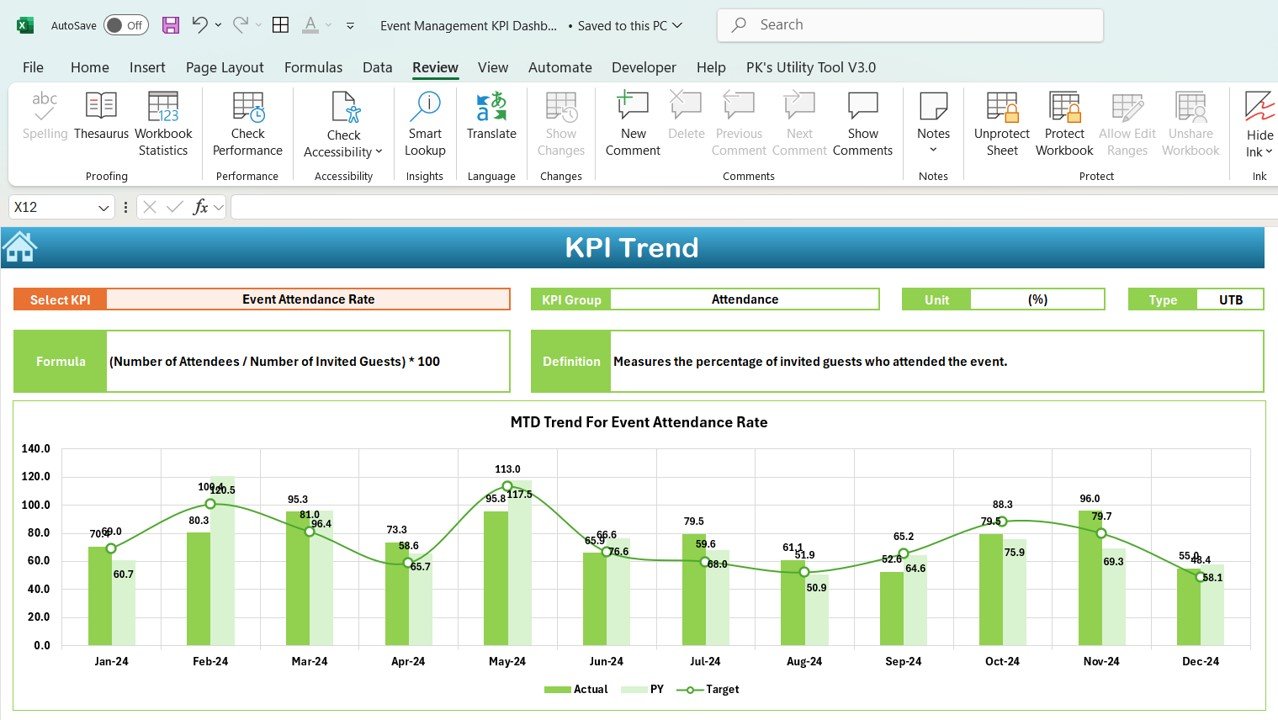
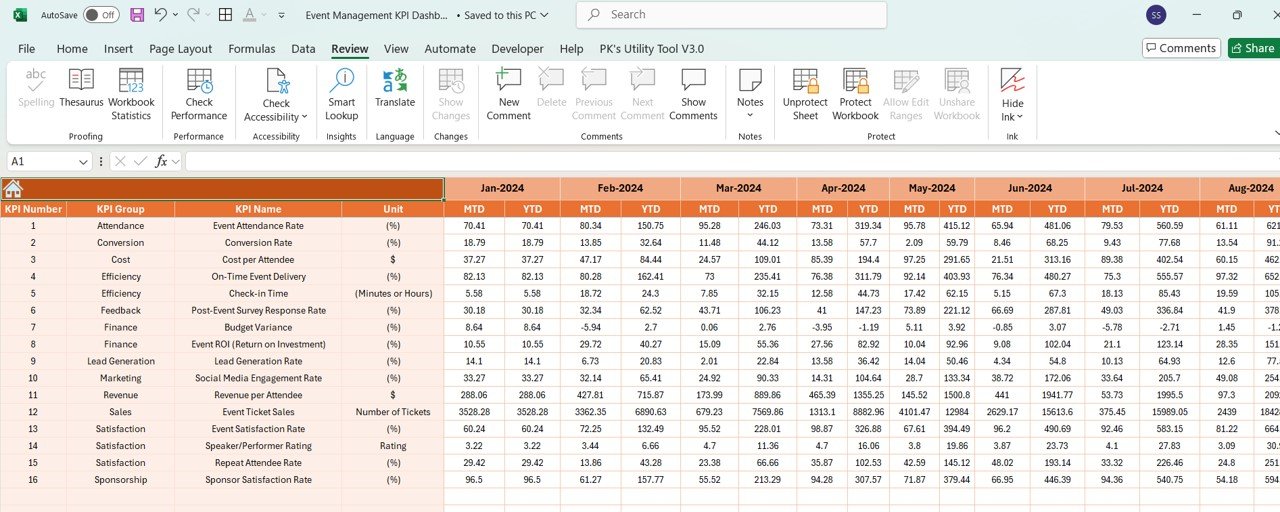
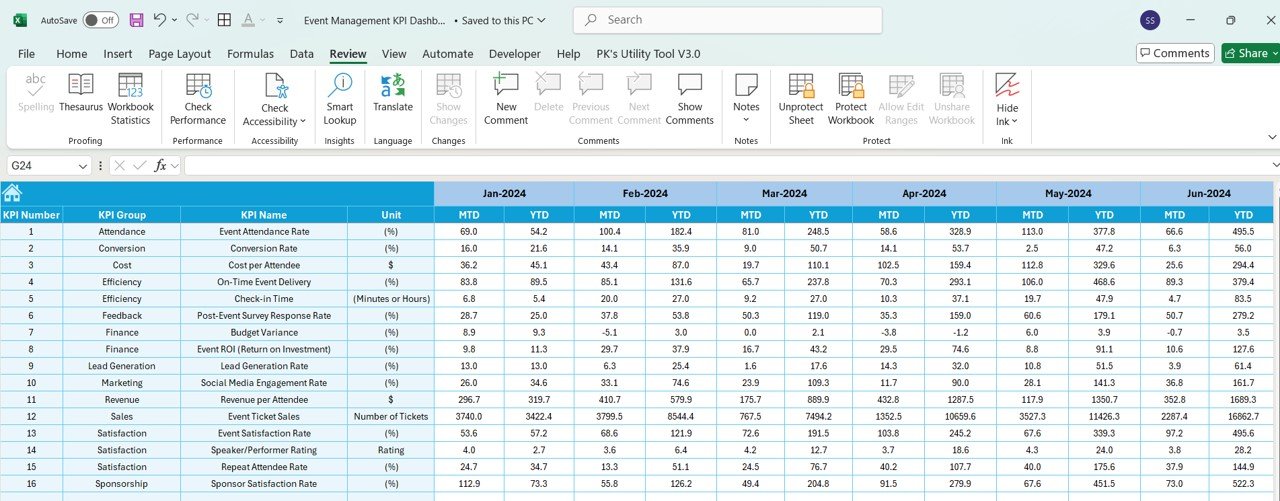
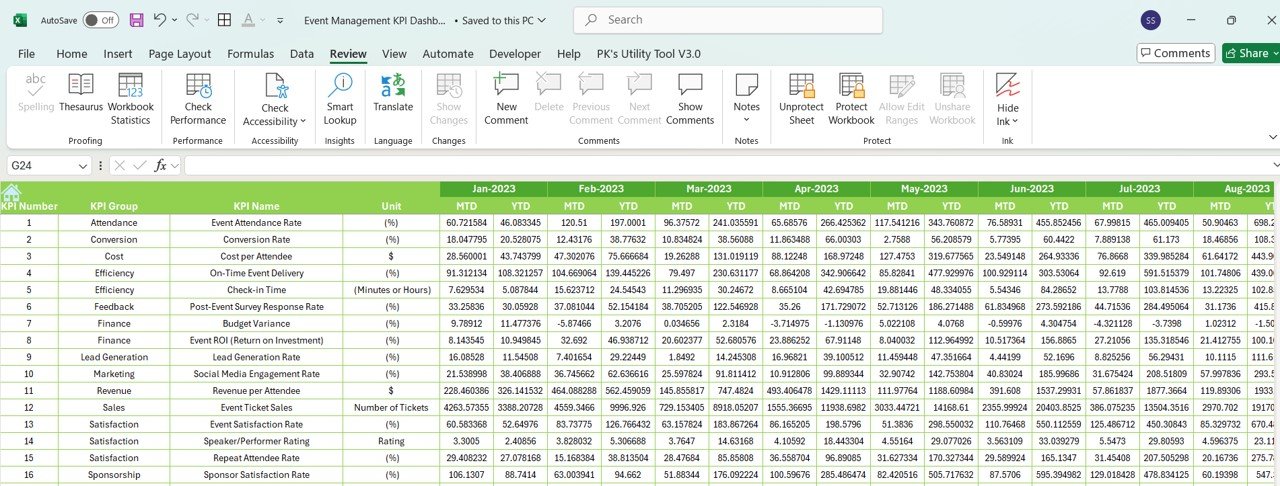
📅 Month-to-Date (MTD) and Year-to-Date (YTD) Analysis
Track the performance of your events over time, comparing current event data with previous events or overall trends in your event planning.
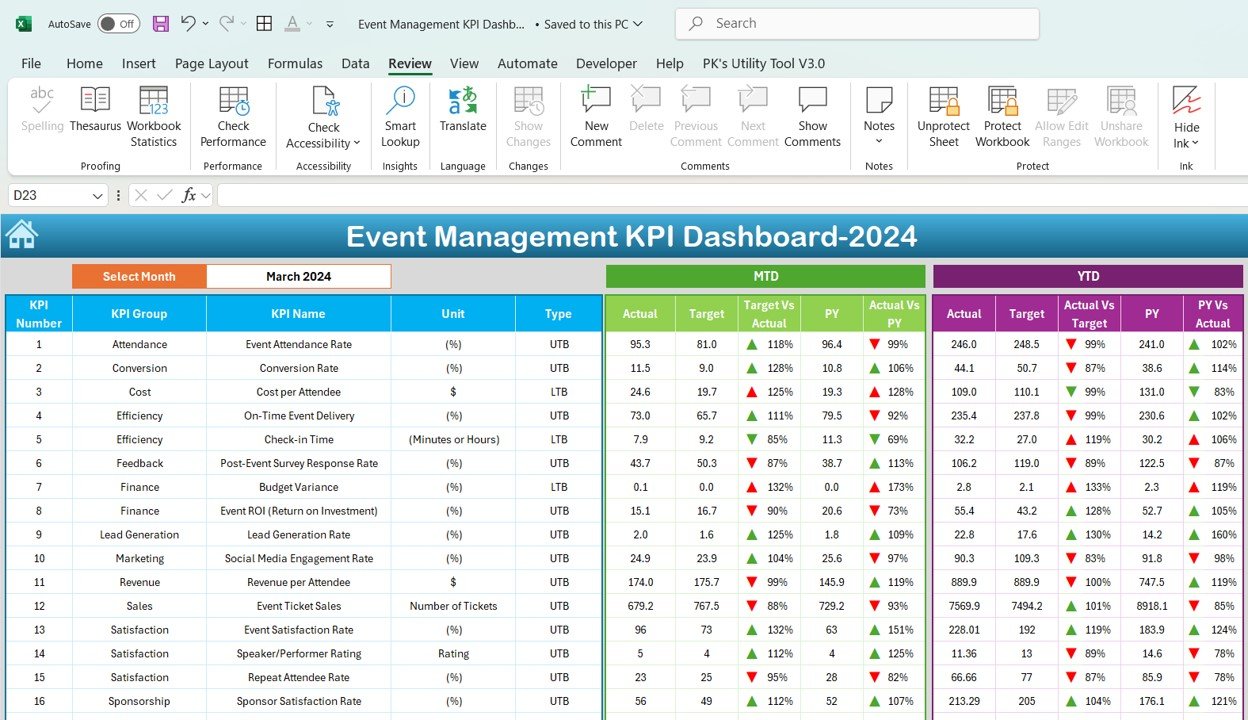
🎯 Goal Setting and Performance Comparison
Set specific targets for your event’s KPIs and compare them to actual performance. Ensure your event is on track to meet or exceed expectations.
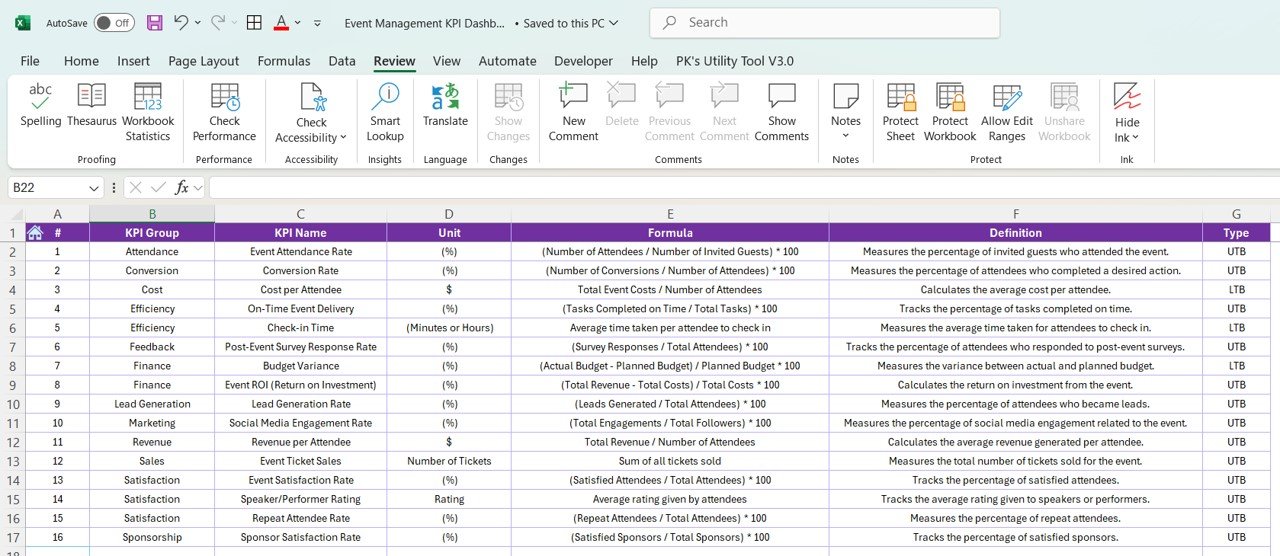
🛠 Customizable Inputs
Easily input your own event data, such as registration numbers, budget details, and guest satisfaction ratings. Tailor the dashboard to meet the unique needs of each event.
🔔 Conditional Formatting Alerts
Get real-time alerts through color-coded indicators to quickly identify any underperforming areas like overspending, low attendance, or unmet objectives.
🎟️ Attendee Engagement Insights
Monitor key metrics related to attendee engagement, such as session participation, feedback scores, and overall satisfaction.
🚀 Why You’ll Love the Event Management KPI Dashboard in Excel:
✅ Streamline Event Operations – Track all your key event data in one place, reducing the time spent on administrative tasks and helping you focus on execution.
✅ Enhance Event Success – By tracking key metrics, you can identify potential issues early and adjust your event strategy accordingly.
✅ Improve Budget Control – Monitor your event budget in real-time to prevent overspending and ensure a profitable event.
✅ Increase Attendee Satisfaction – Use data-driven insights to improve guest experience, whether it’s through better logistics or more engaging sessions.
✅ User-Friendly Interface – Designed for non-technical users, the dashboard is easy to navigate and use, ensuring anyone can manage it.
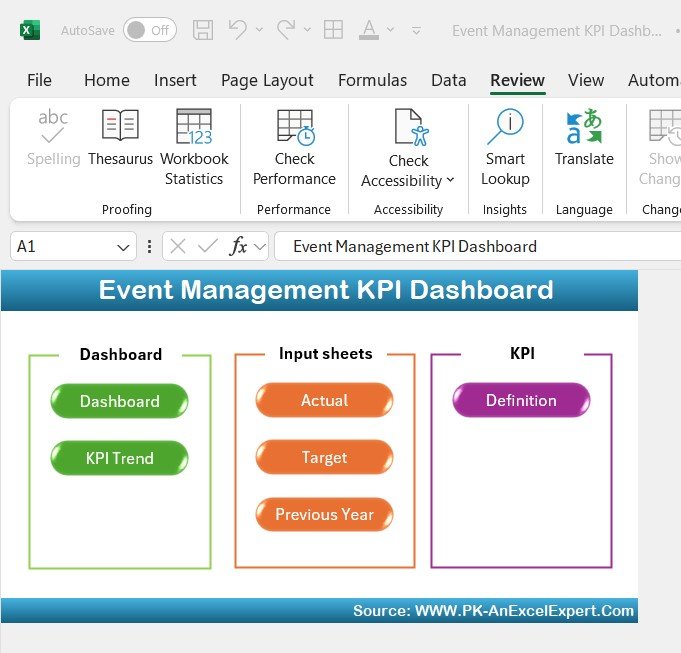
What’s Inside the Event Management KPI Dashboard in Excel:
- Attendee Registration KPI: Track the number of attendees registered vs. actual attendees.
- Budget vs. Actual KPI: Monitor event expenses, ensuring you stay within your budget while tracking all expenditures.
- Vendor Performance KPI: Evaluate the performance of event vendors in areas such as delivery time, service quality, and contract fulfillment.
- Event Attendance KPI: Measure event attendance, session participation, and engagement throughout the event.
- Guest Satisfaction KPI: Gather and monitor guest satisfaction data to improve future event experiences.
- Session Feedback KPI: Track feedback from attendees on various sessions and workshops to assess content relevance and speaker effectiveness.
How to Use the Event Management KPI Dashboard in Excel:
1️⃣ Download the Template – Instantly access your Excel file upon purchase.
2️⃣ Input Your Data – Enter data such as registrations, expenses, and attendee feedback into the pre-designed fields.
3️⃣ Set Targets – Define your goals for attendance, budget, guest satisfaction, and other key metrics.
4️⃣ Track Performance – Monitor real-time event performance and adjust strategies if necessary to ensure success.
5️⃣ Generate Reports – Use the dashboard to generate detailed reports for stakeholders or team meetings.
Who Can Benefit from the Event Management KPI Dashboard in Excel:
- Event Planners
- Event Coordinators
- Conference Managers
- Corporate Event Managers
- Wedding Planners
- Festival Organizers
- Non-Profit Event Managers
- Business Owners
The Event Management KPI Dashboard in Excel is the perfect tool for anyone in the event industry looking to optimize operations, track performance, and create successful events.
Click here to read the Detailed blog post
https://www.pk-anexcelexpert.com/event-management-kpi-dashboard/
Visit our YouTube channel to learn step-by-step video tutorials
Youtube.com/@PKAnExcelExpert


Reviews
There are no reviews yet.