


🔑 Key Features of Etsy Seller Analytics Dashboard in HTML
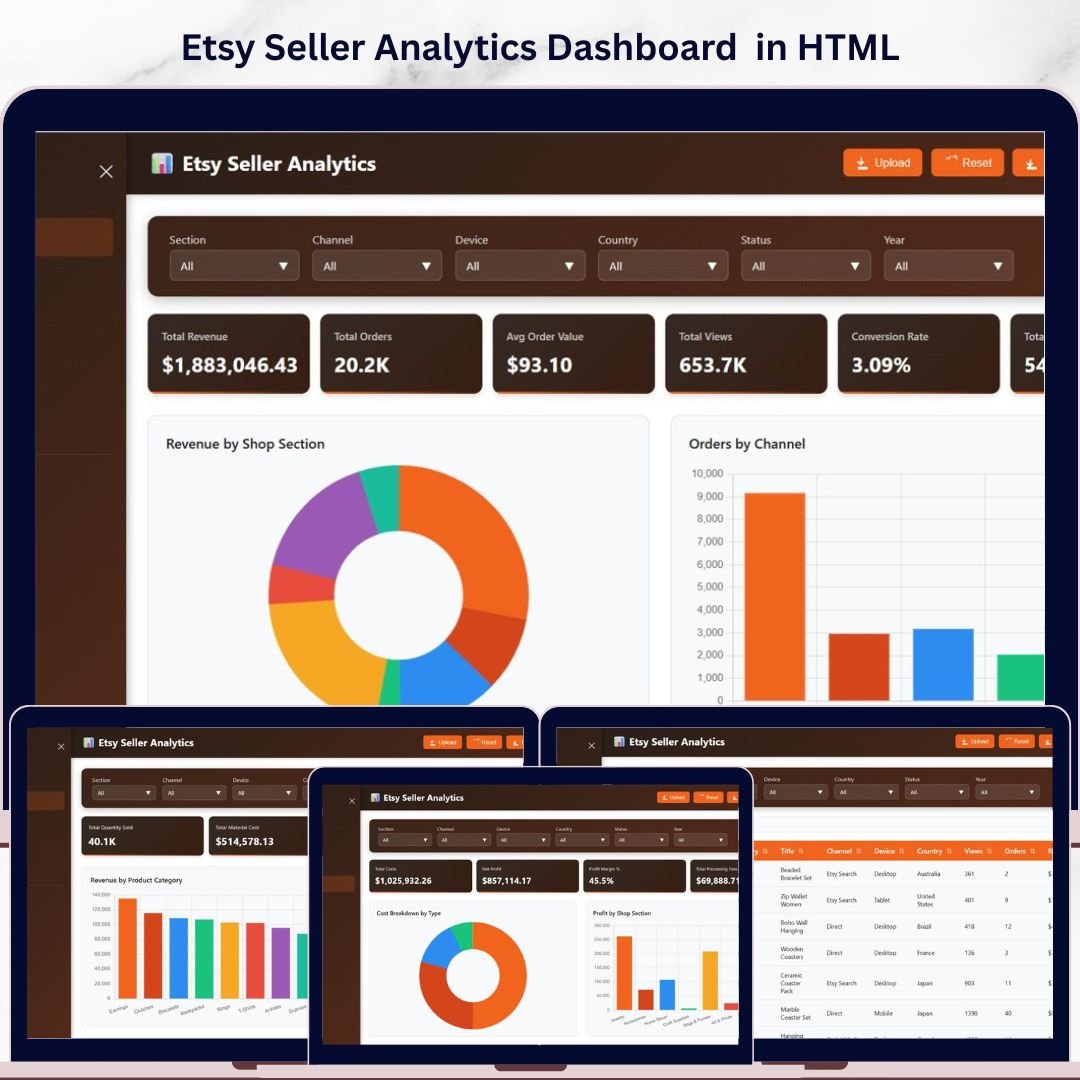
Etsy Seller Analytics Dashboard in HTML is a professionally designed, interactive analytics template built specifically for Etsy shop owners who want to monitor revenue, orders, traffic, product performance, costs, and profitability — all from a single browser-based dashboard. This template includes 5 interactive dashboard pages covering Overview, Sales Analysis, Traffic and Engagement, Cost and Profitability, and a detailed Data View, delivering a complete 360-degree view of your Etsy shop business 🚀.
Whether you sell handmade products, vintage items, or digital downloads on Etsy, this HTML Dashboard Template transforms your raw Etsy data into actionable visual insights instantly. Simply open the index.html file in any modern browser, connect your data, and all charts, KPI cards, and filters update automatically. This Etsy Seller Analytics Dashboard in HTML tracks 6 key performance indicators on the Overview page including Total Revenue, Total Orders, Avg Order Value, Total Views, Conversion Rate, and Total Favorites, with 15+ charts and visualizations spread across 5 dashboard pages.
If you prefer working in other platforms, check out the Etsy Seller Analytics Dashboard in Power BI or the Etsy Seller Analytics Dashboard in Excel for the same analytics in different applications.
📦 What’s Inside the Etsy Seller Analytics Dashboard in HTML
📌 Overview Page — Displays 6 KPI cards: Total Revenue, Total Orders, Avg Order Value, Total Views, Conversion Rate, and Total Favorites. Visual analysis includes Revenue by Shop Section, Orders by Channel, Revenue by Country, Listing Status Distribution, and Monthly Revenue Trend. Multiple slicers let you filter the entire dashboard instantly.
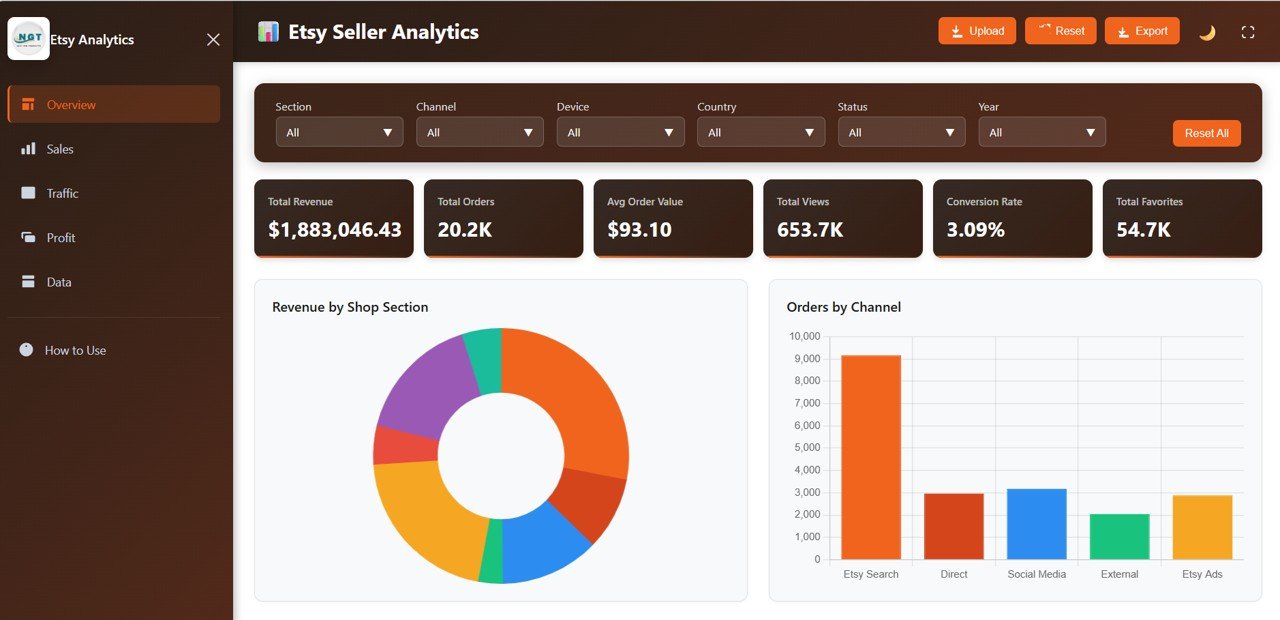
Etsy Seller Analytics Dashboard Overview
📌 Sales Analysis Page — Deep-dive into Revenue by Product Category, Orders by Device, Revenue by Channel, and Top 10 Products by Revenue. Identify your best-selling products and the channels driving the most sales.
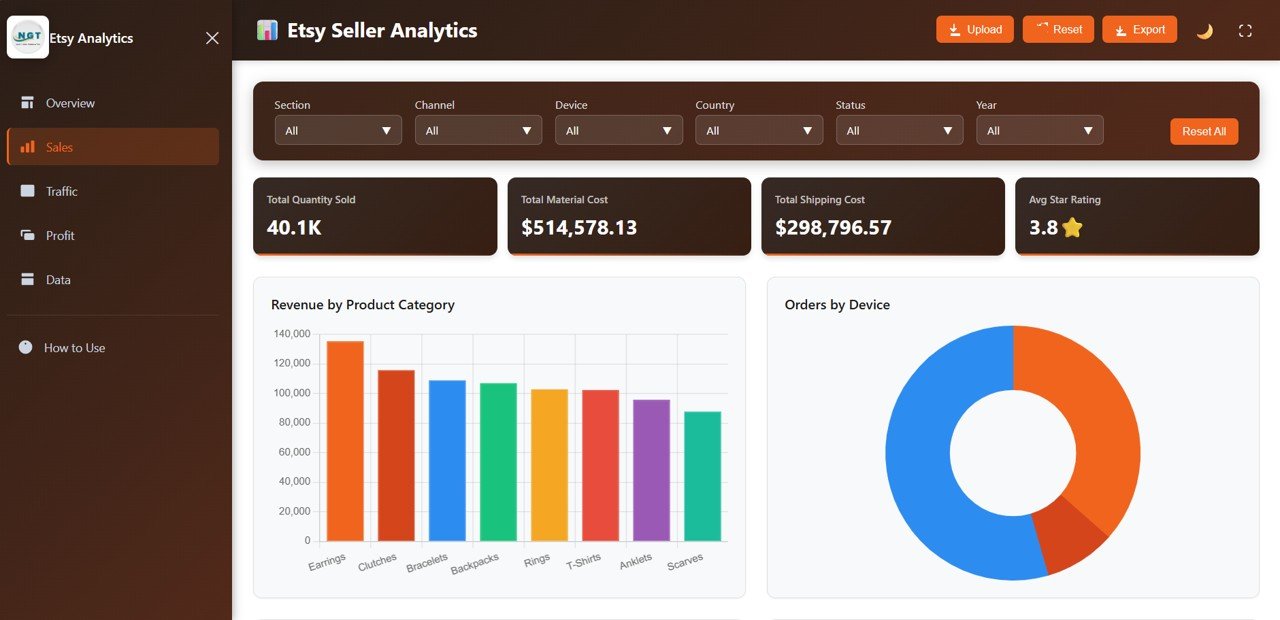
Sales Analysis
📌 Traffic and Engagement Page — Analyze Views by Channel, Favorites by Shop Section, Views by Country, and Views by Device. Understand where your traffic is coming from and which listings attract the most engagement.
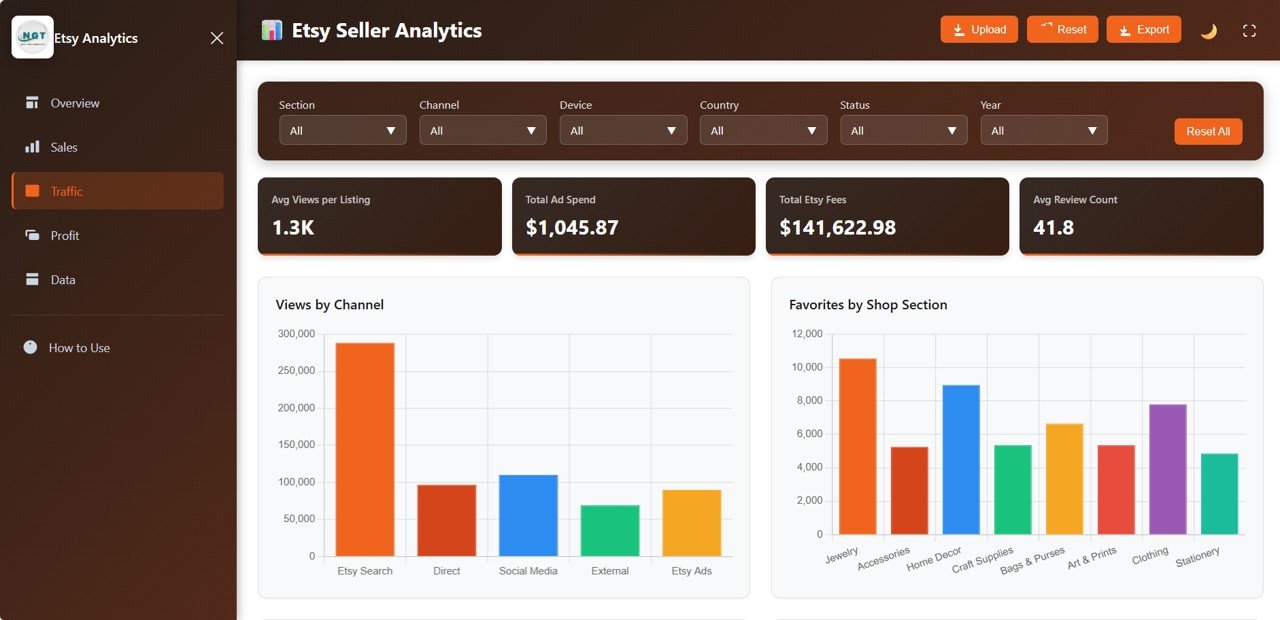
Traffic and Engagement
📌 Cost and Profitability Page — Track Cost Breakdown by Type, Profit by Shop Section, Fees by Channel, and Monthly Profit Trend. See exactly where your money goes and which sections are most profitable.
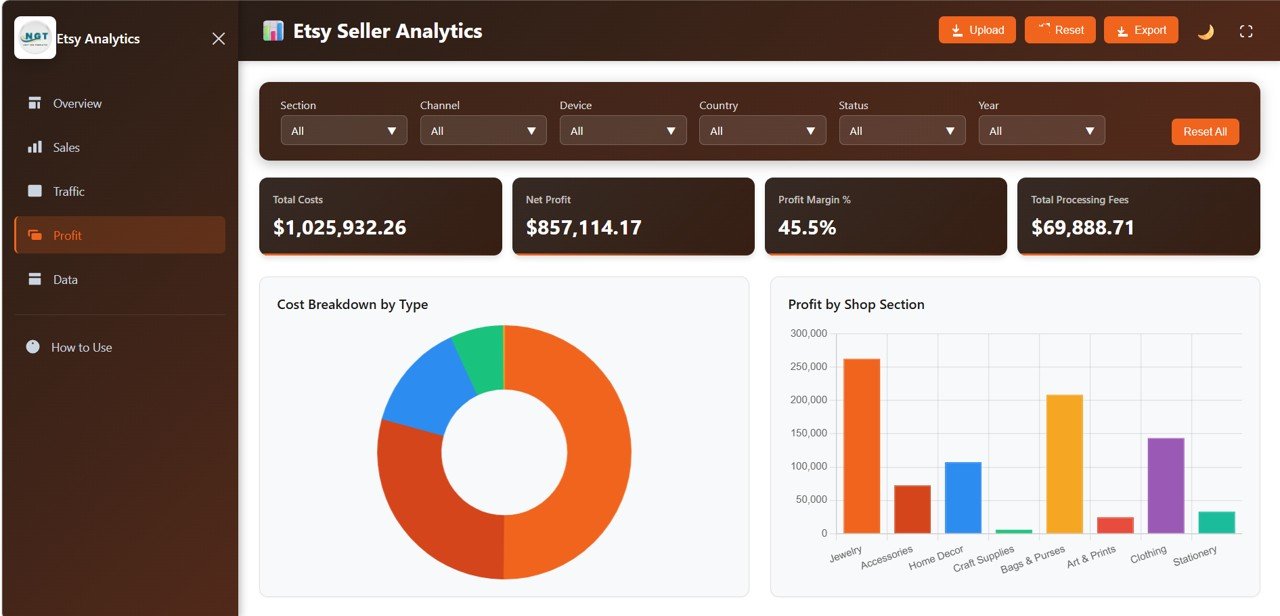
Cost and Profitability
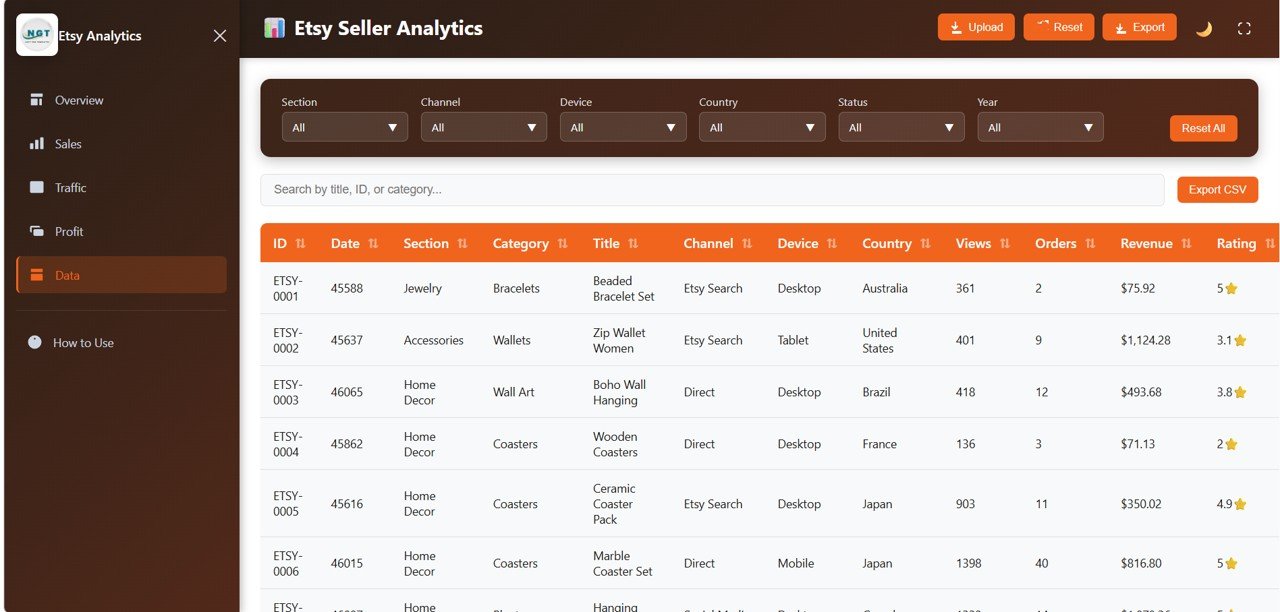
📌 Data View Page — A detailed data table with all records featuring search, sort, and pagination. Export filtered data to CSV for further analysis.

Data View
Looking for marketplace analytics across multiple platforms? Explore the Online Marketplaces Dashboard in Excel or the Amazon FBA Seller Dashboard in Power BI.
⚙️ How to Use the Etsy Seller Analytics Dashboard in HTML
1️⃣ Download and unzip the template file to your computer.
2️⃣ Open the index.html file in any modern browser (Chrome, Edge, Firefox, Safari).
3️⃣ Replace the sample data in the data file with your own Etsy shop data.
4️⃣ All charts, KPI cards, and filters update automatically — no coding needed.
5️⃣ Use slicers and filters to drill down into specific time periods, channels, or product categories.
👥 Who Can Benefit from This Etsy Seller Analytics Dashboard in HTML
🎯 Etsy shop owners who want to track revenue, orders, and traffic in one place.
🎯 E-commerce sellers managing multiple product categories on Etsy.
🎯 Digital product creators who need to monitor listing performance and conversion rates.
🎯 Business analysts tracking Etsy marketplace trends and profitability.
🎯 Freelancers running Etsy stores who need a simple, browser-based analytics tool.
❓ Frequently Asked Questions
What KPIs does the Etsy Seller Analytics Dashboard in HTML track?
The Etsy Seller Analytics Dashboard in HTML tracks 6 key performance indicators: Total Revenue, Total Orders, Avg Order Value, Total Views, Conversion Rate, and Total Favorites. It also includes 15+ charts across 5 dashboard pages covering sales, traffic, engagement, and profitability.
Do I need coding skills to use this HTML dashboard?
No. Simply download, unzip, and open index.html in any modern browser. Replace the sample data with your own Etsy shop data and all visualizations update automatically.
Can I export data from this Etsy dashboard?
Yes. The Data View page includes search, sort, and pagination features along with a CSV export option so you can download filtered data for further analysis.
What is the best HTML dashboard template for Etsy sellers?
The Etsy Seller Analytics Dashboard in HTML by NextGenTemplates is one of the most comprehensive Etsy analytics templates available, covering revenue, orders, traffic, engagement, costs, and profitability across 5 interactive pages with 6 KPI cards and 15+ charts.
Is this template compatible with all browsers?
Yes. This HTML dashboard works in all modern browsers including Google Chrome, Microsoft Edge, Mozilla Firefox, and Apple Safari on both desktop and mobile devices.
🔗 Explore Related Templates
📊 Etsy Seller Analytics Dashboard in Power BI — The same Etsy analytics in an interactive Power BI format with advanced filtering and drill-through capabilities.
📊 Etsy Seller Analytics Dashboard in Excel — Track your Etsy shop performance using Microsoft Excel with pivot tables and dynamic charts.
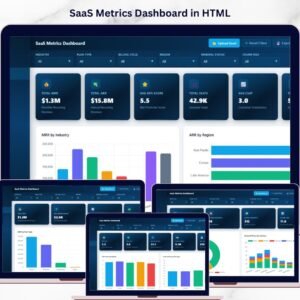
📊 SaaS Metrics Dashboard in HTML — A browser-based analytics dashboard for SaaS businesses tracking MRR, churn, and customer metrics.
📖 Click here to read the Detailed Blog Post
Watch the step-by-step video tutorial:


Reviews
There are no reviews yet.