Sustainability is no longer a “nice-to-have” initiative. Today, investors, regulators, customers, and employees expect organizations to prove ESG performance with data. However, many companies still struggle because ESG data remains scattered across Excel files, emails, and disconnected systems. As a result, reporting becomes slow, inconsistent, and difficult to audit.
That is exactly why the ESG (Environmental, Social, and Governance) KPI Dashboard in Power BI becomes a mission-critical solution 🚀.
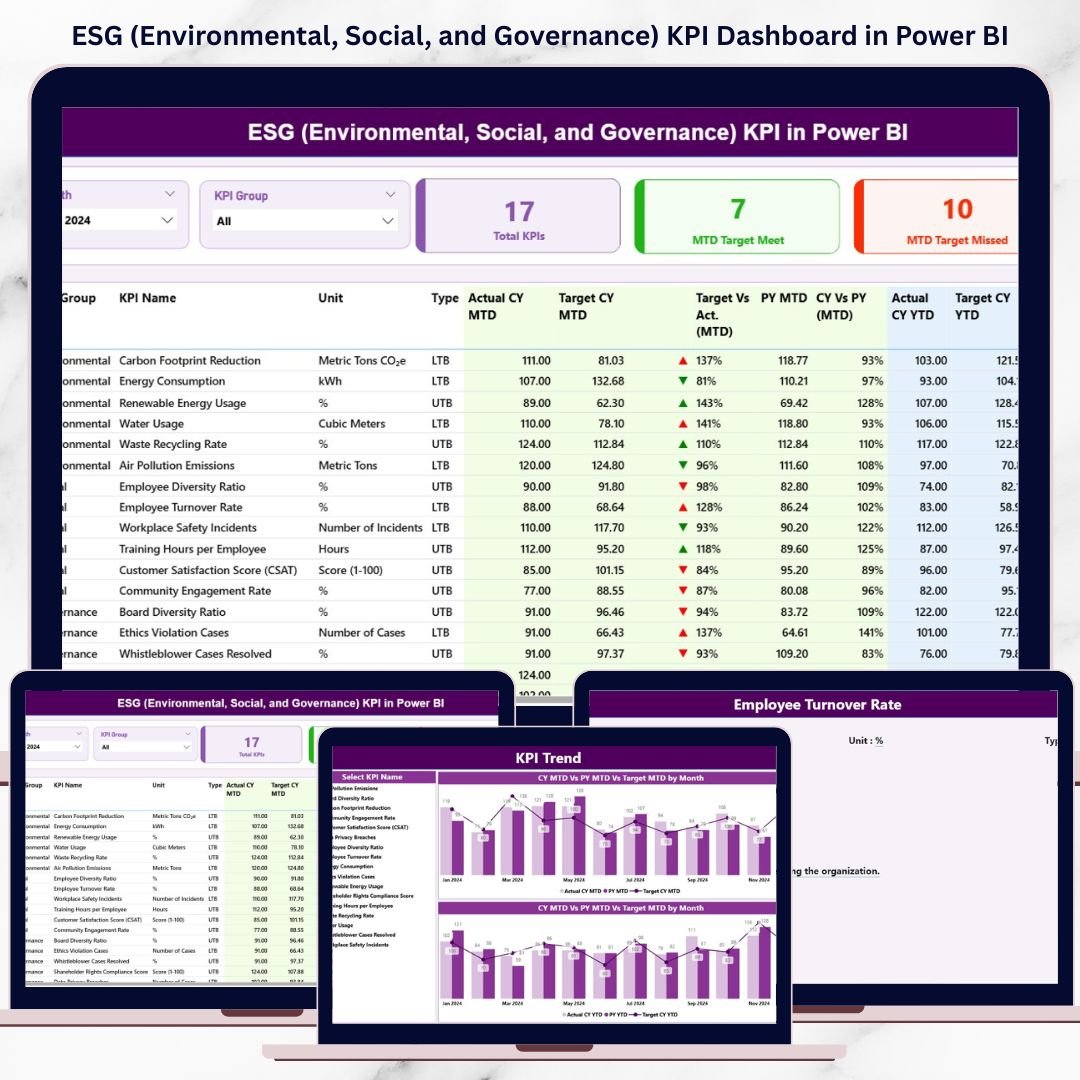
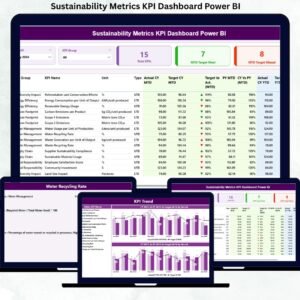
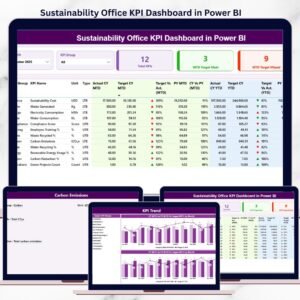
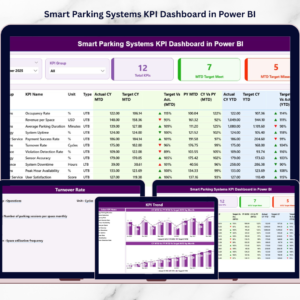
This ready-to-use Power BI dashboard transforms ESG goals into clear, measurable, and trackable KPIs. Instead of relying on qualitative statements or manual reports, organizations can monitor ESG performance through interactive visuals, KPI tables, icons, and trend charts—all in one centralized dashboard.
Because the dashboard uses Excel as its data source and Power BI for analytics, it offers the perfect balance of simplicity and analytical power. ESG teams can update data easily, while leadership gains real-time visibility into sustainability performance.
Whether your organization focuses on compliance, investor reporting, internal sustainability tracking, or long-term ESG strategy, this dashboard helps you move from static ESG reporting to data-driven ESG management.
🔑 Key Features of ESG (Environmental, Social, and Governance) KPI Dashboard in Power BI
🌍 Centralized ESG Performance Tracking – Environmental, Social, and Governance KPIs in one dashboard
📊 MTD & YTD ESG Monitoring – Track short-term progress and long-term sustainability trends
🎯 Target vs Actual Comparison – Instantly identify ESG gaps and achievements
🚦 Visual Status Indicators (▲▼) – Quickly see KPIs met or missed
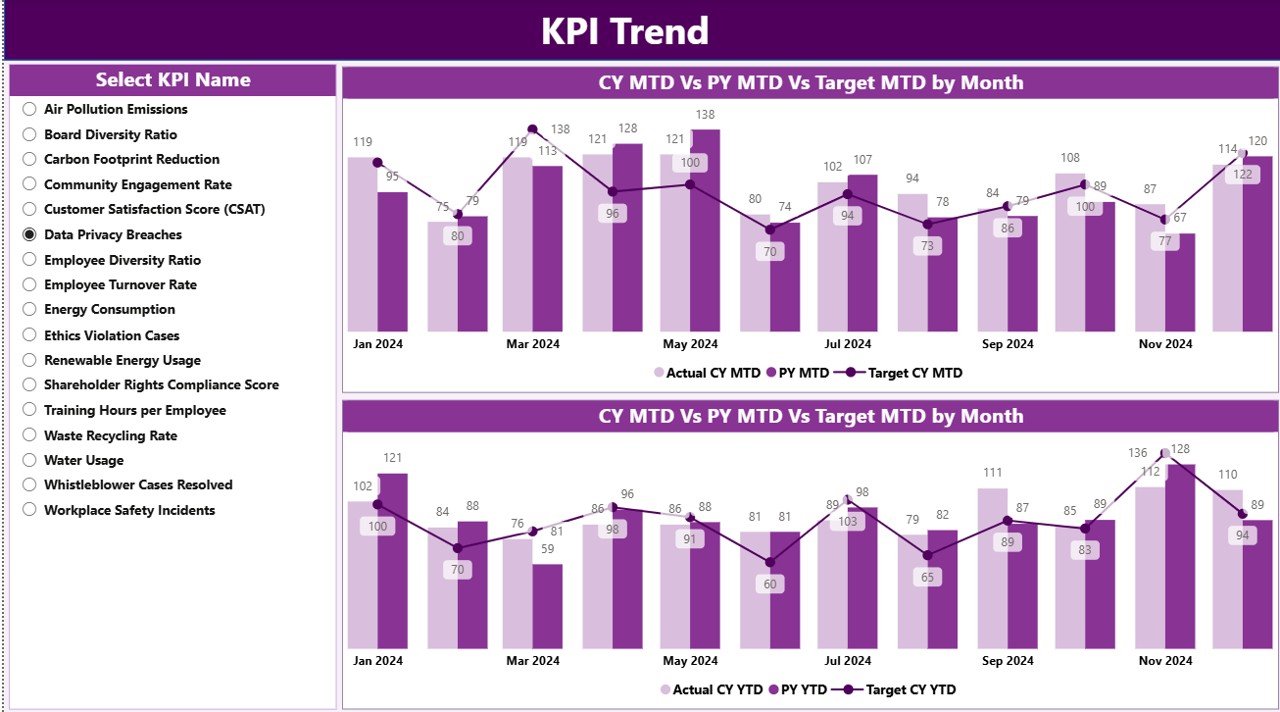
📈 Trend Analysis with CY vs PY Comparison – Measure improvement over time
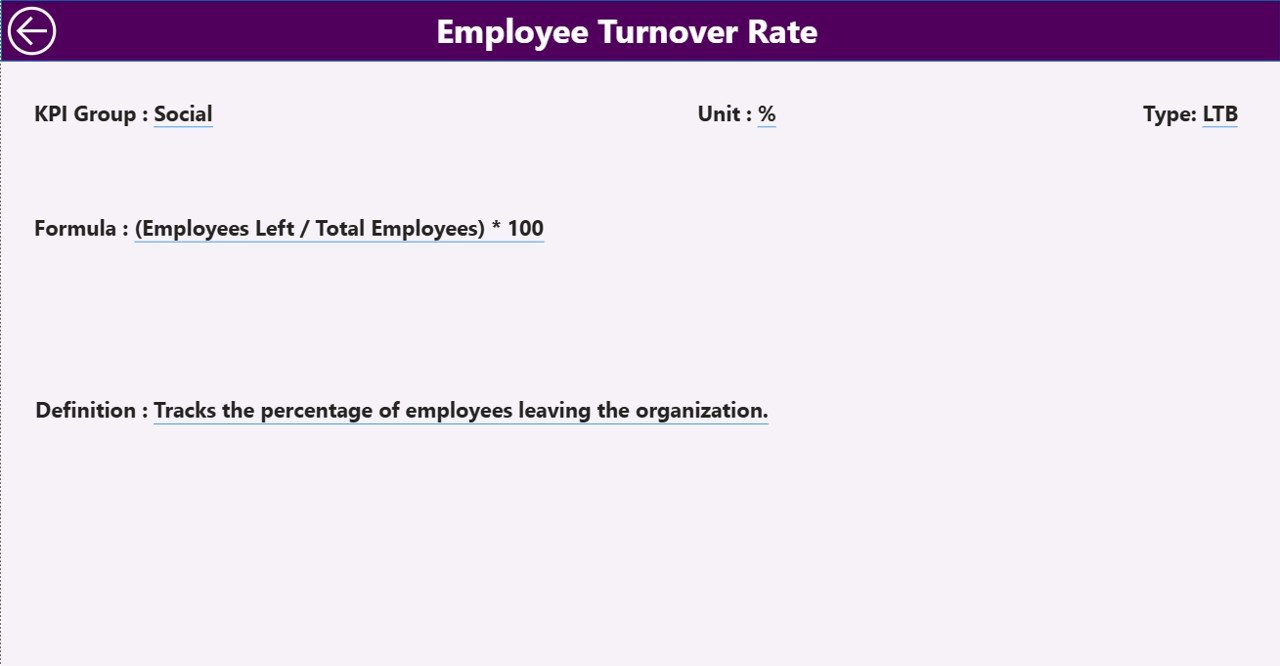
🔍 Drill-Through KPI Definitions – Full transparency for formulas and logic
🧩 Excel-Based Data Input – Easy updates without complex integrations
⚡ Interactive Power BI Visuals – Fast, reliable, and executive-ready reporting
📂 What’s Inside the ESG KPI Dashboard in Power BI
This digital product includes three professionally designed analytical pages, each serving a specific ESG reporting purpose:
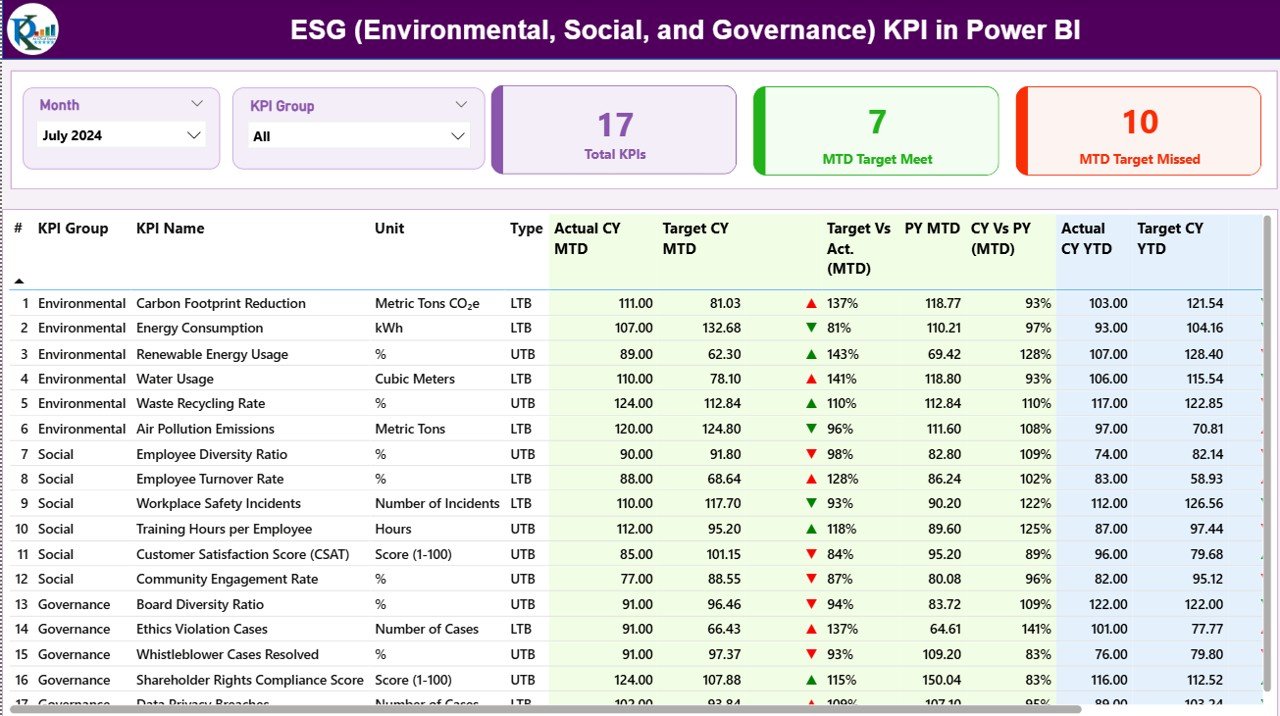
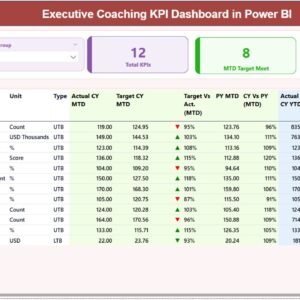
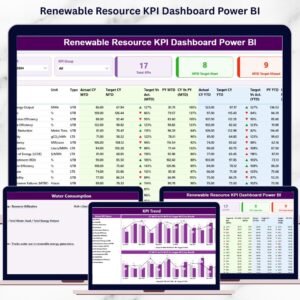
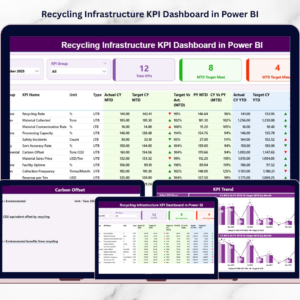
📌 Summary Page – Executive-level ESG overview with slicers, KPI cards, and a detailed KPI performance table
📌 KPI Trend Page – Combo charts comparing MTD and YTD performance across Current Year, Previous Year, and Targets
📌 KPI Definition Page – Drill-through reference page showing KPI unit, formula, definition, and LTB/UTB logic
The dashboard connects to three structured Excel worksheets:
-
Input_Actual – Actual ESG performance values
-
Input_Target – ESG target benchmarks
-
KPI Definition – Governance layer for KPI clarity
Once updated, Power BI refreshes all insights automatically.
🛠️ How to Use the ESG KPI Dashboard in Power BI
Using this dashboard is straightforward and business-friendly:
1️⃣ Update ESG actual values in the Input_Actual Excel sheet
2️⃣ Enter ESG targets in the Input_Target sheet
3️⃣ Maintain KPI logic in the KPI Definition sheet
4️⃣ Refresh the Power BI dashboard
5️⃣ Use slicers to filter by Month and KPI Group (E, S, or G)
6️⃣ Review KPI cards and performance table
7️⃣ Analyze trends and drill into KPI definitions
No complex Power BI development required—just structured ESG insights.
👥 Who Can Benefit from This ESG KPI Dashboard in Power BI
This dashboard is ideal for:
🌱 ESG & Sustainability Teams – Monitor progress against sustainability goals
📊 Compliance & Risk Teams – Support regulatory and audit requirements
💼 CFOs & Finance Leaders – Integrate ESG into enterprise performance reviews
📈 Investors & Strategy Teams – Evaluate ESG maturity and progress
🏢 Corporate Leadership – Drive accountability and transparency
📑 ESG Consultants & Advisors – Deliver professional ESG reporting
It adapts easily across industries and organizational sizes.


Reviews
There are no reviews yet.