Struggling to Control ERP Consulting Performance? It’s Time to Upgrade to Real-Time Intelligence 🚀
ERP consulting firms operate in a high-pressure environment. Projects must stay on schedule. Clients demand measurable value. Meanwhile, leadership must monitor revenue, utilization, margins, and delivery performance — all at once.
If you still rely on scattered Excel reports, you are reacting late.
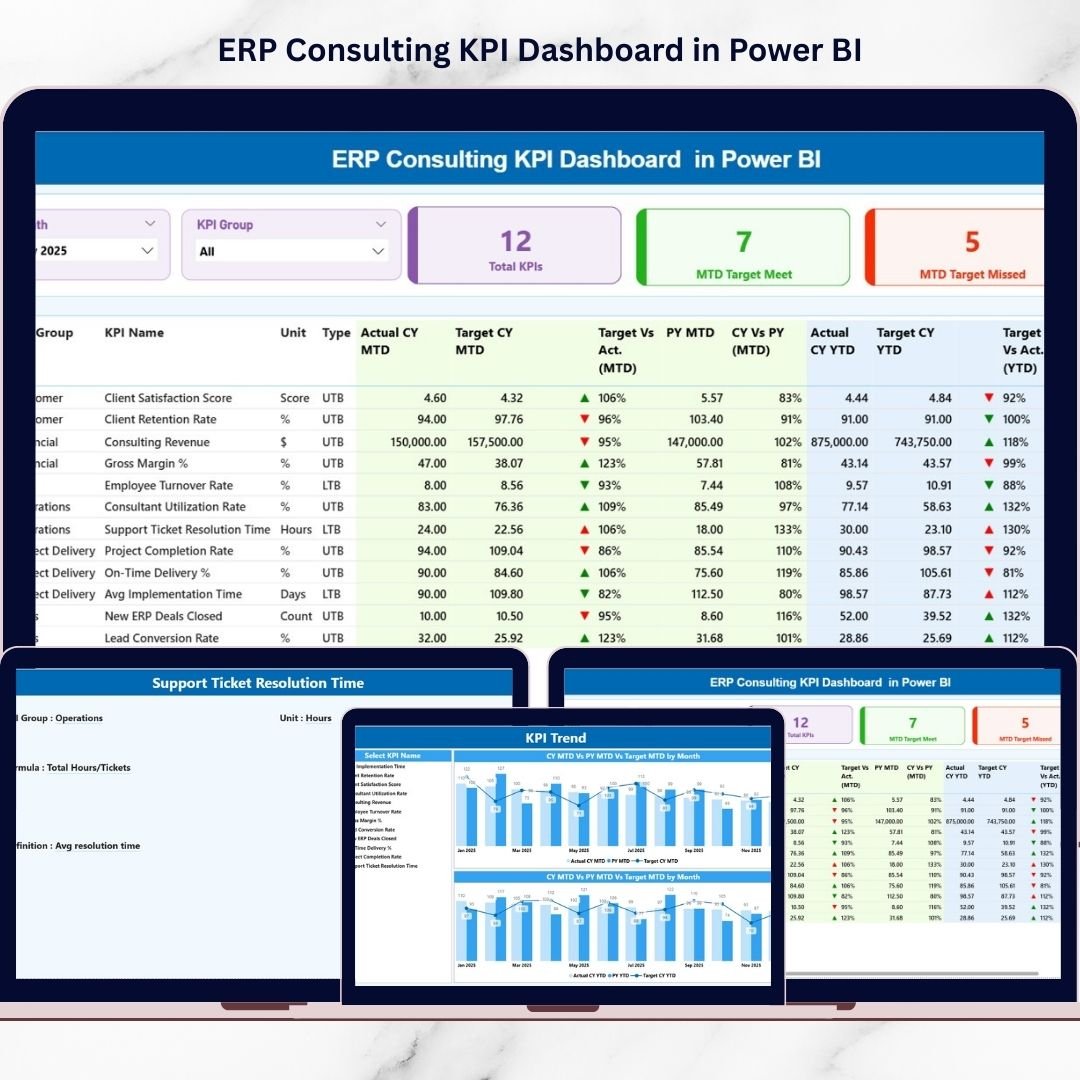
The ERP Consulting KPI Dashboard in Power BI gives you a centralized, interactive, and intelligent reporting system designed specifically for ERP consulting firms.
This ready-to-use Power BI dashboard transforms structured Excel data into dynamic visuals, powerful comparisons, and actionable insights. Instead of reviewing static numbers, you analyze performance in real time.
No guesswork. No delays. Just clarity.
Key Feature of ERP Consulting KPI Dashboard in Power BI 📊
This dashboard includes 3 powerful and structured pages inside Power BI Desktop:
✅ Executive Summary Page – Instant KPI visibility with slicers and performance cards.
✅ MTD & YTD Analysis – Track short-term and long-term progress simultaneously.
✅ Target vs Actual Tracking – Identify performance gaps instantly.
✅ Current Year vs Previous Year Comparison – Measure true business growth.
✅ KPI Group & Month Slicers – Filter insights in seconds.
✅ Visual Performance Icons – ▲ Green for strong performance, ▼ Red for underperformance.
✅ Drill-Through Capability – View KPI formulas and definitions instantly.
✅ Interactive Combo Charts – Compare Actual, Target, and Previous Year visually.
Because Power BI provides advanced visualization and filtering, you gain deeper insights compared to traditional reporting.
What’s Inside the ERP Consulting KPI Dashboard in Power BI 📁
You receive a fully structured Power BI file connected to a clean Excel data source.
📌 1️⃣ Summary Page – Executive Control Center
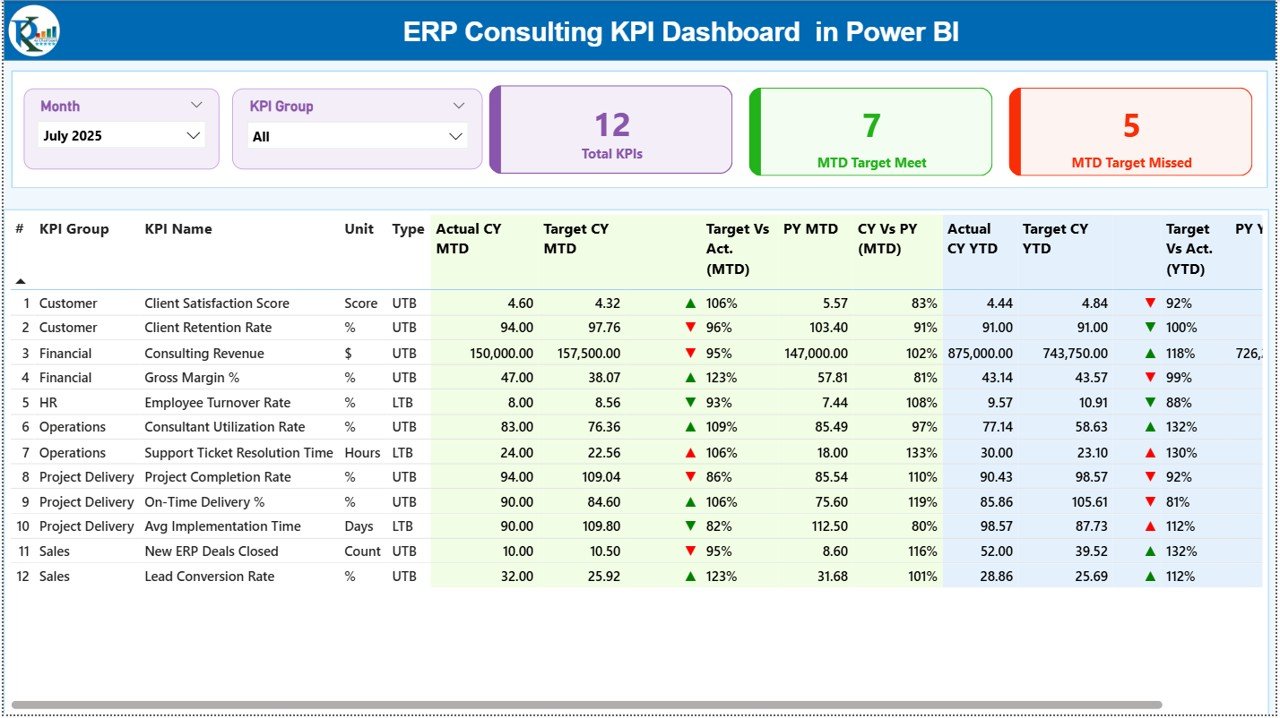
At the top:
-
Month slicer
-
KPI Group slicer
Below that:
-
Total KPI Count Card
-
MTD Target Meet Count
-
MTD Target Missed Count
The detailed KPI table shows:
MTD Section:
-
Actual CY MTD
-
Target CY MTD
-
Target vs Actual %
-
Previous Year MTD
-
CY vs PY %
-
Performance Icon
YTD Section:
-
Actual CY YTD
-
Target CY YTD
-
Target vs Actual %
-
Previous Year YTD
-
CY vs PY %
-
Performance Icon
Everything appears in one consolidated view.
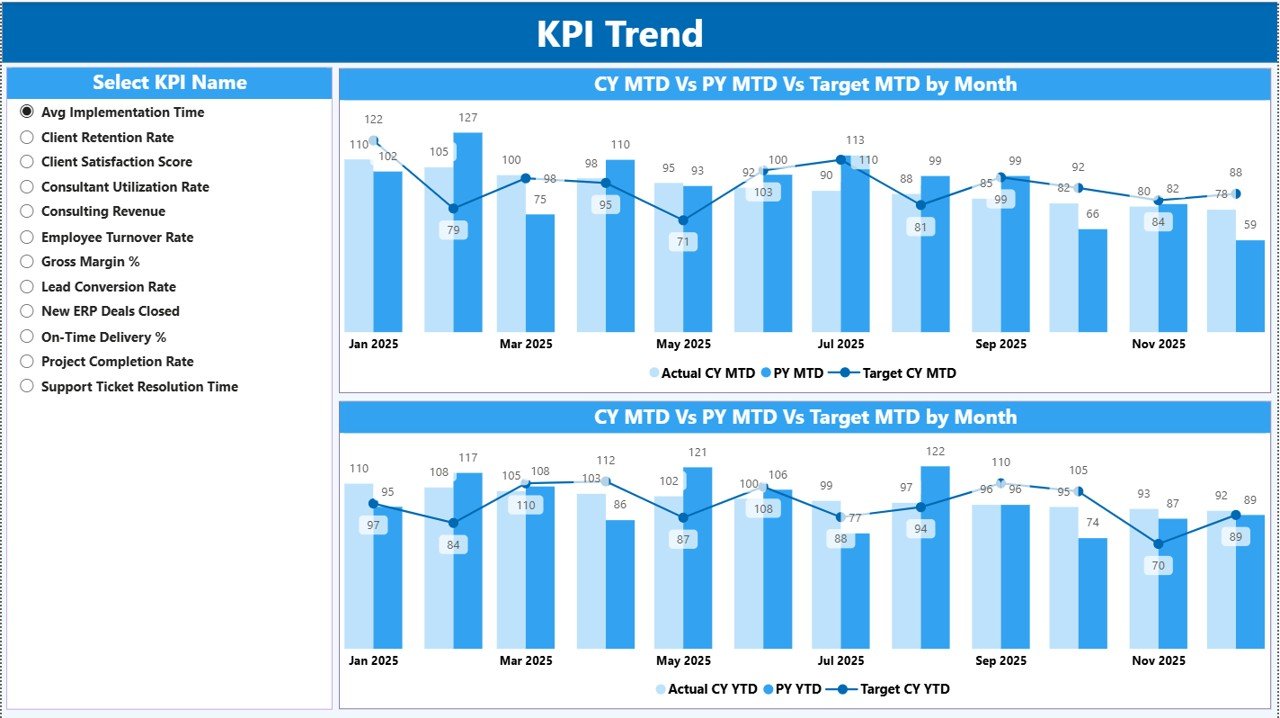
📈 2️⃣ KPI Trend Page – Deep Performance Analysis
Select any KPI using slicer and instantly view:
-
MTD Combo Chart (Actual vs Target vs PY)
-
YTD Combo Chart (Actual vs Target vs PY)
Because the charts update dynamically, trend analysis becomes simple and visual.
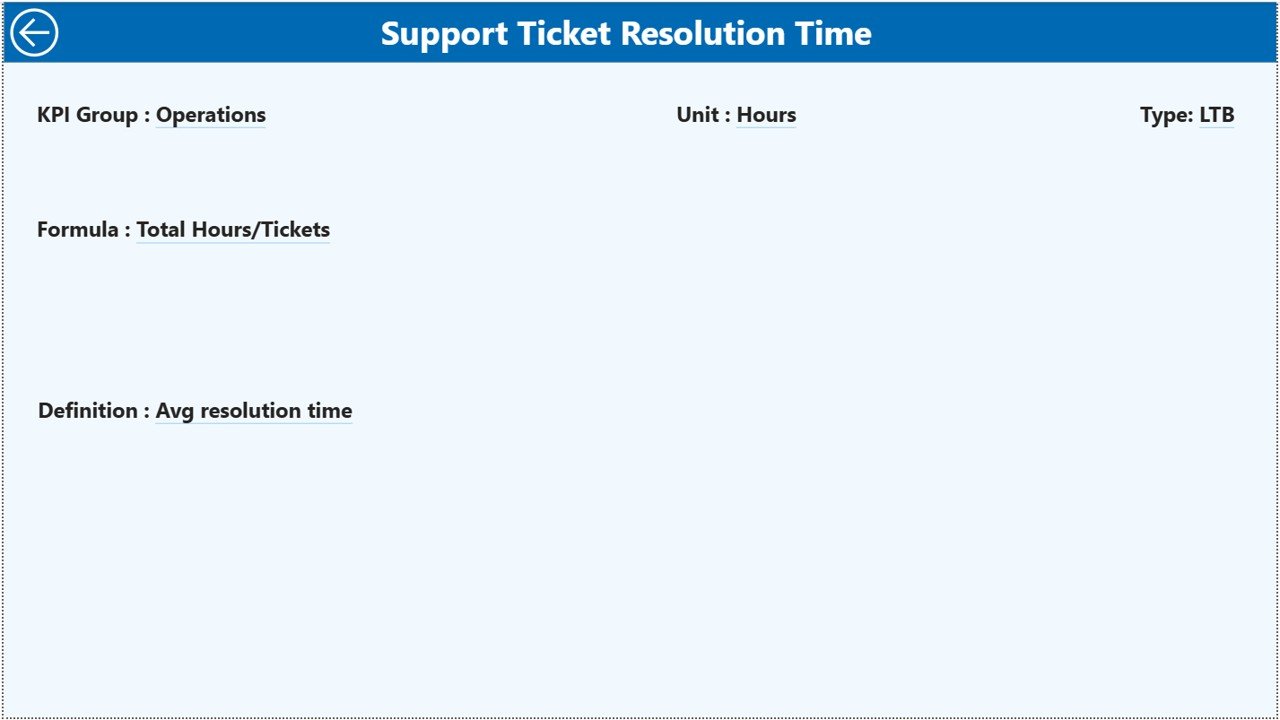
📘 3️⃣ KPI Definition Page – Drill-Through Intelligence
From Summary Page, drill through any KPI to see:
-
KPI Formula
-
KPI Definition
-
KPI Group
-
KPI Type (LTB / UTB)
This ensures transparency and consistency across teams.
📊 Excel Data Source Structure
The dashboard connects to an Excel file with:
1️⃣ Input_Actual Sheet
Enter KPI Name, Month, MTD, YTD.
2️⃣ Input_Target Sheet
Enter KPI Name, Month, MTD Target, YTD Target.
3️⃣ KPI Definition Sheet
Enter KPI Number, Group, Name, Unit, Formula, Definition, Type.
After data refresh, Power BI updates automatically.
How to Use the ERP Consulting KPI Dashboard in Power BI ⚙️
Step 1: Define KPIs Clearly
Enter KPIs aligned with financial, operational, client, and quality metrics.
Step 2: Update Excel Data
Input Actual and Target numbers monthly.
Step 3: Refresh Power BI
Click refresh to update visuals instantly.
Step 4: Filter & Analyze
Use Month and KPI Group slicers.
Step 5: Drill Through for Clarity
Understand KPI logic behind numbers.
Within minutes, you move from reactive management to proactive leadership.
Who Can Benefit from This ERP Consulting KPI Dashboard in Power BI 👥
This dashboard is perfect for:
✔ ERP Consulting Firm Owners
✔ Project & Delivery Managers
✔ Finance Heads
✔ Operations Leaders
✔ Strategy Consultants
✔ Business Intelligence Teams
If your goal is to increase utilization, protect margins, deliver projects on time, and strengthen client satisfaction — this dashboard is built for you.
Why This Dashboard Increases Profitability 💰
It helps you:
🔹 Improve consultant utilization
🔹 Reduce cost overruns
🔹 Monitor billing efficiency
🔹 Control project profitability
🔹 Identify performance decline early
🔹 Align teams with measurable targets
Because performance gaps become visible immediately, corrective action becomes faster.
Instead of reviewing outdated spreadsheets, you lead with real-time intelligence.
If you want scalable reporting, structured KPI tracking, and professional Power BI presentation — this ERP Consulting KPI Dashboard is your competitive advantage.
Click here to read the Detailed blog post
Visit our YouTube channel to learn step-by-step video tutorials
👉 Youtube.com/@PKAnExcelExpert


