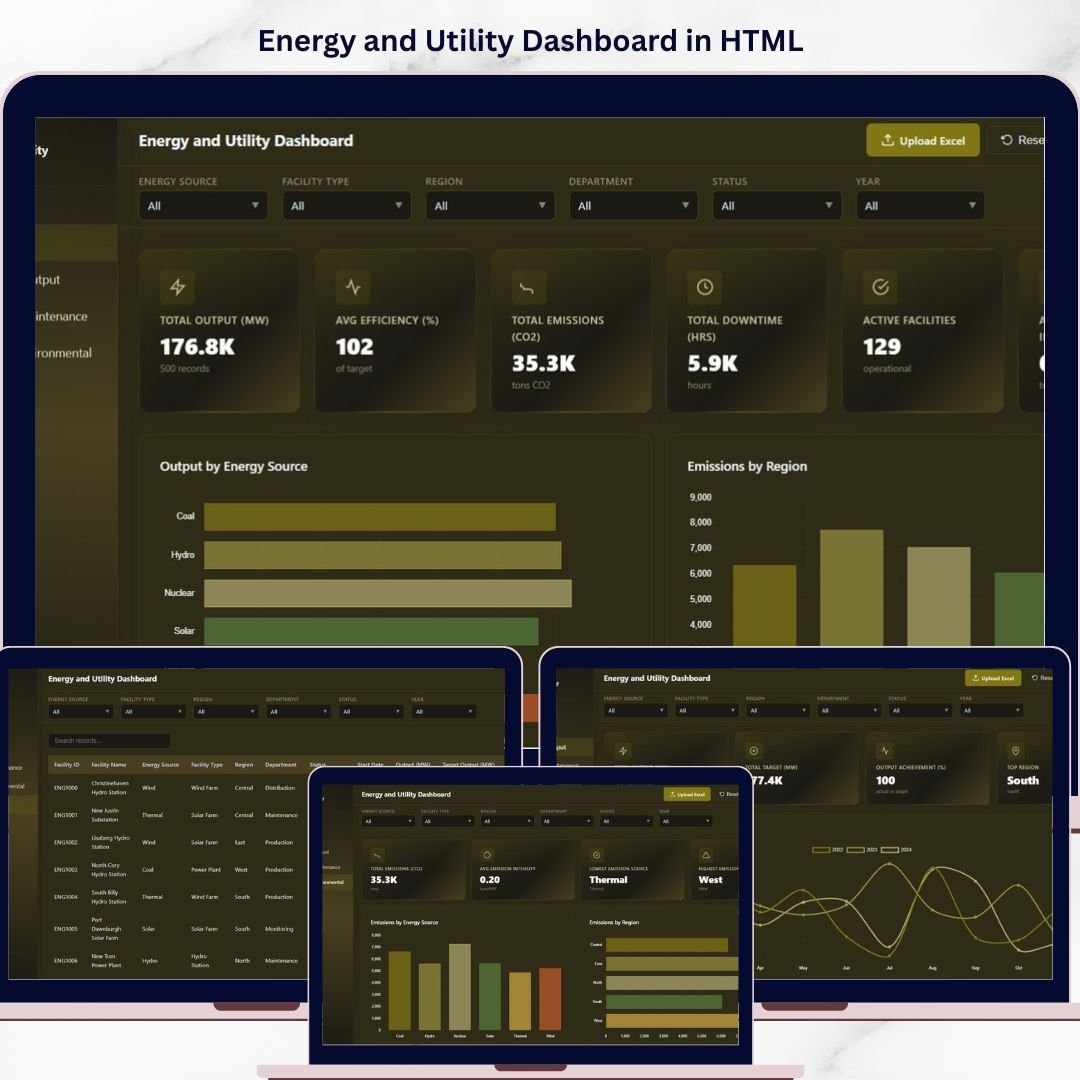

Energy and Utility Dashboard in HTML is a feature-rich, browser-based analytics tool designed to help energy companies, utility providers, facility managers, and sustainability professionals track power output, emissions, efficiency, and downtime — all from one centralized, interactive interface. Whether you manage a single power plant or oversee a network of facilities across multiple regions, this ready-to-use HTML dashboard converts complex operational data into clear, actionable visual insights that drive smarter decision-making.
Built with modern web technologies and responsive chart libraries, this dashboard delivers a premium SaaS-like experience right in your browser. Upload your own Excel data file, apply dynamic filters, and explore performance metrics across five dedicated analysis pages instantly. No software installation is required — simply open the HTML file and start analyzing your energy and utility operations today!
🔑 Key Features of the Energy and Utility Dashboard in HTML
📌 Multi-Page Interactive Analytics – Navigate seamlessly between Overview, Production and Output Analysis, Downtime and Maintenance, Emissions and Environmental, and Data View pages using a modern sidebar layout.
📊 Dynamic KPI Cards – Instantly view Total Output (MW), Avg Efficiency (%), Total Emissions (tons CO2), Total Downtime (hrs), Active Facilities, and Avg Emission Intensity at the top of the overview page for a quick operational snapshot.
🎛️ Global Filters and Slicers – Apply multiple slicers to filter the entire dashboard by region, energy source, facility type, department, and more to see filtered results across all analysis pages quickly.
📈 Rich Chart Visualizations – Explore interactive bar charts, line trends, donut charts, and grouped comparisons that update dynamically based on your filter selections across every page.
🌗 Light and Dark Theme Toggle – Switch seamlessly between light and dark modes for comfortable viewing in any work environment.
📤 Excel File Upload – Replace demo data with your own energy and utility data by uploading an Excel file directly into the dashboard for instant analysis.
📥 CSV Export – Export your filtered data to CSV format from the Data View page for external reporting or further analysis.
🔍 Search, Sort, and Pagination – The Data View page includes powerful search, column sorting, and pagination features to manage large datasets with ease.
📦 What’s Inside the Energy and Utility Dashboard in HTML
📍 Overview Page – High-level KPI cards showing Total Output (MW), Avg Efficiency (%), Total Emissions (tons CO2), Total Downtime (hrs), Active Facilities, and Avg Emission Intensity. Interactive charts display Output by Energy Source, Emissions by Region, Facility Count by Status, Output vs Target by Facility Type, and Efficiency by Department for a comprehensive operational summary. 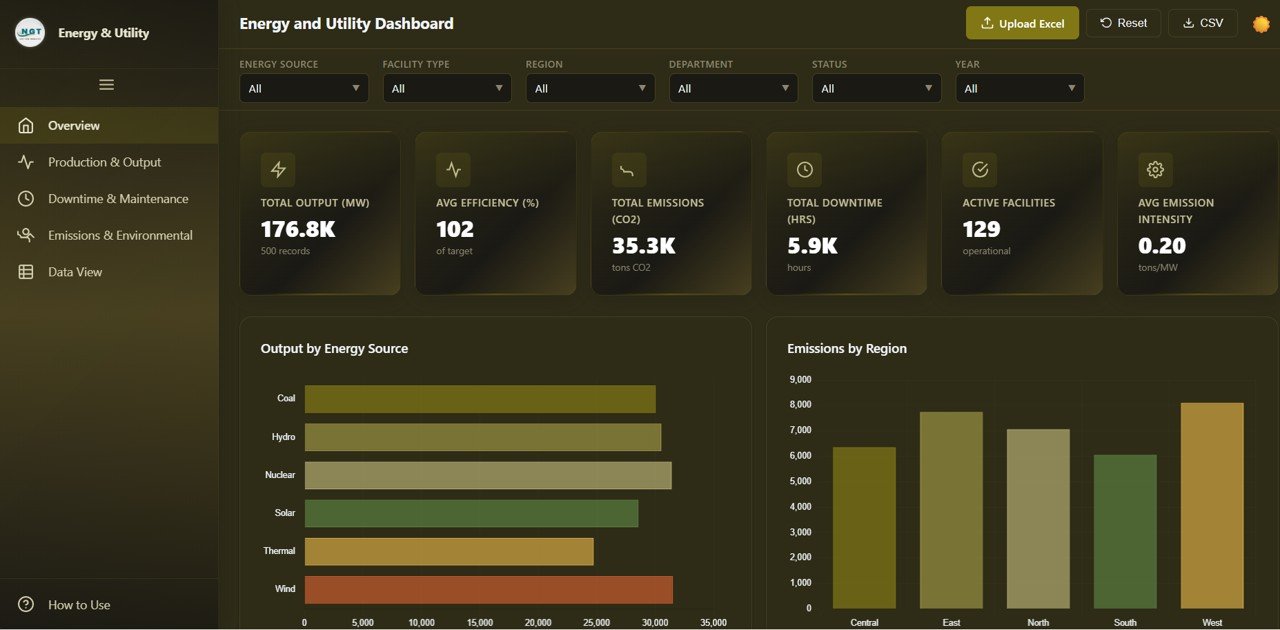
📍 Production and Output Analysis – Dedicated page with Monthly Output Trend by Year, Output by Region, Output by Facility Type, Top 10 Facilities by Output, and Output Achievement by Energy Source to monitor and optimize energy generation performance.
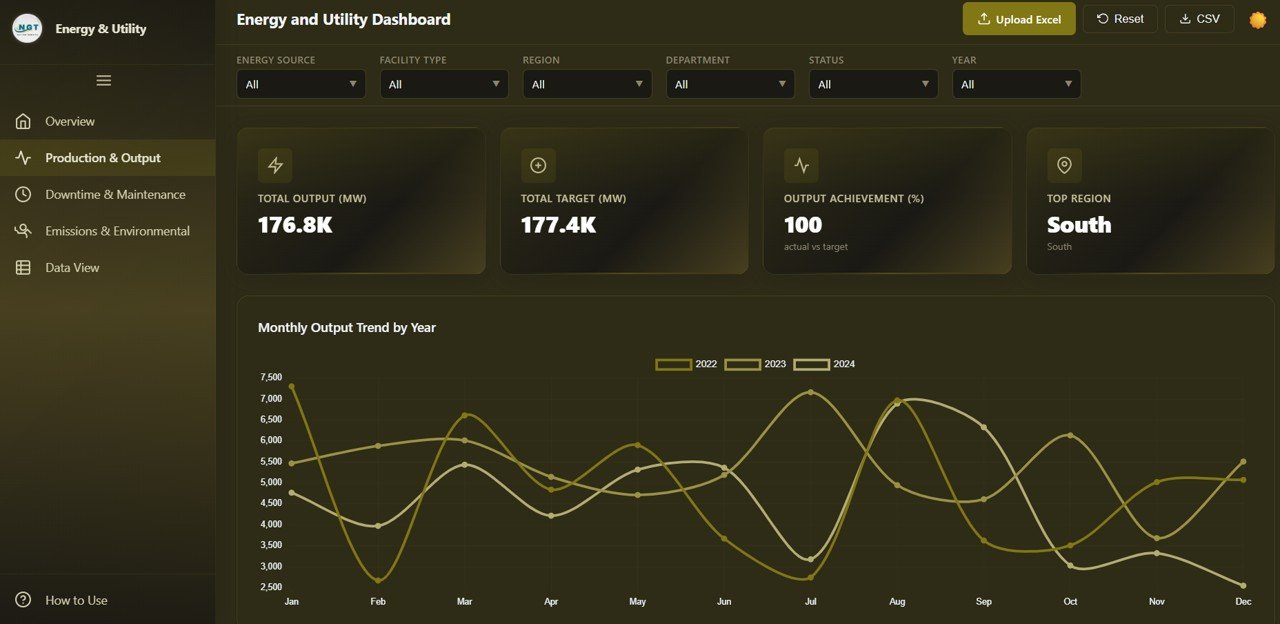
Production and Output Analysis
📍 Downtime and Maintenance – Analyze facility downtime using Downtime by Energy Source, Downtime by Region, Monthly Downtime Trend, Status Distribution, and Downtime by Department to identify patterns and minimize operational disruptions.
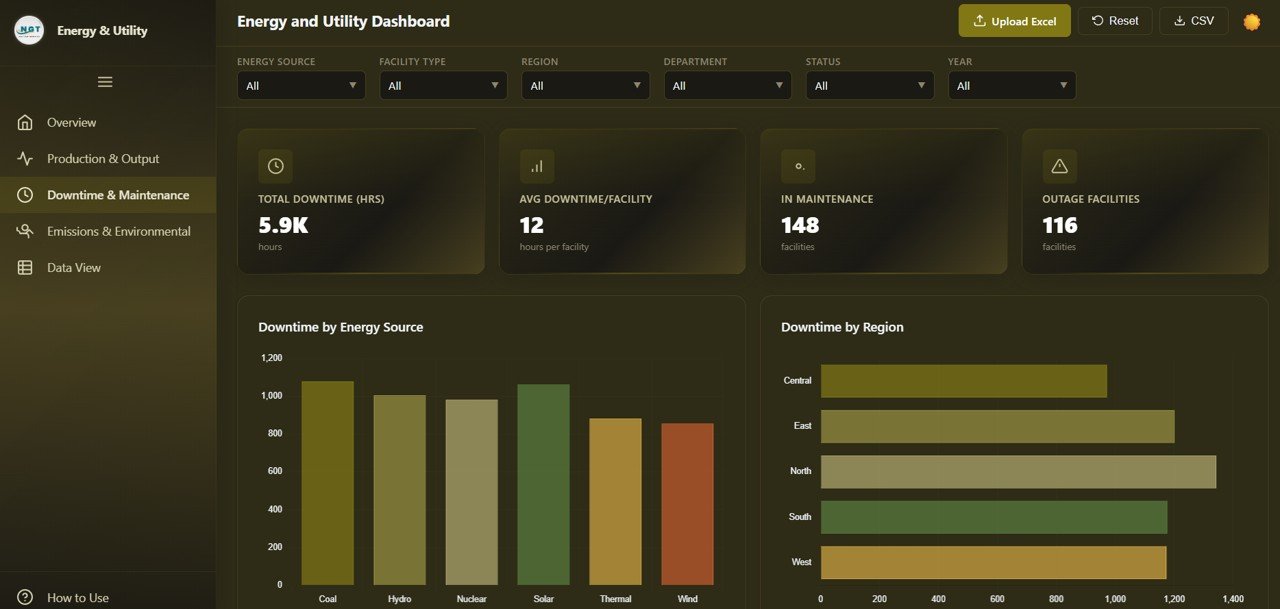
Downtime and Maintenance
📍 Emissions and Environmental – Track environmental impact through Emissions by Energy Source, Emissions by Region, Monthly Emissions Trend, Emission Intensity by Facility Type, and Emissions vs Output for data-driven sustainability reporting.
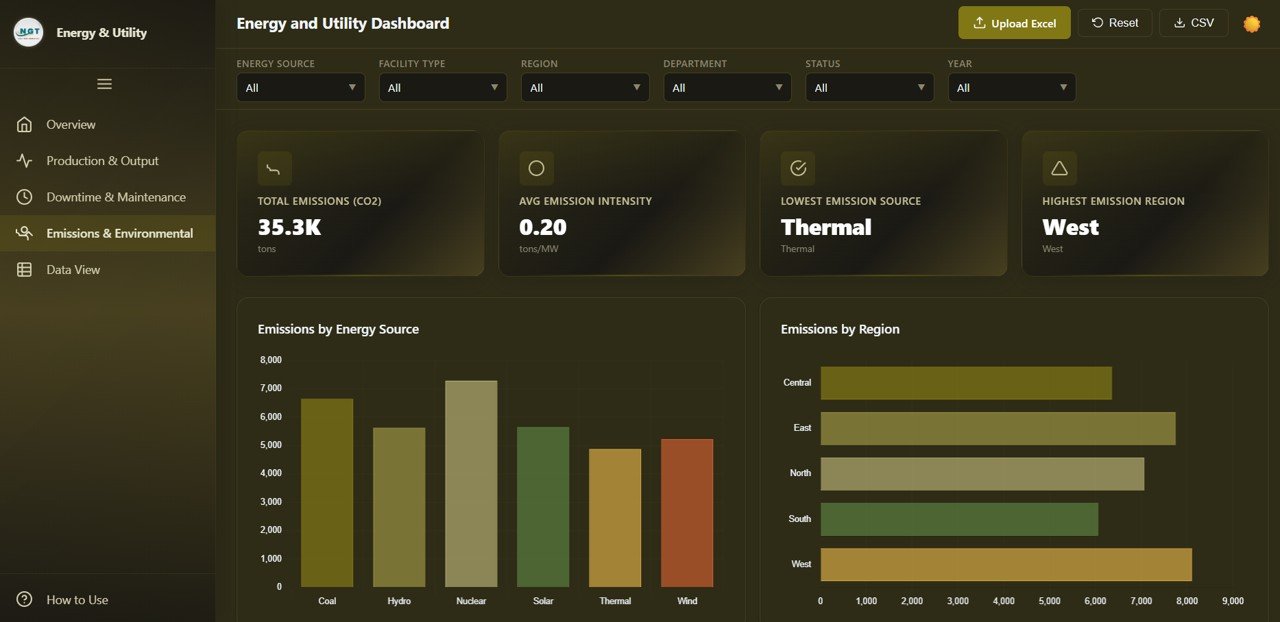
Emissions and Environmental
📍 Data View – A detailed data table page where you can see all records with search, sort, and pagination features. Export the filtered data to CSV for external use or compliance documentation.
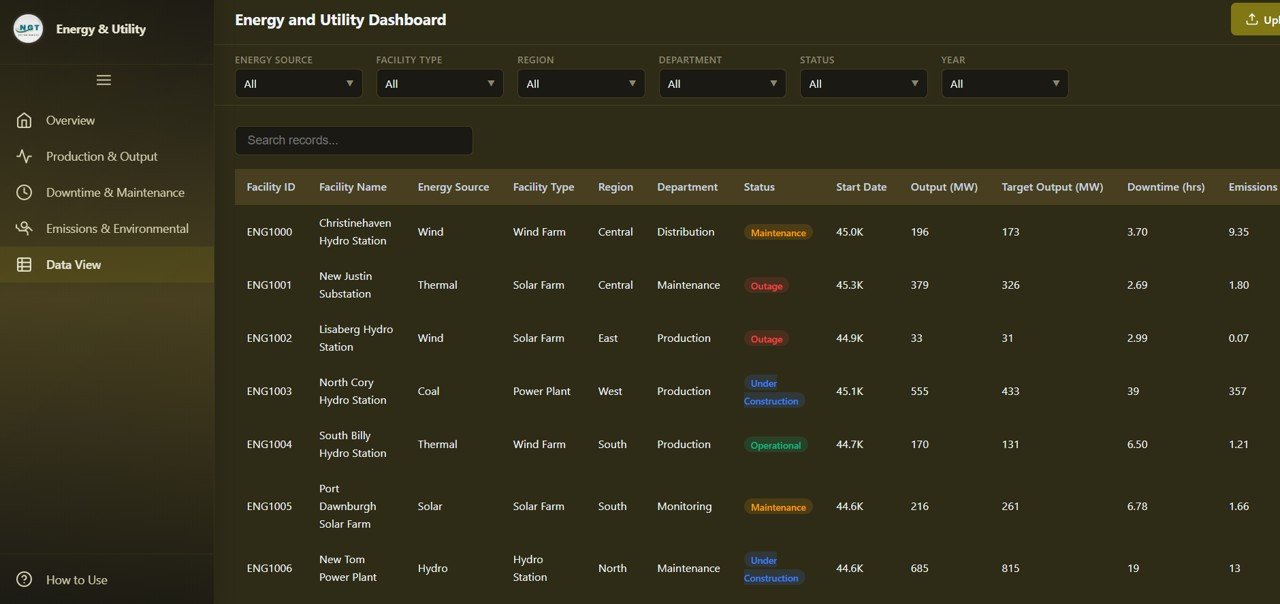
Data View
⚙️ How to Use the Energy and Utility Dashboard in HTML
1️⃣ Download the ZIP file and extract the contents to any folder on your computer.
2️⃣ Open the HTML file in any modern browser such as Google Chrome, Microsoft Edge, or Firefox.
3️⃣ Explore the demo data already loaded into the dashboard to understand the layout and available analysis pages.
4️⃣ Replace the sample data by uploading your own Excel file using the built-in file upload feature.
5️⃣ Apply filters and slicers to narrow down results by region, energy source, facility type, department, or other dimensions.
6️⃣ Navigate between all five pages to explore different analysis perspectives — from high-level KPIs to granular data records.
7️⃣ Export filtered data to CSV from the Data View page for presentations, reports, or further processing.
👥 Who Can Benefit from This Energy and Utility Dashboard
⚡ Energy Company Managers – Monitor power output, facility performance, and departmental efficiency across all operations.
🏭 Utility Providers – Track generation targets, downtime trends, and maintenance patterns across facilities and regions.
🌿 Sustainability Officers – Analyze emissions by source and region, track emission intensity, and prepare environmental compliance reports.
📋 Operations Analysts – Explore detailed production data, identify top-performing facilities, and benchmark output achievement against targets.
🏢 Facility Managers – Track downtime and maintenance patterns by department and region to optimize scheduling and reduce unplanned outages.
🎓 Students and Researchers – Use the interactive HTML dashboard for academic projects, energy sector case studies, or data visualization practice.
📖 Click here to read the Detailed Blog Post about the Energy and Utility Dashboard in HTML
🎥 Visit our YouTube channel to learn step-by-step video tutorials
👉 YouTube.com/@NextGenTemplates
Watch the step-by-step video tutorial:
YouTube


Reviews
There are no reviews yet.