Electricity suppliers and energy companies manage hundreds or even thousands of electricity supply contracts with businesses, industries, and government organizations. Each contract includes complex financial components such as revenue agreements, operational costs, risk levels, and payment schedules. Managing these contracts manually using scattered spreadsheets or reports often leads to confusion, delayed insights, and inefficient decision-making.
The Electricity Contract Dashboard in Power BI solves this challenge by converting complex contract data into clear, interactive visual insights. This ready-to-use analytics dashboard enables organizations to monitor electricity contract performance, evaluate financial metrics, track payment delays, and identify high-risk contracts in one centralized platform.
Built with Power BI’s powerful data visualization capabilities, the dashboard allows decision-makers to explore contract data through dynamic charts, KPI indicators, and interactive filters. Instead of reviewing multiple reports, managers can instantly analyze revenue trends, cost patterns, and profitability across different contract types, sectors, and regions.
The dashboard also enables companies to monitor profit margins, outstanding payments, and operational risks, helping them make faster and more informed decisions.
Whether you manage electricity supply agreements, energy trading contracts, or utility service agreements, this Power BI dashboard provides the analytical visibility required to optimize contract performance and improve financial outcomes.
⚡ Key Feature of Electricity Contract Dashboard in Power BI
📊 Centralized Contract Analytics
Monitor all electricity contract data in one interactive Power BI dashboard.
💰 Financial Performance Monitoring
Track important metrics such as Total Revenue, Total Cost, Profit, and Profit Margin %.
⚠️ Risk Monitoring System
Identify high-risk contracts and evaluate potential financial exposure.
📈 Interactive KPI Indicators
Visual KPI cards provide an instant snapshot of overall contract performance.
🌍 Regional Performance Insights
Analyze revenue, costs, and payment delays across different geographic regions.
📊 Contract Type Performance Analysis
Understand which contract structures generate the highest profitability.
📅 Monthly Financial Trend Analysis
Track revenue growth, cost patterns, and profitability trends over time.
⚡ Power BI Interactive Filters
Use slicers to analyze contract data by contract type, sector, region, or sales manager.
📦 What’s Inside the Electricity Contract Dashboard in Power BI
This ready-to-use Power BI dashboard includes five powerful analytical pages designed to provide complete electricity contract insights.
Overview Page
The main monitoring dashboard that provides a summary of contract performance.
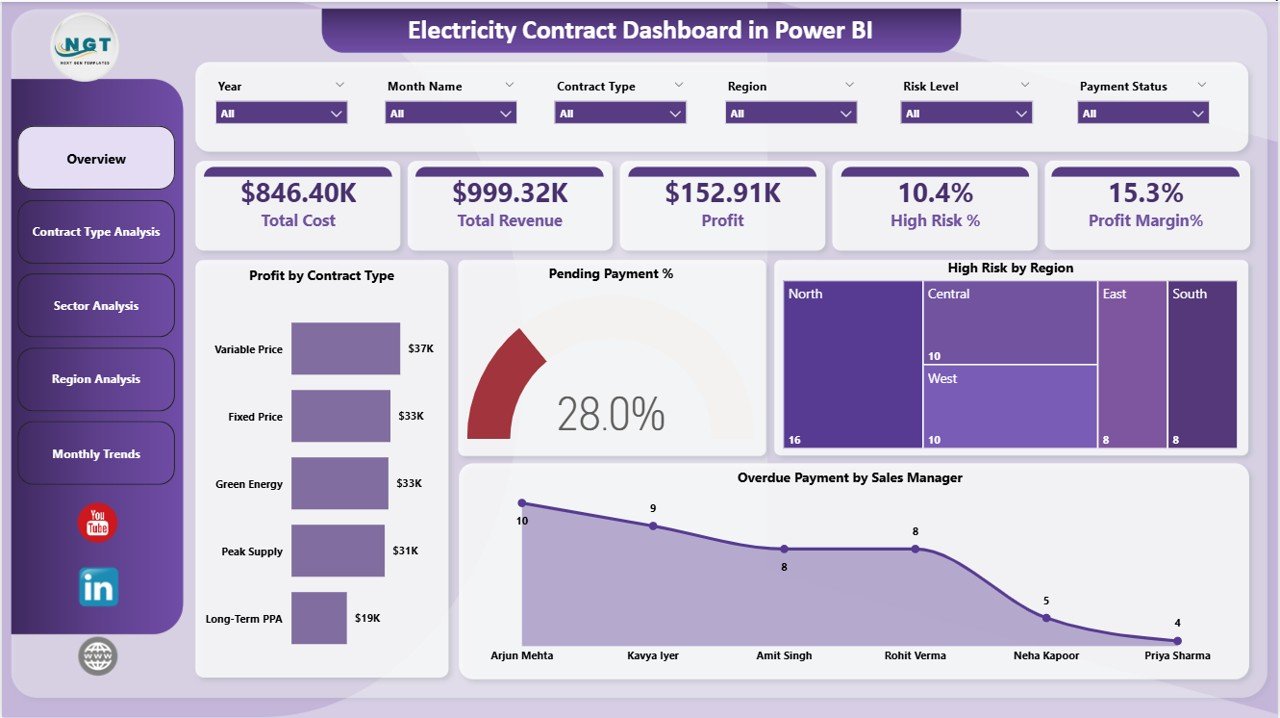
This page includes important KPI indicators such as:
Total Cost
Total Revenue
Profit
High Risk %
Profit Margin %
It also includes analytical charts such as Profit by Contract Type, Pending Payment %, High Risk by Region, and Overdue Payment by Sales Manager.
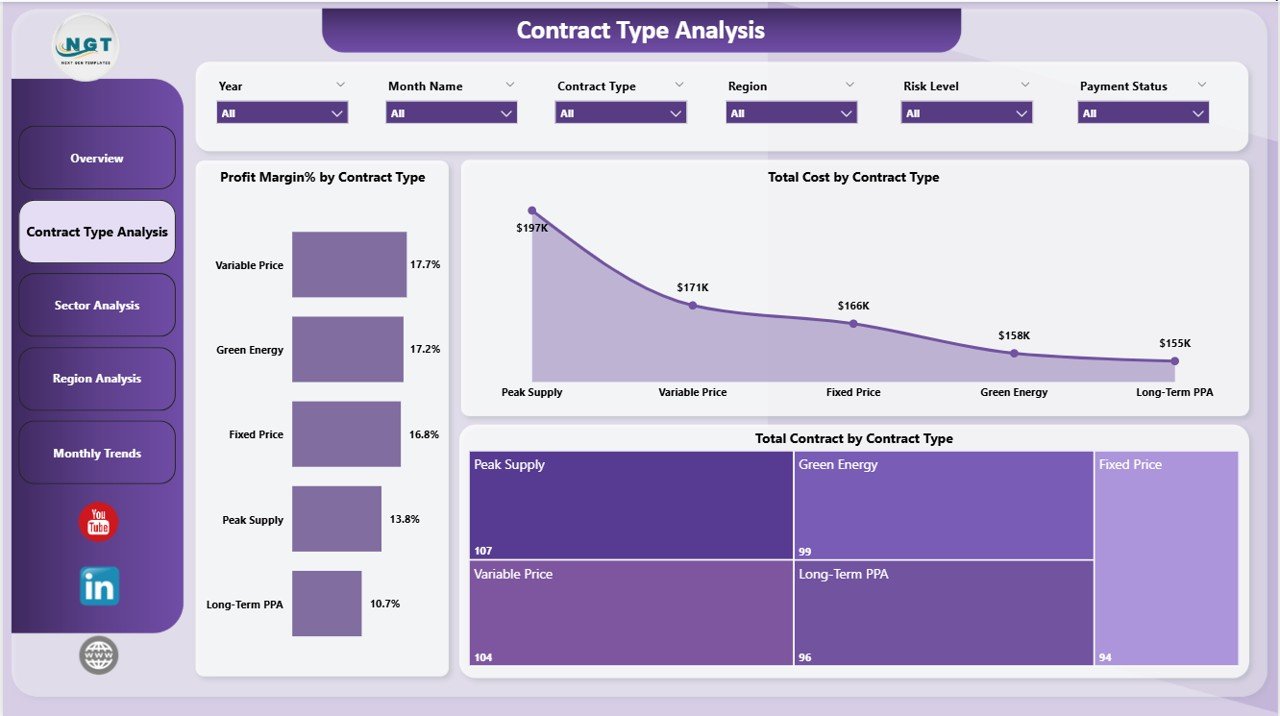
Contract Type Analysis Page
Analyzes financial performance across different electricity contract types.
Users can view charts such as Profit Margin % by Contract Type, Total Cost by Contract Type, and Total Contracts by Contract Type.
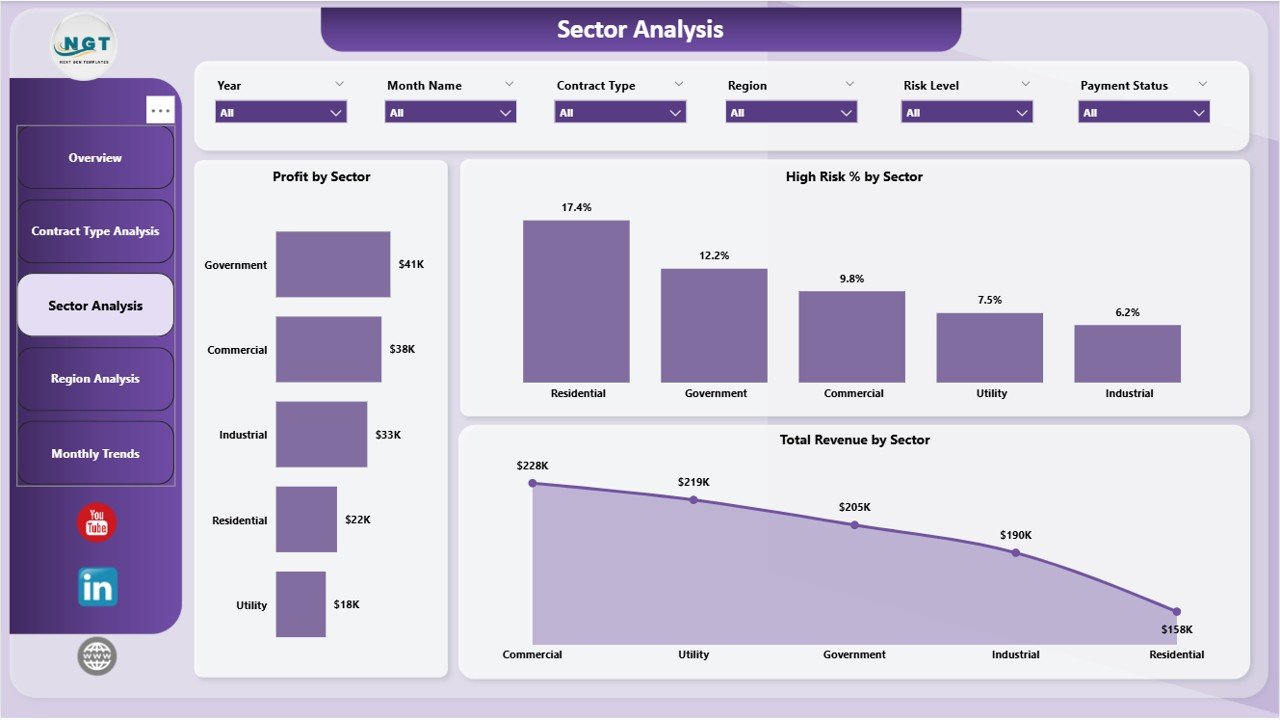
Sector Analysis Page
Evaluates how different industry sectors contribute to electricity contract profitability.
Charts include Profit by Sector, High Risk % by Sector, and Total Revenue by Sector.
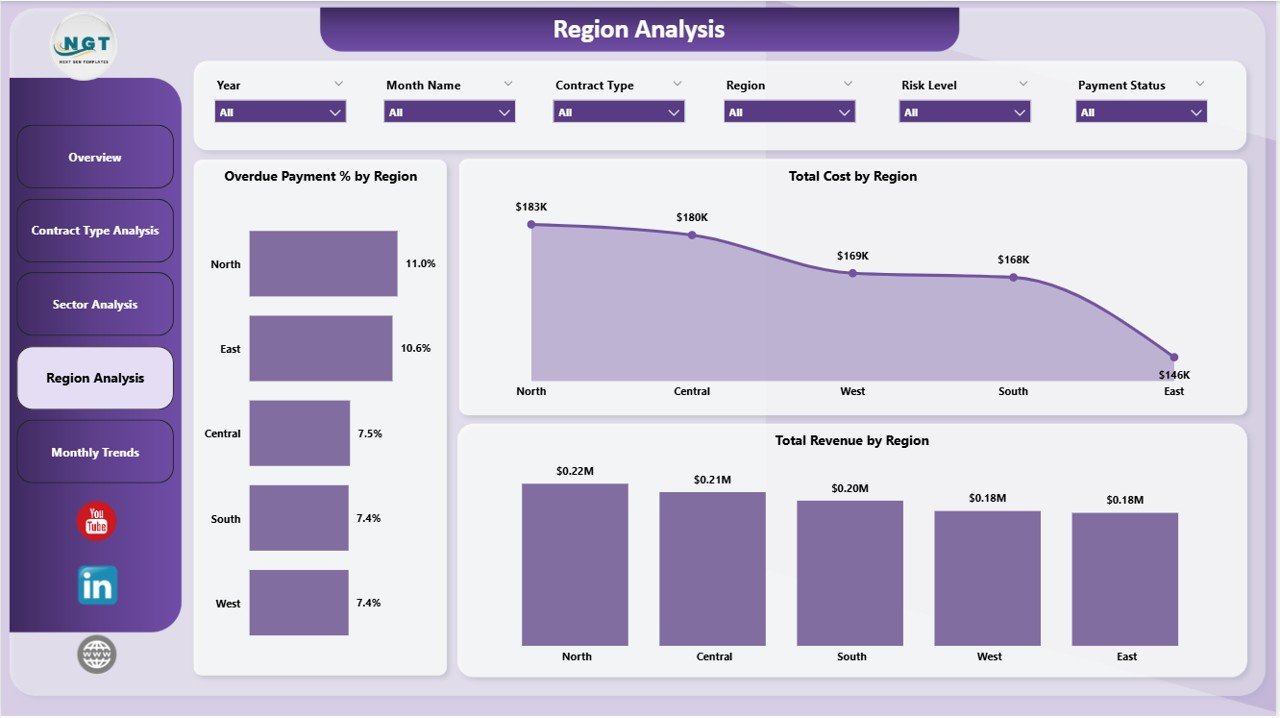
Region Analysis Page
Provides geographical analysis of contract performance.
Users can view metrics such as Overdue Payment % by Region, Total Cost by Region, and Total Revenue by Region.
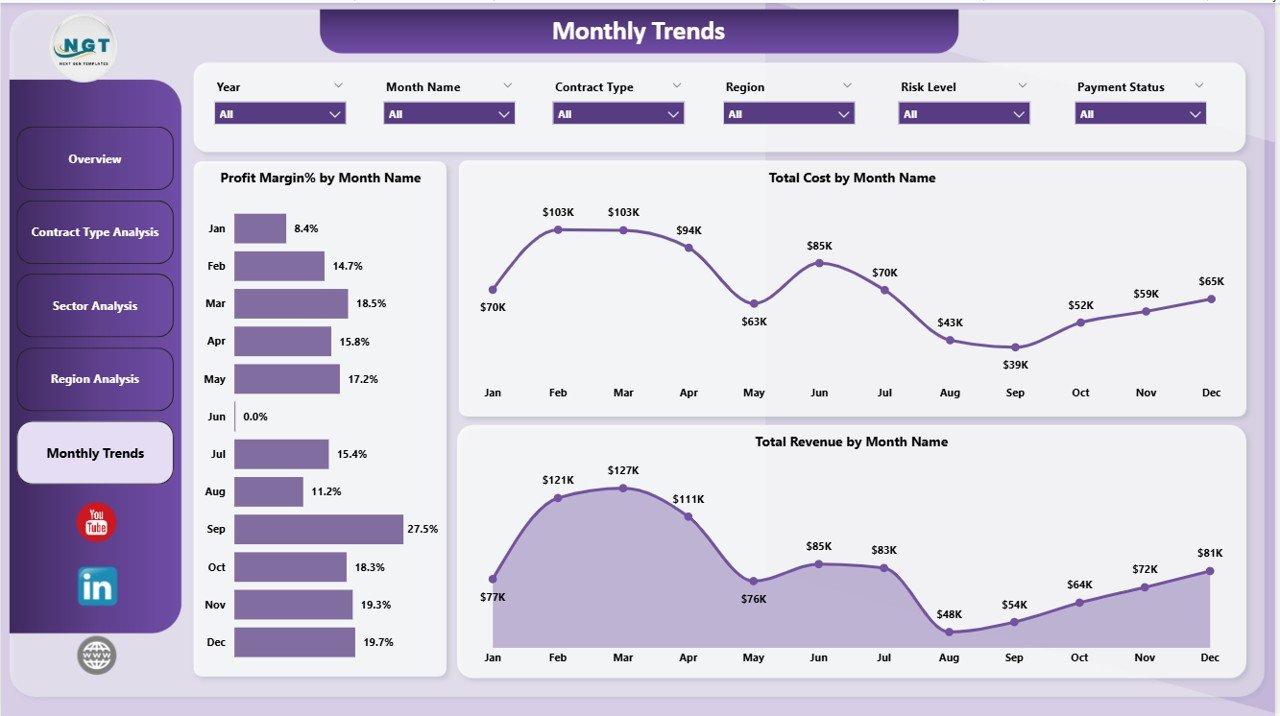
Monthly Trends Page
Tracks financial performance trends over time.
Charts display Profit Margin %, Total Cost, and Total Revenue by month.
Together, these pages provide a complete analytical overview of electricity contract operations.
🧭 How to Use the Electricity Contract Dashboard in Power BI
Using the dashboard is simple and requires only basic Power BI knowledge.
Step 1 – Import Contract Data
Upload electricity contract data including revenue, cost, region, sector, and contract type.
Step 2 – Refresh the Dashboard
Once the dataset is updated, Power BI automatically refreshes charts and KPI indicators.
Step 3 – Apply Interactive Filters
Use slicers to analyze specific contract types, sectors, regions, or sales managers.
Step 4 – Analyze Financial Performance
Review revenue, cost, and profit metrics to evaluate contract profitability.
Step 5 – Identify Risks and Opportunities
Use risk indicators and payment delay charts to detect potential issues early.
This workflow allows organizations to optimize electricity contract management.
👥 Who Can Benefit from This Electricity Contract Dashboard
This dashboard is ideal for organizations involved in electricity supply and energy contract management.
⚡ Electricity suppliers
🏭 Energy trading companies
🏢 Utility companies
📊 Financial analysts
📑 Contract managers
🌍 Energy sector consultants
📈 Business intelligence teams
Any organization managing electricity contracts can use this dashboard to improve financial visibility and contract performance monitoring.
Click hare to read the Detailed blog post
Visit our YouTube channel to learn step-by-step video tutorials
👉 https://youtube.com/@PKAnExcelExpert