


Educational nonprofits operate with a powerful mission—improving access to education and creating measurable social impact. However, managing programs, donors, funding, and performance without a clear analytics system often leads to delayed decisions and missed opportunities. That is exactly where the Educational Nonprofits KPI Dashboard in Power BI becomes a game-changing solution.
This ready-to-use Power BI dashboard is specially designed for education-focused nonprofit organizations that want complete visibility into their performance. Instead of juggling multiple Excel files and static reports, this dashboard transforms raw data into clear, interactive, and actionable insights. As a result, nonprofit leaders can track impact, monitor targets, and communicate results confidently to donors and stakeholders.Educational Nonprofits KPI Dashboard in Power BI
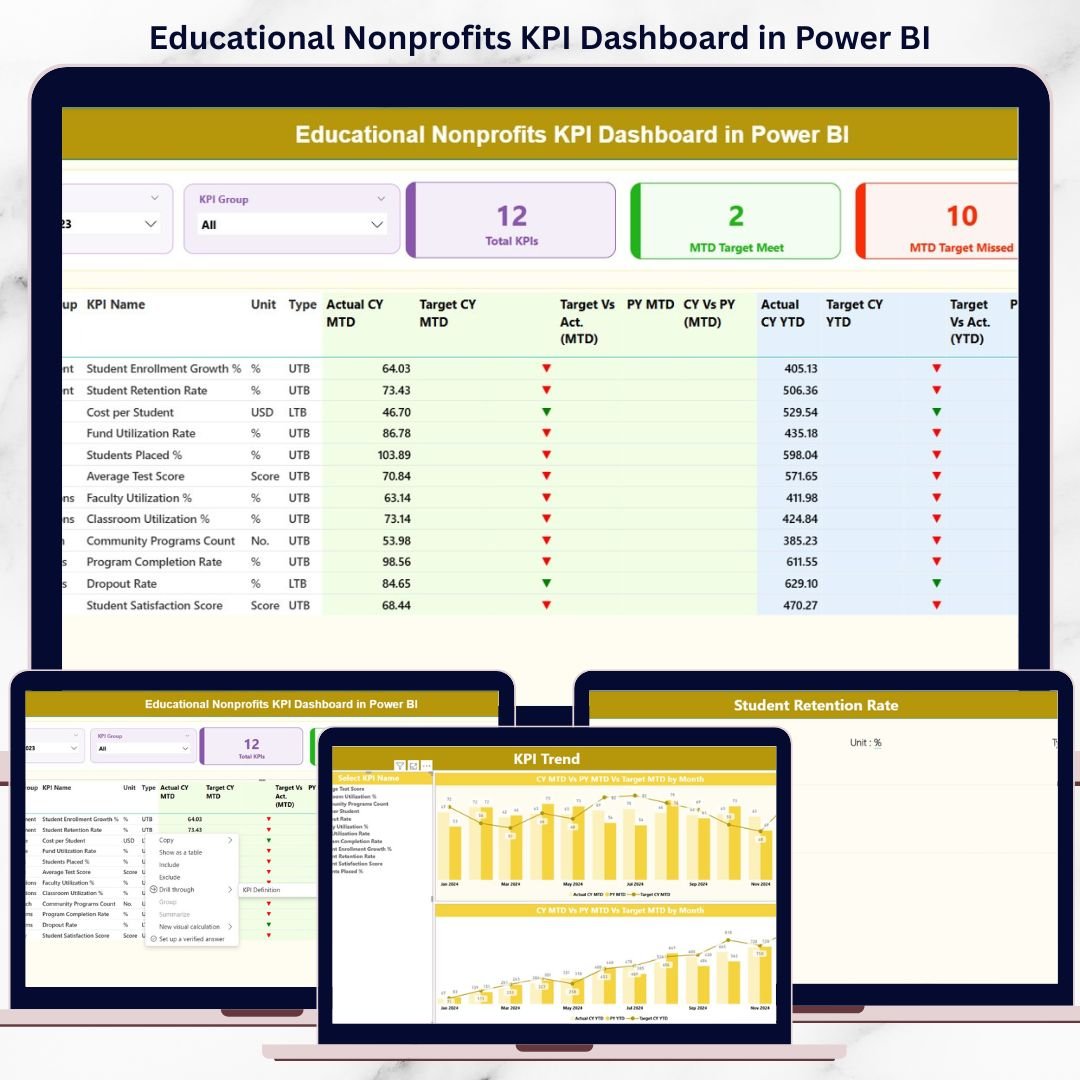
🚀 Key Features of Educational Nonprofits KPI Dashboard in Power BI
📊 Centralized KPI Monitoring – Track all critical nonprofit KPIs in one interactive Power BI dashboard without switching between reports.Educational Nonprofits KPI Dashboard in Power BI
📅 Dynamic Month & KPI Group Slicers – Instantly filter performance by reporting month and KPI category for focused analysis.
🎯 MTD & YTD Performance Tracking – Monitor Month-to-Date and Year-to-Date results side by side for short-term and long-term visibility.Educational Nonprofits KPI Dashboard in Power BI
📈 Target vs Actual Analysis – Quickly identify KPIs that meet or miss targets using visual icons and percentage comparisons.
🔁 Current Year vs Previous Year Comparison – Measure growth and improvement with automated CY vs PY performance metrics.Educational Nonprofits KPI Dashboard in Power BI
📉 Interactive Trend Analysis – Analyze KPI trends using combo charts to identify patterns, seasonality, and gaps.
📘 KPI Definition Drill-Through Page – Ensure transparency with clear KPI formulas, definitions, units, and KPI types.
📂 Excel-Based Data Input – Simple Excel sheets for data entry make this dashboard easy to maintain, even for non-technical users.

📦 What’s Inside the Educational Nonprofits KPI Dashboard in Power BI
This digital product includes a professionally structured Power BI file connected to an Excel data source.
🧩 Power BI Dashboard Pages
-
Summary Page – KPI cards, slicers, and a detailed KPI performance table
-
KPI Trend Page – MTD and YTD trend charts for selected KPIs
-
KPI Definition Page – Drill-through reference for KPI clarity and governance
📊 Excel Data Structure
-
Input_Actual Sheet – Enter MTD and YTD actual values by month
-
Input_Target Sheet – Enter MTD and YTD target values
-
KPI Definition Sheet – Define KPI group, unit, formula, definition, and type (LTB / UTB)
This structured setup ensures accuracy, consistency, and scalability as your nonprofit grows.
🛠️ How to Use the Educational Nonprofits KPI Dashboard in Power BI
✅ Step 1: Enter actual and target data in the provided Excel sheets
✅ Step 2: Update KPI definitions based on your organization’s goals
✅ Step 3: Refresh the Power BI file
✅ Step 4: Use slicers to analyze MTD, YTD, and trend performance
✅ Step 5: Share insights with leadership, donors, and board membersEducational Nonprofits KPI Dashboard in Power BI
Because calculations and visuals are already built, users focus only on analysis and decisions, not dashboard design.
👥 Who Can Benefit from This Educational Nonprofits KPI Dashboard
🎓 Nonprofit Executives – Gain instant visibility into organizational performance
📚 Program Managers – Track effectiveness and outcomes of educational programs
💰 Finance & Grant Teams – Monitor fund utilization and financial efficiency
📊 Monitoring & Evaluation Teams – Analyze performance trends and KPIs
🤝 Donor & Reporting Teams – Create transparent, data-driven donor reports
🏛️ Board Members – Review impact metrics clearly during meetings
This dashboard ensures every stakeholder works with the same accurate data and insights.
Click here to read the Detailed blog post
Visit our YouTube channel to learn step-by-step video tutorials:


Reviews
There are no reviews yet.